Co-culture and biogeography of Prochlorococcus and SAR11
The MIT Faculty has made this article openly available.
Please share
how this access benefits you. Your story matters.
Citation
Becker, Jamie W., et al. "Co-culture and biogeography of
Prochlorococcus and SAR11." The ISME Journal (2019) 13:1506–
1519 © 2019, The Author(s).
As Published
https://dx.doi.org/10.1038/S41396-019-0365-4
Publisher
Springer Science and Business Media LLC
Version
Final published version
Citable link
https://hdl.handle.net/1721.1/125545
Terms of Use
Creative Commons Attribution 4.0 International license
https://doi.org/10.1038/s41396-019-0365-4
A R T I C L E
Co-culture and biogeography of
Prochlorococcus and SAR11
Jamie W. Becker 1,3●Shane L. Hogle 1●Kali Rosendo1●Sallie W. Chisholm1,2
Received: 1 November 2018 / Revised: 3 January 2019 / Accepted: 18 January 2019 / Published online: 11 February 2019 © The Author(s) 2019. This article is published with open access
Abstract
Prochlorococcus and SAR11 are among the smallest and most abundant organisms on Earth. With a combined global population of about 2.7 × 1028cells, they numerically dominate bacterioplankton communities in oligotrophic ocean gyres and yet they have never been grown together in vitro. Here we describe co-cultures of Prochlorococcus and SAR11 isolates representing both high- and low-light adapted clades. We examined: (1) the influence of Prochlorococcus on the growth of SAR11 and vice-versa, (2) whether Prochlorococcus can meet specific nutrient requirements of SAR11, and (3) how co-culture dynamics vary when Prochlorococcus is grown with SAR11 compared with sympatric copiotrophic bacteria. SAR11 grew 15– 70% faster in co-culture with Prochlorococcus, while the growth of the latter was unaffected. When Prochlorococcus populations entered stationary phase, this commensal relationship rapidly became amensal, as SAR11 abundances decreased dramatically. In parallel experiments with copiotrophic bacteria; however, the heterotrophic partner increased in abundance as Prochlorococcus densities leveled off. The presence of Prochlorococcus was able to meet SAR11’s central requirement for organic carbon, but not reduced sulfur. Prochlorococcus strain MIT9313, but not MED4, could meet the unique glycine requirement of SAR11, which could be due to the production and release of glycine betaine by MIT9313, as supported by comparative genomic evidence. Ourfindings also suggest, but do not confirm, that Prochlorococcus MIT9313 may compete with SAR11 for the uptake of 3-dimethylsulfoniopropionate (DMSP). To give our results an ecological context, we assessed the relative contribution of Prochlorococcus and SAR11 genome equivalents to those of identifiable bacteria and archaea in over 800 marine metagenomes. At many locations, more than half of the identifiable genome equivalents in the euphotic zone belonged to Prochlorococcus and SAR11– highlighting the biogeochemical potential of these two groups.
Introduction
The global ocean is numerically dominated by Pro-chlorococcus and SAR11 (Pelagibacterales). Pro-chlorococcus, a cyanobacterium, is the most abundant
primary producer in tropical and subtropical waters, where its estimated 2.9 × 1027 cells produce ca. 4 Gt of organic carbon annually [1]. As such, they support a notable fraction of the secondary production in these nutrient-poor waters [2]. Members of the alphaproteo-bacteria known as SAR11 are found throughout the marine environment with an estimated global abundance of 2.4 × 1028cells, about half of which are in the euphotic zone [3]. Prochlorococcus and SAR11 together have been estimated to comprise roughly 40–60% of the total bac-teria in oligotrophic surface waters at Station ALOHA in the North Pacific [4].
Since its discovery three decades ago, Prochlorococcus has emerged as a powerful model organism for microbial ecology [5]. Its ecotype diversity is well-characterized [6–9] and there is an increasing wealth of genomic, tran-scriptomic, and proteomic information applied to this group [10–12]. The discovery of SAR11 a few years later further advanced our understanding of microbial ecology and evolution in the oligotrophic ocean [13,14]. SAR11 pos-sesses many traits that highlight adaptations to the
* Jamie W. Becker jbecker1@haverford.edu * Sallie W. Chisholm
chisholm@mit.edu
1 Department of Civil and Environmental Engineering, Massachusetts Institute of Technology, Cambridge, MA, USA 2 Department of Biology, Massachusetts Institute of Technology,
Cambridge, MA, USA
3 Present address: Department of Biology, Haverford College, Haverford, PA, USA
Supplementary information The online version of this article (https:// doi.org/10.1038/s41396-019-0365-4) contains supplementary material, which is available to authorized users.
123456789
0();,:
123456789
oligotrophic marine environment, including a small genome size [15, 16] and unique metabolic dependencies [17–20] partitioned among diverse ecotypes with distinct biogeo-graphy [21–24].
In addition to having large population sizes consisting of genetically distinct ecotypes, or clades, Prochlorococcus and SAR11 have adapted to their oligotrophic habitat by minimizing their genome content and metabolic versatility. SAR11 and high-light adapted Prochlorococcus have small cell sizes between 0.2 and 0.8 microns in diameter, small genomes (1.2–1.8 Mb) with low guanine-cytosine content (29–32%GC) [10,15], and fewer regulatoryσ-factors than would be predicted from the size of their genomes [25]. Low-light adapted Prochlorococcus genomes are larger (ca. 2.5 Mb) with higher guanine-cytosine content (33–50% GC), but are still relatively streamlined compared to copiotrophic bacteria. Genome reduction has resulted in the loss of metabolic capabilities in both Prochlorococcus and SAR11, some of which, such as reduction of oxidative stress [26] or a requirement for exogenous reduced sulfur [17] respectively, are provided by neighboring microbes. Likely as a result of these types of interdependencies, both taxa are difficult to isolate and maintain in vitro compared to faster-growing (r-selected) microbes; many of the same traits that confer a competitive advantage in their native habitat likely render them difficult to maintain in a laboratory.
Prochlorococcus and SAR11 cells can interact with each other in the surface ocean either directly or indirectly through the exchange of metabolites. Like all heterotrophs, SAR11 cells rely on organic matter derived from primary producers and recent experiments revealed that some members of the SAR11 clade likely rely heavily on organic compounds as an important source of phosphorus in addi-tion to carbon [27]. SAR11 also has several unique meta-bolic requirements that implicate potential mutualism with Prochlorococcus. For example, SAR11 exhibits auxotrophy for a thiamin precursor molecule found in spent medium from Prochlorococcus [20] and some strains have a glycine requirement that can be partially met by glycolate, a byproduct of Prochlorococcus photorespiration [2, 28]. Furthermore, evidence from comparative genomics and metabolic modeling suggests that Prochlorococcus and SAR11 may exchange glycolate, pyruvate, and malate through complementary and/or co-dependent metabolic pathways, and it is likely that the evolution of these two organisms has been tightly interwoven [29].
Despite the high abundances and frequently observed habitat overlap of Prochlorococcus and SAR11 in the tro-pical and subtrotro-pical oligotrophic ocean, a system for co-culturing and exploring interactions between members of these two model groups has remained elusive, largely due to their cryptic growth requirements and inherent challenges in
maintaining laboratory isolates. Here we report the devel-opment of stable (over 2 year) co-cultures of Pro-chlorococcus and SAR11, and explorations into the interrelated growth dynamics of these groups. Specifically, we sought to determine whether Prochlorococcus can pro-vide SAR11 with individual growth requirements and how SAR11/Prochlorococcus co-culture dynamics compare to co-cultures of Prochlorococcus and a suite of sympatric copiotrophic bacteria. We also report results from an updated global census, incorporating recently acquired metagenomic data that utilize a genome size-independent approach (genome equivalents) to highlight the collective dominance of Prochlorococcus and SAR11 in the surface ocean. The biogeography of Prochlorococcus and SAR11 provides a framework in which to understand the global impact potential of interactions between these groups. Co-cultures of Prochlorococcus and SAR11 constitute a novel and ecologically significant model system for the study of marine microbial ecology.
Materials and methods
Biogeography analysis
The computational steps for determining the genome equivalents of SAR11, Prochlorococcus and other identi-fiable bacteria and archaea are described in detail in sup-plementary methods. Briefly, we analyzed 195 surface, mixed layer, and deep chlorophyll maximum layer meta-genomes from the Tara oceans project [30–32], 480 meta-genome samples acquired during GEOTRACES cruises, and 133 metagenome samples from the HOT and BATS oceanographic time series [33]. Metagenome reads were Illumina adapter trimmed, quality filtered, and overlapped using the bbtools (BBMap V37.90) software suite [34]. We annotated the quality controlled metagenomes against a custom reference database of approximately 26,000 bac-terial, archaeal, viral, and microbial eukaryotic isolate, single cell, and metagenome and transcriptome assembled genomes compiled from various sources [35–43] using Kaiju (V1.6.0; [44]). The taxonomic composition of the reference database was intended to predominantly reflect that of the marine environment, while minimizing (but not excluding) the representation of clinical, industrial, and terrestrial host-associated genomes/samples. The majority of reads in our study (54% ± 10%) could be classified across all metagenomes using this approach (see supplementary methods). We extracted the reads from each metagenome classified by Kaiju as Prochlorococcus (genus), SAR11 (order Pelagibacterales), and bacteria/archaea (kingdom), and then quantified universal, single-copy marker genes within each taxonomically resolved pool using
MicrobeCensus (V1.1.1; [45]). The abundances of these marker genes were used to estimate ‘genome equivalents’ (the operational number of genomes represented by single-copy marker genes) within each taxonomically resolved read pool. We report abundances as marker-gene resolved genome equivalents rather than total classified reads due to systematic variations in the average genome size between groups like Prochlorococcus and SAR11 and the rest of the microbial community [45]. Here, the relative abundance of Prochlorococcus or SAR11 is defined by the fraction of Prochlorococcus or SAR11 genome equivalents divided by the total number of bacterial and archaeal genome equiva-lents that could be identified in each sample. Phylogenies presented in the supplemental material are derived from a concatenated protein multiple sequence alignment based on 120 taxonomically conserved single-copy marker genes [41, 46] and were inferred with RAxML (V8.2.9; [47]).
Strain selection and isolation
Prochlorococcus strains were chosen to represent clades with genetic and physiological distinctions that influence their biogeographic distributions [10,48] with a preference for strains isolated from the N. Atlantic Ocean, the place of origin of Pelagibacterales sp. HTCC7211 (Table 1). HTCC7211 was isolated in 2006 from 10 m at the Bermuda Atlantic Time-series Study site in the Sargasso Sea and is a
member of the abundant warm-water surface-dwelling Ia.3 ecotype [24] (Fig. S1). Several new strains of Pro-chlorococcus and heterotrophic bacteria were isolated to examine interactions between isolates from the same water sample– i.e. sympatric strains. Details regarding their isolation are included in Table 1 and supplementary methods.
Development of ProMS medium for growing both
Prochlorococcus and SAR11
While media recipes exist for culturing both Pro-chlorococcus [49] and SAR11 [28,50], none that we tested could support the growth of both strains. To this end, we established ProMS, a medium with a 0.2 µmfiltered, auto-claved Sargasso surface seawater base, that was capable of supporting the growth of each strain in both mono- and co-culture (Table S1). After autoclaving, the seawater was sparged with sterile CO2 followed by air to reestablish a
bicarbonate-based buffer system [51] and amended with sterile Pro99 nutrients [49] and organic compounds to meet the known unique metabolic requirements of SAR11 [52] as follows: pyruvate (1 µM), glycine (1 µM), methionine (0.2 µM), and the vitamin mix developed for AMS1 medium [28] diluted 50-fold. Organic additions were modeled after the medium developed by [28], with reduced concentrations designed to promote interactions.
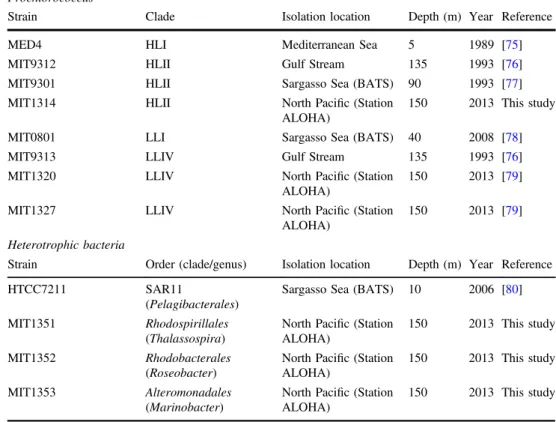
Table 1 Isolates used in this study. The phylogenetic affiliations of the Prochlorococcus and SAR11 strains are shown in Fig. S1
Prochlorococcus
Strain Clade Isolation location Depth (m) Year Reference
MED4 HLI Mediterranean Sea 5 1989 [75]
MIT9312 HLII Gulf Stream 135 1993 [76]
MIT9301 HLII Sargasso Sea (BATS) 90 1993 [77] MIT1314 HLII North Pacific (Station
ALOHA)
150 2013 This study MIT0801 LLI Sargasso Sea (BATS) 40 2008 [78]
MIT9313 LLIV Gulf Stream 135 1993 [76]
MIT1320 LLIV North Pacific (Station ALOHA)
150 2013 [79] MIT1327 LLIV North Pacific (Station
ALOHA)
150 2013 [79] Heterotrophic bacteria
Strain Order (clade/genus) Isolation location Depth (m) Year Reference
HTCC7211 SAR11
(Pelagibacterales)
Sargasso Sea (BATS) 10 2006 [80] MIT1351 Rhodospirillales
(Thalassospira)
North Pacific (Station ALOHA)
150 2013 This study MIT1352 Rhodobacterales
(Roseobacter)
North Pacific (Station ALOHA)
150 2013 This study MIT1353 Alteromonadales
(Marinobacter)
North Pacific (Station ALOHA)
In preparation for co-culture experiments, axenic SAR11 cells were first transferred from AMS1 medium amended with pyruvate (50 µM), glycine (50 µM) and methionine (10 µM) to ProMS medium. Prior to co-culturing experiments, monocultures of Prochlorococcus and SAR11 were maintained using ProMS medium in acid-washed autoclaved polycarbonate tubes at 22 °C under constant illumination (12 µmol photons m−2s−1) for >25 consecutive transfers (>100 generations).
Co-cultures of
Prochlorococcus and SAR11
Following acclimation of individual strains to ProMS med-ium, triplicate 6 ml batch co-cultures of SAR11 and diverse strains of Prochlorococcus were established at an initial ratio of 10:1 Prochlorococcus:SAR11 in acid-washed autoclaved polycarbonate tubes (10 ml capacity). Co-cultures were monitored for growth and purity byflow cytometry until both populations entered stationary and/or death phase.
0.0 0.5 1.0 0 2×10⁶ 4×10⁶ 6×10⁶ 8×10⁶ 1×10⁷ 1.2×10⁷ 1.4×10⁷ 0.0 0.5 1.0 0 2×10⁶ 4×10⁶ 0 2×10⁶ 4×10⁶ 6×10⁶ 0 ×106
relative abundance (genome equivalents)
distance along transect (m) 60°S 30°S 0° 30°N 60°N 60°S 30°S 0° 30°N 60°N 120°E 160°W 80°W 0° 80°E HOT BATS GA02 (N to S) GP13 (W to E) GA03 (W to E) GA10 (E to W) 0.0 0.5 1.0
N. Atlantic Med. Sea N. PacificRed Sea Indian S. Pacific S. Atlantic SO
Tara Oceans (N to S by Sample)
other bacteria + archaea SAR11 Prochlorococcus GA02 (GEOTRACES) GA03 (GEOTRACES) GA10 (GEOTRACES) GP13 (GEOTRACES) Tara Oceans GEOTRACES 40°S 40°N 1
distance along transect (m) GEOTRACES
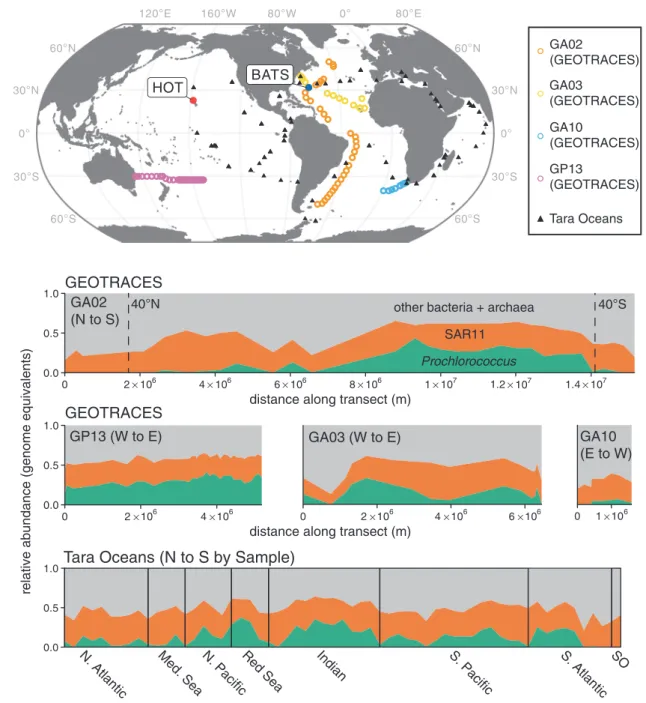
Fig. 1 Genome equivalents of Prochlorococcus and SAR11 relative to total identifiable bacteria and archaea in the surface ocean. (Upper) Locations of GEOTRACES, HOT and BATS Time-series, and Tara Oceans metagenome samples used for the analysis. (Lower) Vertical axes represent the abundance of Prochlorococcus (green) and SAR11 (red) genome equivalents relative to all other identifiable bacteria and
archaea (gray) throughout the upper 50 m of the global ocean. GEO-TRACES horizontal axes depict the distance along each transect, while the Tara Oceans horizontal axis displays evenly spaced samples organized by latitude (N to S) within each oceanic region. Forty degrees N/S are marked on the GA02 panel
Organic nutrient substitution experiments
Monocultures of SAR11 and co-cultures of SAR11 and Prochlorococcus strains MED4 and MIT9313 were condi-tioned (where possible) onto versions of ProMS medium lacking either pyruvate, glycine or methionine to examine the ability of Prochlorococcus to supply SAR11 with spe-cific nutrient requirements. SAR11 exhibited no change in maximum cell abundance in ProMS lacking pyruvate (likely due to the availability of compounds present in the Sargasso seawater base that can meet the central carbon requirement of SAR11), so the concentrations of glycine, methionine and vitamins in ProMS were increased 50-fold to create ProMC medium and induce pyruvate limitation.
Co-cultures of
Prochlorococcus and sympatric
copiotrophs
For experiments with sympatric Prochlorococcus and het-erotrophs, following acclimation of axenic strains to Pro99 medium, triplicate pairwise 6 ml batch co-cultures of Pro-chlorococcus strains MIT1314 and MIT1327 and hetero-trophic bacteria strains MIT1351, MIT1352 and MIT1353 were established at an initial ratio of either 150:1 or 300:1 Prochlorococcus:heterotrophic bacteria for co-cultures involving MIT1314 and MIT1327 respectively (Table 1). Mono- and co-cultures were maintained in acid-washed autoclaved borosilicate glass tubes (10 ml capacity) and monitored for growth and purity as described above.
Enumeration of cells
Cell concentrations were determined using a Guava Tech-nologies easyCyte 12HT flow cytometer (EMD Millipore) after staining with SYBR green I (Lonza) in the dark for at least 55 min. Samples were diluted in sterilized Sargasso seawater to ensure <500 cells µl−1 to avoid coincidence counting. Samples were run with only the blue (488 nm) excitation laser enabled for maximum power and popula-tions were resolved based on their green (525/30) and red (695/50) emission parameters.
Results and discussion
Co-occurrence of
Prochlorococcus and SAR11 in the
wild
We leveraged the recent expansion of marine metagenomic data to perform an updated global census of the Pro-chlorococcus genus and the Pelagibacterales order (here-after SAR11) by estimating their relative abundance throughout the global ocean. We examined 668 shotgun metagenomes with a broad geographic distribution collected within the euphotic zone [30–33] and 133 metagenomes from the Bermuda Atlantic Time-series (BATS) and Hawaii Ocean Time-series (HOT) [33]. Total metagenome recruit-ment combined with the enumeration of single-copy marker genes was used to estimate the contribution of each group to the total identifiable bacterial and archaeal genome equivalents in each sample (see supplementary methods for additional information).
The relative abundance of SAR11 ranged between 7 and 55% (Fig. 1). Their contribution was largely horizontally and vertically consistent in the euphotic zone, although somewhat lower at high latitudes and coastal sampling sites, and in deeper waters near the base of this zone (Fig.1and
BATS HOT
surface
DCM
base of euphotic zone
03 / 2003 06 / 2003 09 / 2003 12 / 2003 03 / 2004 06 / 2004 09 / 2004 12 / 2004 03 / 2003 06 / 2003 09 / 2003 12 / 2003 03 / 2004 06 / 2004 09 / 2004 12 / 2004 0.0 0.2 0.4 0.0 0.2 0.4 0.0 0.2 0.4 SAR11 Prochlorococcus Sp S F W Sp S F re
lative abundance (genome equivalents)
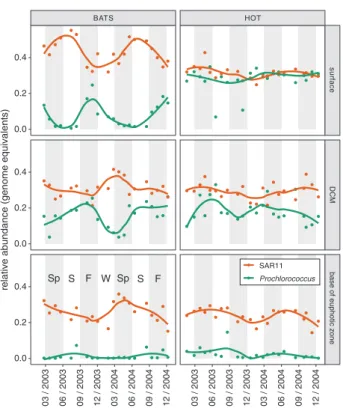
Fig. 2 Seasonality of Prochlorococcus (green) and SAR11 (red) esti-mated genome equivalents in metagenomes sampled from two ocean time series sites - the Bermuda Atlantic Time-series (BATS) and Hawaii Ocean Time-series (HOT). Vertical axes represent the abun-dance of each group (genome equivalents) relative to total identifiable bacteria and archaea genome equivalents, while horizontal axes represent time (month/year). Data are faceted by time series (hor-izontal) and depth (vertical). Surface samples are from within the mixed layer (≤25 m), DCM corresponds to the depth of maximum chlorophyll afluorescence, and the base of the euphotic zone is defined by the depth at which ca. 1% of surface photosynthetically active radiation remains (see [33] for details). Solid lines represent a local weighted regression analysis (LOESS) smooth function for each taxonomic group at each depth. Anomalously low abundances of Prochlorococcus are sporadically observed in surface waters at the HOT study site
S3). In contrast, the distribution of Prochlorococcus was bounded by 45 degrees N/S; its relative abundance began to decline sharply near 40 degrees N/S, consistent with pre-vious reports using other approaches [1, 8]. The relative abundance of Prochlorococcus ranged from undetectable to >45% in parts of the remote south Pacific Ocean (Fig. 1). The contribution of Prochlorococcus generally decreased with depth and light intensity and its maximum was typi-cally found in the upper 100 meters (Fig. S2). Between 40 degrees N/S in the upper 300 meters, the median ratio of Prochlorococcus to SAR11 genomes was 0.73, or roughly 3 Prochlorococcus cells for every 4 SAR11 cells (if one makes the large assumption that genome equivalents cor-respond directly to cell counts). The standard deviation of this value was large however (0.49), indicating high varia-bility in the ratio of these groups in the wild - from about 1:5 to 2:1 Prochlorococcus:SAR11.
Both Prochlorococcus and SAR11 are known to display seasonal growth dynamics [7, 53] – also evident here in metagenomes from the HOT and BATS time series sites (Fig. 2). In surface waters and the deep chlorophyll max-imum (DCM) layer at the BATS site, the relative abundance of Prochlorococcus varied from nearly undetectable during the spring, to over 20% of the identifiable bacterial and archaeal community in late autumn, as the depth of the mixed layer increased– consistent with previous reports [7]. In contrast, the relative abundance of SAR11 peaked when the mixed layer depth shoaled to its most shallow depth, consistent with previously reported patterns for members of the SAR11 Ia clade [23]. The relative abundances of Pro-chlorococcus and SAR11 displayed less seasonality in surface waters at station ALOHA, but did undergo sporadic oscillations (e.g. June 2003) that may reflect mesoscale events such as nutrient influxes, temperature shifts, water transport, or entrainment caused by eddies [54]. In sum-mary, the combined genome equivalents of Pro-chlorococcus and SAR11 regularly comprised more than half of the total identifiable bacteria and archaea in the euphotic zone of the oligotrophic tropical and subtropical ocean. We stress however, that metagenome-derived gen-ome equivalents may not directly correspond to con-centrations of viable cells, and furthermore, should not be interpreted as representing relative biomass, as these are among the smallest bacteria in the marine environment.
Co-culture of
Prochlorococcus and SAR11
Motivated by the overlapping biogeography of Pro-chlorococcus and SAR11 and their near ubiquity and high relative abundances in the surface ocean, we explored interactions between members of these groups by devel-oping co-cultures of Pelagibacterales sp. HTCC7211 and a number of Prochlorococcus strains representing high-light
and low-light adapted clades (Table1). HTCC7211 (here-after “SAR11”) was isolated from surface waters in the Sargasso Sea [55], making it an ideal candidate for co-culture with several of the Prochlorococcus strains isolated from the same location (Table1). Through many rounds of trial and error, we designed a natural seawater-based med-ium (ProMS) that could support the growth of both cell types independently (Table S1). The growth rate of SAR11 increased from 0.35 d−1 (s= 0.01 d−1) when grown in AMS1 medium to 0.41 d−1(s= 0.01 d−1) after acclimation to ProMS; however, the maximum cell abundance decreased from 1.1 × 10⁸ cells ml−1 to 7.5 × 10⁶cells ml−1 (Fig. S3) due to the decrease in organic nutrient con-centrations. The transfer of axenic Prochlorococcus from Pro99 to ProMS medium did not change its growth rate or maximum cell abundance.
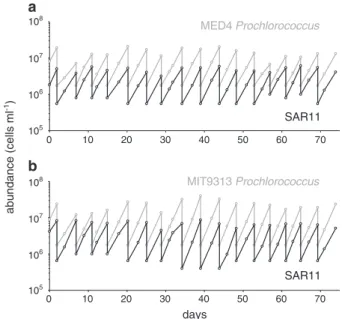
We then propagated the strains in semi-continuous co-culture, where they remained stable for at least 2 years (Fig. 3 and S4). The frequency and magnitude of culture dilution was determined from experience, based on the cell concentrations of Prochlorococcus: if they exceeded ca. 5 × 10⁸ cells ml−1, the culture would transition into stationary phase and the SAR11 population would decline rapidly (see below). If diluted below 106 cells ml−1, Prochlorococcus would display a lag phase or not grow at all – especially low-light adapted strains. Once stabilized within these limits, Prochlorococcus remained in log-phase growth if diluted to 1.25 × 10⁶ cells ml−1 every 3–4 days. Because dilution metrics were dictated solely by the density of
MED4 Prochlorococcus MIT9313 Prochlorococcus SAR11 SAR11 days 0 10 20 30 40 50 60 70 0 10 20 30 40 50 60 70 105 105 108 107 106 108 107 106 abundance (cells ml -1) a b
Fig. 3 Cell abundance as a function of time in log-phase, semi-continuous batch co-cultures of SAR11 (Pelagibacterales sp. HTCC7211) (black lines) and Prochlorococcus strain MED4 (a; gray line) and MIT9313 (b; gray line) in ProMS medium. Dilution fre-quency and volume were dictated by Prochlorococcus cell density (see text)
Prochlorococcus, there was no reason a priori that SAR11 abundances would remain in quasi-steady state. At mono-culture growth rates, SAR11 densities would have been diluted down to <1 cell ml−1within 3 months using these dilution rates. That they reached a quasi-steady state when grown with Prochlorococcus implies that the metabolisms of the autotroph and heterotroph became coupled in some way, resulting in a relatively constant Prochlorococcus to SAR11 cell ratio of 3:1 throughout the co-culture period. We note that, although close, this ratio falls outside of the range we observe in the wild, a likely consequence of the myriad differences between nature and our laboratory cul-tivation conditions, including the absence of other organ-isms and replete concentrations of inorganic nutrients provided for robust Prochlorococcus growth in ProMS medium.
Prochlorococcus and SAR11 growth dynamics in
batch co-cultures
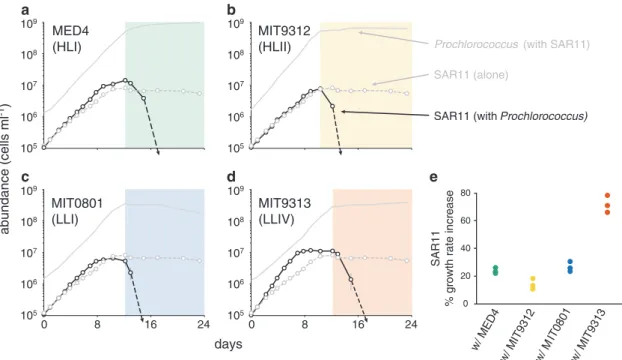
To examine these interactions in detail, SAR11 was co-cultured with 4 strains of Prochlorococcus representing two high-light adapted (HL) and two low-light adapted (LL) clades (Fig. S1, Table1). SAR11 and Prochlorococcus cells were taken from early log-phase axenic cultures, inoculated into co-culture, and their growth patterns were monitored in mono- and co-culture. The growth of Prochlorococcus was not significantly influenced by the presence of SAR11 over the entire growth curve (Fig. S5). SAR11 however, grew 15–70% faster (depending on the Prochlorococcus strain) in the co-cultures than it did when grown alone (Fig. 4). SAR11 always entered stationary phase earlier than Pro-chlorococcus in the co-cultures, reaching maximum cell abundances that were at, or slightly above (up to twofold higher) those attained in monoculture (Fig.4).
Precisely when Prochlorococcus entered stationary phase (beginning of colored shading in Fig.4), SAR11 cell concentrations declined abruptly to below detection limits– in striking contrast to its behavior when grown alone where cell numbers simply level off in stationary phase (Fig. 4). The antagonistic effect of the co-culture conditions on SAR11 was apparent for all Prochlorococcus strains, revealing a condition-dependent shift likely caused by a growth phase-specific release of metabolites from Pro-chlorococcus, as has been observed in eukaryotic phyto-plankton [56, 57]. Certain amino acids and osmolytes at high concentrations have been shown to slow or even prohibit the growth of this SAR11 strain [18,58], providing targets for further metabolomic exploration. Carini et al. observed increases in DNAfluorescence due to the presence of elongated cell doublets for a different SAR11 strain (HTCC1062) experiencing pyruvate limitation, and went on to show that both the ratio of pyruvate:glycine and the
concentration of alanine affected the degree of doublet formation [28]. Interestingly, we observe a similar increase in DNA fluorescence for HTCC7211 in co-culture with Prochlorococcus occurring at the precise moment when Prochlorococcus populations cease logarithmic growth and begin transitioning to stationary phase (Fig. S6). This sug-gests that as Prochlorococcus slows its growth rate, it may be impacting nutrient stoichiometry in a manner that dis-rupts the central carbon metabolism of SAR11. The concept of a dependence on specific nutrient ratios for efficient metabolic functioning and regulation has been presented as a possible consequence of genome streamlining in microbes such as SAR11 [25].
Prochlorococcus co-cultured with sympatric
copiotrophic bacteria
Although all but one of the Prochlorococcus strains dis-cussed above were isolated from the same ocean as the SAR11 strain, they were not isolated from the same water sample; our attempts to isolate truly sympatric Pro-chlorococcus and SAR11 failed. We did, however, isolate two new Prochlorococcus strains (MIT1314 - HLII clade, and MIT1327 - LLIV clade, see Fig. S1, Table 1) along with a number of sympatric copiotrophic heterotrophic bacteria – i.e. strains that grow rapidly in media rich in organic matter. These heterotrophic strains have genomic characteristics (4.4 Mb; 55–59%GC) typical of copiotrophic bacteria [59] and represent taxa found at low abundances in the oligotrophic ocean, except when subjected to episodic disturbances [60]. We studied 3 of these– Thalassospira sp. MIT1351, Roseobacter sp. MIT1352, and Marinobacter sp. MIT1353–in co-culture with sympatric Prochlorococcus to compare with SAR11 patterns (Table1).
In contrast to SAR11, which would not grow alone in Pro99 medium [49] unless amended with labile substrates to meet its unique metabolic requirements (see Methods, Table S1), the copiotrophic strains grew appreciably in unamended Pro99 medium, apparently using their more diverse metabolic repertoire to subsist on residual organic carbon in the natural seawater base of the medium. Thus we used unamended Pro99 medium in this set of experiments. Similar to the results with SAR11, the presence of the copiotrophic bacteria did not greatly influence the growth of Prochlorococcus cultures during log phase. The presence of Marinobacter MIT1353 did, however, increase the growth rate of Prochlorococcus MIT1314 slightly (from 0.64 d−1 to 0.68 d−1) and the presence of all three copiotrophs resulted in slightly higher maximum densities of MIT1314 relative to growth alone (Fig. S7). In addition, Pro-chlorococcus MIT1327 was somewhat rescued from declining cell numbers in death phase by all three of the copiotrophic strains (Fig. S7). Similar enhancements have
been observed before [61,62] and are usually attributed to the ability of catalase-containing bacteria to detoxify reac-tive oxygen species in their surrounding environment [26, 63]. This mechanism may also play a role here, as all three copiotrophic strains possess the gene necessary for catalase production. However, SAR11 HTCC7211 also possesses a catalase gene, yet it had no effect on Prochlorococcus growth (Fig. S5). It is unclear why, but copiotrophic cata-lase mutants have also been shown to rescue the growth of Prochlorococcus from low densities, and the addition of exogenous catalase alone cannot replicate co-culture responses [64]. Furthermore, transcriptional studies of co-cultures suggest interactions between Prochlorococcus and copiotrophic bacteria beyond those related to oxidative stress [65,66]. Our results support the notion that diverse copiotrophic bacteria facilitate Prochlorococcus growth and that these benefits are due in part to factors other than the production of catalase.
The response of the three copiotrophic bacteria to the presence of Prochlorococcus was strikingly different from that of SAR11, especially given that there are no added organic compounds in Pro99 medium. All three strains had an initial phase of rapid logarithmic growth (growth rate= 5.0–7.7 d−1; about an order of magnitude faster than that of SAR11), whether alone or in the presence of Pro-chlorococcus, presumably consuming organic matter
present in the natural seawater base of the medium (Fig.5). Thalassospira MIT1351 and Roseobacter MIT1352 reached higher cell abundances before entering stationary phase when grown with Prochlorococcus compared to growth alone (Fig. 5a–d), while this was not the case for Marinobacter sp. MIT1353 (Fig.5e, f). In stark contrast to the SAR11/Prochlorococcus co-cultures, all three copio-trophs pulled out of stationary phase and resumed growth (at a rate of 0.49–0.82 d−1) when Prochlorococcus popu-lations entered stationary phase (Fig. 5 shaded regions), displaying a diauxic growth pattern. This suggests that conditions produced by Prochlorococcus that are toxic to an oligotroph (e.g. SAR11) are ideal for opportunistic bacteria such as these, with more diverse functional repertoires and regulatory capabilities. Comparative genomic analysis reveals that all three copiotrophic bacteria possess more genes related to sugar catabolism, hydrolysis and beta-oxidation of fatty acids, binding of extracellular solutes, and transcriptional regulation than SAR11 HTCC7211, high-lighting the contrasting degrees of metabolic flexibility among these strains (Table S2).
As mentioned above, a caveat in comparing these two sets of experiments is that the co-culture medium used in the SAR11 experiments was augmented with pyruvate, glycine, methionine, and pico- to nanomolar concentrations of 9 vitamins (Table S1), whereas the medium in the
0 8 16 24 105 109 108 107 106 105 109 108 107 106 105 109 108 107 106 105 109 108 107 106 0 8 16 24 days abundance (cells ml
-1) SAR11 (with Prochlorococcus)
SAR11 (alone) MED4 (HLI) MIT9313 (LLIV) MIT0801 (LLI) MIT9312
(HLII) Prochlorococcus (with SAR11)
0 80 60 40 20 SAR11 % gr
owth rate incr
ease w/ MED4 w/ MIT9312 w/ M IT0801 w/ MIT9313 a c b d e
Fig. 4 Growth of Prochlorococcus strains MED4 a, MIT9312 b, MIT0801 c and MIT9313 (d; solid gray lines in a-d reproduced from Fig. S5) and SAR11 (Pelagibacterales sp. HTCC7211) (black lines) in co-culture compared to the growth of SAR11 monocultures (dashed gray lines). Growth curves for Prochlorococcus monocultures are presented in Fig. S5. Shaded regions denote the interval when Pro-chlorococcus are in stationary phase. SAR11 cells were undetectable
in co-culture with Prochlorococcus after day 12–15 (dashed black arrows). Circles represent the mean (±s.d.) of biological triplicates. Error bars are smaller than the size of the symbols where not visible. Dot plot e depicts percent increases in SAR11 growth rate due to the presence of each Prochlorococcus strain. The growth rate of SAR11 alone was 0.41 day−1
copiotroph experiments was unamended with organics. Despite this difference, the comparison is illuminating, given that the organic additions cannot explain the abrupt decline in SAR11 populations when Prochlorococcus enters stationary phase. The amensal phenotype with SAR11 was also observed in co-cultures with Pro-chlorococcus lacking exogenous pyruvate and glycine additions (data not shown), providing further support that these organics are not contributing to the disparate responses of SAR11 and copiotrophic bacteria in the co-cultures.
Prochlorococcus can fulfill the central carbon
requirement of SAR11
Low-molecular weight organic acids, including pyruvate, lactate, oxaloacetate, acetate, and taurine are central carbon
sources for SAR11, including non-glycolytic strains like HTCC7211 [19, 28]. To determine whether Pro-chlorococcus can provide a central carbon source to SAR11, we grew the latter with two strains of Pro-chlorococcus –MED4 (HLI clade) and MIT9313 (LLIV clade) – in a medium with no added pyruvate (ProMC). Pyruvate is thought to be an essential central carbon com-pound available to all SAR11 [52,67] and it was removed in order to drive the system toward pyruvate starvation. To ensure pyruvate limitation we increased the concentration of all other organic compound additions in ProMC (i.e. gly-cine, methionine, and 9 vitamins) 50-fold above ProMS levels, matching concentrations used to achieve maximum SAR11 densities [28]. A treatment with pyruvate added (50 µM) to ProMC served as a positive control. While the maximum abundance of SAR11 was reduced nearly 50-fold compared to the positive control when grown alone in
0 5 10 15 20 0 5 10 15 105 109 108 107 106 104 days abundance (cells ml -1) copiotrophic bacteria (with Prochlorococcus) MIT1314 (HLII) Prochlorococcus
(with copiotrophic bacteria) MIT1327 (LLIV) MIT1351 Thalassospira MIT1352 Roseobacter MIT1353 Marinobacter 105 109 108 107 106 104 105 109 108 107 106 104 0 0 0 0 0 0 0 0 0 0 0 0
copiotrophic bacteria (alone)
a f d e c b 5 9 8 7 6 4 5 9 8 7 6 4 20 Fig. 5 Growth of
Prochlorococcus (solid gray lines, reproduced from Fig. S7) and copiotrophic bacteria (black lines) in co-culture compared to the growth of copiotrophic bacterial monocultures (dashed gray lines). Growth curves for Prochlorococcus monocultures are presented in Fig. S7. Shaded regions denote the interval when Prochlorococcus are in stationary phase. Thalassospira MIT1351 monocultures were indistinguishable from instrument noise after day 7, precluding reliable
determination of cell
concentrations. Circles represent the mean (±s.d.) of biological triplicates. Error bars are smaller than the size of the symbols where not visible
ProMC, it was reduced only sevenfold and ninefold, respectively, in co-culture with MIT9313 and MED4. This could not be attributed to pyruvate carryover, as these results were obtained after extended semi-continuous cul-turing in ProMC over several months to remove any resi-dual pyruvate (Fig. 6a). We conclude that both strains of Prochlorococcus produce and release organic matter that fulfills the central carbon requirement of SAR11.
What is Prochlorococcus supplying to SAR11 in these experiments? There are several candidate compounds. Prochlorococcus cells have been shown to release 9–24%
of the inorganic carbon they assimilate as dissolved organic carbon, 4–20% of which is thought to be in the form of low molecular weight carboxylic acids, including glycolate, acetate and perhaps lactate [2]. Acetate and lactate can replace pyruvate for SAR11 growth [19]. Pyruvate is also predicted to be exported by Prochlorococcus as part of a strategy to maintain the cell’s redox balance [29]. Based solely on the SAR11 abundance data, it appears that Pro-chlorococcus MIT9313 provides additional labile central carbon substrates to SAR11on a per cell basis compared to MED4. maximum abundance (cells ml -1) maximum abundance (cells ml -1) maximum abundance (cells ml -1) 105 108 107 106 abundance (cells ml -1) abundance (cells ml -1) abundance (cells ml -1) 108 107 106 0 5 10 15 20 25 days SAR11 (alone +pyr)
SAR11 (alone)
SAR11
(with MIT9313 Prochlorococcus) SAR11
(with MED4 Prochlorococcus)
107 106 107 106 0 5 10 days
SAR11 (alone +gly) SAR11 (alone)
SAR11
(with MIT9313 Prochlorococcus)
SAR11
(with MED4 Prochlorococcus)
107 106 107 106 2 1 8 0 4 days SAR11 (alone)
SAR11 (alone subDMSP)
SAR11
(with MIT9313 Prochlorococcus)
SAR11
(with MIT9313 Prochlorococcus subDMSP)
a c b w/ MED4 w/ MIT 9313 w/ MED4 w/ MIT 9313 w/ M IT9313 SAR11 SAR11 SAR11 + pyr SAR11 + gly SAR11 SAR11 subD MSP w/ MIT9313subDMSP
Fig. 6 Growth of SAR11 (Pelagibacterales sp. HTCC7211) monocultures in the presence (black lines) and absence (dashed gray lines) of pyruvate a and glycine b compared to growth of SAR11 in co-culture with
Prochlorococcus strains MED4 (green lines) and MIT9313 (red lines) in the absence of pyruvate a and glycine b. Panel c shows the growth of SAR11
monocultures in the presence of methionine (black line) or 3-dimethylsulfoniopropionate (DMSP; dashed gray line) compared to growth of SAR11 in co-culture with MIT9313 in the presence of methionine (red line) or DMSP (dashed violet line). Circles represent the mean (±s.d.) of biological triplicates. Error bars are smaller than the size of the symbols where not visible. Dot plots on the right depict the maximum cell densities obtained for each treatment. Dots are colored to match the corresponding lines in the adjacent growth curves
Prochlorococcus MIT9313, but not MED4, can meet
the glycine requirement of SAR11
SAR11 cells lack canonical genes for the biosynthesis of serine and glycine and instead rely on an exogenous source of these amino acids or their precursors [18]. To test whe-ther Prochlorococcus cells can meet this unique SAR11 requirement, we removed glycine from the ProMS medium (ProMS -gly) and monitored the growth of SAR11 mono-cultures and co-mono-cultures with Prochlorococcus strains MED4 or MIT9313 after several months of semi-continuous culture to remove any traces of glycine carry-over. While SAR11 monocultures were able to grow in the ProMS -gly medium - indicating that the Sargasso seawater base supplied a source of glycine, serine, or precursors of these amino acids - its maximum abundance was fourfold lower than when grown in monoculture with 1 µM glycine. Co-culture with MED4 had no effect on this low yield, indicating that it did not provide a source of glycine or glycine substitutes to SAR11 (Fig.6b). When in co-culture with MIT9313; however, the maximum abundance of SAR11 equaled or slightly surpassed that observed in monocultures with 1 µM glycine added. Thus, MIT9313, but not MED4, can fulfill the glycine requirement of SAR11.
It was initially surprising to us that MED4 was unable to meet SAR11’s glycine requirement, given that glycolate has been shown to substitute for glycine in SAR11 cultures [28] and glycolate production has been reported for MED4 in quantities that should have been sufficient to show an effect in our experiments [2]. The strain of SAR11 used by Carini et al (2013) was HTCC1062 (Ia.1 clade) however, and that used in our studies was HTCC7211 (Ia.3 clade). As it turns out, while HTCC1062 has the genes necessary to transport glycolate into the cell (SAR11_0274) and convert it to glyoxylate (glcDEF), a precursor of glycine [28], HTCC7211 does not, thus explaining why glycolate pro-duction by MED4 could not replace glycine in our experiments.
The most likely compound driving these disparate responses is the osmolyte glycine betaine, which has also been shown to substitute for glycine in SAR11 HTCC1062 [18,28]. SAR11 HTCC7211, the strain used in our experiments, has all the genes necessary for the uptake of glycine betaine and its conversion to glycine [68]. Prochlorococcus MIT9313, and other members of its LLIV clade, have the genes responsible for the bio-synthesis of glycine betaine (gbmt1/2), along with three genes that encode an ABC transporter for this molecule (proVWX) [69]. Accumulation of glycine betaine has been reported in MIT9313 [70] and a recent study has shown that this accumulation can be quite significant – up to 20%
of the cell’s dry weight (K. Longnecker, E. Kujawinski, personal communication). Production of glycine betaine by Prochlorococcus is restricted to the LLIV clade and is thus absent in MED4, further supporting the hypothesis that glycine betaine production by LLIV Prochlorococcus cells can fulfill the glycine requirement for SAR11 growth.
Prochlorococcus and the reduced sulfur requirement
of SAR11
SAR11 cells do not contain the full complement of genes necessary for assimilatory sulfate reduction, thus they rely on the production and release of reduced organic sulfur compounds such as methionine, methanethiol, or 3-dimethylsulfoniopropionate (DMSP) by other microbes for their survival [17, 71]. To determine if Prochlorococcus could fulfill this requirement, we eliminated methionine – the only source of reduced sulfur – from the medium (ProMS -met). Neither strain of Prochlorococcus tested (MED4 and MIT9313) could meet SAR11’s need for reduced sulfur (data not shown).
During the initial transfers of this experiment, when the cells were growing on residual methionine, we noticed that the maximum abundance of SAR11 was 1.5-fold lower when co-cultured with Prochlorococcus MIT9313 (LLIV clade) vs. growth alone or with Pro-chlorococcus MED4 (HLI clade). Similar results were obtained with another Prochlorococcus strain from the LLIV clade (MIT1320, data not shown), suggesting that the LLIV strains may have been competing with SAR11 for a source of reduced sulfur in the Sargasso seawater medium base. Indeed, Prochlorococcus populations in the wild have been shown to take up DMSP [72] and, consistent with our observations, the genes required for the transport of DMSP (proVWX; the same transporters used for glycine betaine) [69, 73,74] are found only in members of the LLIV clade of Prochlorococcus. To directly address the possibility of competition, we grew SAR11 alone and in co-culture with MIT9313 in a ver-sion of ProMS in which the methionine was replaced with an equimolar concentration of DMSP. SAR11 maximal abundances in co-culture with Prochlorococcus MIT9313 were 2-fold lower than those in monoculture, providing indirect evidence that MIT9313 may be con-suming DMSP in the seawater background, and therefore compete with SAR11 for this reduced sulfur source (Fig.6c). Thus, not only can the Prochlorococcus strains tested not satisfy the reduced sulfur requirement of SAR11, but it is possible that LLIV Prochlorococcus may be competing with SAR11 for some forms, such as DMSP, in the wild.
Summary and concluding remarks
SAR11 grew faster in co-culture with Prochlorococcus than in monoculture, while the growth of Prochlorococcus was largely unaffected, indicating the production and release of growth factors by Prochlorococcus and a commensal rela-tionship (one organism benefits, while the other is not affected) between these organisms under the conditions tested. This relationship became abruptly amensal (one organism is harmed, while the other is not affected) when Prochlorococcus cells entered stationary phase, at which point we observed increased DNAfluorescence of SAR11 populations followed by a rapid decline in SAR11 abun-dance. That stationary phase Prochlorococcus cells instead triggered a secondary logarithmic growth phase in diverse copiotrophic bacteria highlights the disparate metabolic capabilities of oligotrophic and copiotrophic marine bac-teria and calls for further mechanistic studies. Similarly, the variable growth response of SAR11 in co-culture with Prochlorococcus strains belonging to different clades demonstrates the complexity and taxonomic specificity of potential interactions in these autotroph/heterotroph pair-ings. Furthermore, Prochlorococcus MIT9313 enhanced SAR11 growth in co-culture under pyruvate and glycine limited conditions, but had the opposite effect when methionine was limiting, highlighting yet another layer in the complexity of this simple co-culture system. Increased DNA fluorescence per cell was observed for SAR11 populations experiencing pyruvate, glycine, and methionine limiting conditions, consistent with previous observations of cell doublet formation in response to imbalanced nutrient ratios [28]. We also observed increased DNA fluorescence for replete batch cultures in late stationary phase, suggesting this may be a common phenotype for SAR11 HTCC7211 populations prior to cell death.
Collectively, our experimentalfindings reveal the clade-specific ability of Prochlorococcus to increase the growth rate and fulfill some of the unique metabolic requirements of SAR11, while our biogeographic analyses reinforce the notion that these are two of the most ubiquitous and numerically abundant marine bacteria on Earth. Recogniz-ing that laboratory batch cultures cannot mimic environ-mental conditions, studies of simplified model systems, such as the one described here, lay the foundation for future testing of hypotheses under more realistic conditions in the wild. Now that the steady-state co-culturing of these two iconic marine microbes is possible, follow up studies tracking their transcriptomes, proteomes and metabolomes will help identify the chemical exchanges and physiological dependencies that define their interactions.
Acknowledgements We thank Stephen Giovannoni and Amy Carter for preparation and shipment of SAR11 strain HTCC7211 and Jessica
Berta-Thompson and Kristen LeGault for assisting in the isolation and purification of Prochlorococcus strain MIT1314. We also thank Thomas Hackl, Steven Biller, Paul Berube, Brandon Satinsky and Rogier Braakman for helpful discussions, and Ben Temperton for comments provided during the review process that significantly improved the manuscript. This work was supported in part by grants from the National Science Foundation (OCE-1153588 and DBI-0424599 to S.W.C.), the Simons Foundation (Life Sciences Project Award ID 337262, S.W.C; SCOPE Award ID 329108, S.W.C), and the Gordon and Betty Moore Foundation (Grant IDs GBMF495 and GBMF4511 to S.W.C.). This paper is a contribution from the Simons Collaboration on Ocean Processes and Ecology (SCOPE) and from the NSF Center for Microbial Oceanography: Research and Education (C-MORE).
Author contributions J.W.B. designed and performed experiments, analyzed data and wrote the manuscript with contributions from all authors; S.L.H. performed bioinformatic analyses and writing related to biogeography; K.R. performed experiments involving copiotrophic bacteria; S.W.C. designed experiments and supervised the project.
Compliance with ethical standards
Conflict of interest The authors declare that they have no conflict of interest.
Publisher’s note: Springer Nature remains neutral with regard to jurisdictional claims in published maps and institutional affiliations. Open Access This article is licensed under a Creative Commons Attribution 4.0 International License, which permits use, sharing, adaptation, distribution and reproduction in any medium or format, as long as you give appropriate credit to the original author(s) and the source, provide a link to the Creative Commons license, and indicate if changes were made. The images or other third party material in this article are included in the article’s Creative Commons license, unless indicated otherwise in a credit line to the material. If material is not included in the article’s Creative Commons license and your intended use is not permitted by statutory regulation or exceeds the permitted use, you will need to obtain permission directly from the copyright holder. To view a copy of this license, visithttp://creativecommons. org/licenses/by/4.0/.
References
1. Flombaum P, Gallegos JL, Gordillo RA, Rincón J, Zabala LL, Jiao N, et al. Present and future global distributions of the marine Cyanobacteria Prochlorococcus and Synechococcus. Proc Natl Acad Sci USA. 2013;110:9824–9.
2. Bertilsson S, Berglund O, Pullin MJ, Chisholm SW. Release of dissolved organic matter by Prochlorococcus. Vie Et Milieu. 2005;55:225–32.
3. Morris RM, Rappé MS, Connon SA, Vergin KL, Siebold WA, Carlson CA, et al. SAR11 clade dominates ocean surface bac-terioplankton communities. Nature. 2002;420:806–10.
4. Eiler A, Hayakawa DH, Church MJ, Karl DM, Rappé MS. Dynamics of the SAR11 bacterioplankton lineage in relation to environmental conditions in the oligotrophic North Pacific sub-tropical gyre. Environ Microbiol. 2009;11:2291–300.
5. Coleman ML, Chisholm SW. Code and context: Prochlorococcus as a model for cross-scale biology. Trends Microbiol. 2007; 15:398–407.
6. Rocap G, Larimer FW, Lamerdin J, Malfatti S, Chain P, Ahlgren NA, et al. Genome divergence in two Prochlorococcus ecotypes reflects oceanic niche differentiation. Nature. 2003; 424:1042–7.
7. Malmstrom RR, Coe A, Kettler GC, Martiny AC, Frias-Lopez J, Zinser ER, et al. Temporal dynamics of Prochlorococcus ecotypes in the Atlantic and Pacific oceans. ISME J. 2010;4:1252–64. 8. Johnson ZI, Zinser ER, Coe A, McNulty NP, Woodward EMS,
Chisholm SW. Niche partitioning among Prochlorococcus eco-types along ocean-scale environmental gradients. Science. 2006;311:1737–40.
9. Kettler GC, Martiny AC, Huang K, Zucker J, Coleman ML, Rodrigue S, et al. Patterns and implications of gene gain and loss in the evolution of Prochlorococcus. PLoS Genet. 2007;3:2515–28. 10. Biller SJ, Berube PM, Berta-Thompson JW, Kelly L, Roggensack
SE, Awad L, et al. Genomes of diverse isolates of the marine cyanobacterium Prochlorococcus. Sci Data. 2014;1:140034–11. 11. Ottesen EA, Young CR, Gifford SM, Eppley JM, Marin R, Schuster
SC, et al. Multispecies diel transcriptional oscillations in open ocean heterotrophic bacterial assemblages. Science. 2014; 345:207–12.
12. Waldbauer JR, Rodrigue S, Coleman ML, Chisholm SW. Tran-scriptome and proteome dynamics of a light-dark synchronized bacterial cell cycle. PLoS ONE. 2012;7:e43432.
13. Giovannoni SJ. SAR11 Bacteria: the most abundant plankton in the oceans. Annu Rev Marine Sci. 2017;9:231–55.
14. Giovannoni SJ, Britschgi TB, Moyer CL, Field KG. Genetic diversity in Sargasso Sea bacterioplankton. Nature. 1990;345:60–3. 15. Giovannoni SJ, Tripp HJ, Givan S, Podar M, Vergin KL, Baptista D, et al. Genome streamlining in a cosmopolitan oceanic bacter-ium. Science. 2005;309:1242–5.
16. Luo H, Thompson LR, Stingl U, Hughes AL. Selection maintains low genomic GC content in marine SAR11 lineages. Mol Biol Evol. 2015;32:2738–48.
17. Tripp HJ, Kitner JB, Schwalbach MS, Dacey JWH, Wilhelm LJ, Giovannoni SJ. SAR11 marine bacteria require exogenous reduced sulphur for growth. Nature. 2008;452:741–4.
18. Tripp HJ, Schwalbach MS, Meyer MM, Kitner JB, Breaker RR, Giovannoni SJ. Unique glycine-activated riboswitch linked to glycine-serine auxotrophy in SAR11. Environ Microbiol. 2009;11:230–8.
19. Schwalbach MS, Tripp HJ, Steindler L, Smith DP, Giovannoni SJ. The presence of the glycolysis operon in SAR11 genomes is positively correlated with ocean productivity. Environ Microbiol. 2010;12:490–500.
20. Carini P, Campbell EO, Morré J, Sañudo-Wilhelmy SA, Cameron Thrash J, Bennett SE, et al. Discovery of a SAR11 growth requirement for thiamin’s pyrimidine precursor and its distribution in the Sargasso Sea. ISME J. 2014;8:1727–38.
21. Carlson CA, Morris R, Parsons R, Treusch AH, Giovannoni SJ, Vergin K. Seasonal dynamics of SAR11 populations in the euphotic and mesopelagic zones of the northwestern Sargasso Sea. ISME J. 2008;3:283–95.
22. Morris RM, Frazar CD, Carlson CA. Basin-scale patterns in the abundance of SAR11 subclades, marine Actinobacteria (OM1), members of the Roseobacter clade and OCS116 in the South Atlantic. Environ Microbiol. 2012;14:1133–44.
23. Vergin KL, Beszteri B, Monier A, Thrash JC, Temperton B, Treusch AH, et al. High-resolution SAR11 ecotype dynamics at the Bermuda Atlantic Time-series Study site by phylogenetic placement of pyrosequences. ISME J. 2013;7:1322–32. 24. Brown MV, Lauro FM, DeMaere MZ, Muir L, Wilkins D,
Tho-mas T, et al. Global biogeography of SAR11 marine bacteria. Mol Syst Biol. 2012;8:595.
25. Giovannoni SJ, Thrash JC, Temperton B. Implications of stream-lining theory for microbial ecology. ISME J. 2014;8:1553–65.
26. Morris JJ, Lenski RE, Zinser ER. The Black Queen Hypothesis: evolution of dependencies through adaptive gene loss. mBio. 2012;3:e00036–12.
27. Grant SR, Church MJ, Ferrón S, Laws E, Rappe M. Character-istics of a SAR11 strain grown in batch and continuous culture. bioRxiv 2018;1–63.
28. Carini P, Steindler L, Beszteri S, Giovannoni SJ. Nutrient requirements for growth of the extreme oligotroph“Candidatus Pelagibacter ubique” HTCC1062 on a defined medium. ISME J. 2013;7:592–602.
29. Braakman R, Follows MJ, Chisholm SW. Metabolic evolution and the self-organization of ecosystems. Proc Natl Acad Sci USA. 2017;114:E3091–100.
30. Karsenti E, Acinas SG, Bork P, Bowler C, de Vargas C, Raes J, et al. A holistic approach to marine eco-systems biology. PLoS Biol. 2011;9:e1001177.
31. Sunagawa S, Coelho LP, Chaffron S, Kultima JR, Labadie K, Salazar G, et al. Structure and function of the global ocean microbiome. Science. 2015;348:6237.
32. Pesant S, Not F, Picheral M, Kandels-Lewis S, Le Bescot N, Gorsky G, et al. Open science resources for the discovery and analysis of Tara Oceans data. Sci Data. 2015;2:150023. 33. Biller SJ, Berube PM, Dooley K, Williams M, Satinsky B, Hackl
T, et al. Marine microbial metagenomes sampled across space and time. Sci Data. 2018;5:180176.
34. Bushnell B, Rood J, Singer E. BBMerge – Accurate paired shotgun read merging via overlap. PLoS ONE. 2017;12: e0185056–15.
35. Mende DR, Letunic I, Huerta-Cepas J, Li SS, Forslund K, Sunagawa S, et al. proGenomes: a resource for consistent func-tional and taxonomic annotations of prokaryotic genomes. Nucleic Acids Res. 2017;45:D529–34.
36. Keeling PJ, Burki F, Wilcox HM, Allam B, Allen EE, Amaral-Zettler LA, et al. The Marine Microbial Eukaryote Transcriptome Sequencing Project (MMETSP): illuminating the functional diversity of eukaryotic life in the oceans through transcriptome sequencing. PLoS Biol. 2014;12:e1001889.
37. Tully BJ, Graham ED, Heidelberg JF. The reconstruction of 2,631 draft metagenome-assembled genomes from the global oceans. Sci Data. 2018;5:170203–8.
38. Tully BJ, Sachdeva R, Graham ED, Heidelberg JF. 290 metagenome-assembled genomes from the Mediterranean Sea: a resource for marine microbiology. PeerJ. 2017;5:e3558. 39. Haroon MF, Thompson LR, Parks DH, Hugenholtz P, Stingl U. A
catalogue of 136 microbial draft genomes from Red Sea meta-genomes. Sci Data. 2016;3:160050.
40. Hugerth LW, Larsson J, Alneberg J, Lindh MV, Legrand C, Pinhassi J, et al. Metagenome-assembled genomes uncover a global brackish microbiome. Genome Biol. 2015;16:279. 41. Parks DH, Rinke C, Chuvochina M, Chaumeil P-A, Woodcroft
BJ, Evans PN. Recovery of nearly 8,000 metagenome-assembled genomes substantially expands the tree of life. Nat Microbiol. 2017;2:1533–42.
42. Mukherjee S, Seshadri R, Varghese NJ, Eloe-Fadrosh EA, Meier-Kolthoff JP, G”ker M. et al. 1,003 reference genomes of bacterial and archaeal isolates expand coverage of the tree of life. Nat Biotechnol.2017;35:676–83.
43. Klemetsen T, Raknes IA, Fu J, Agafonov A, Balasundaram SV, Tartari G, et al. The MAR databases: development and imple-mentation of databases specific for marine metagenomics. Nucleic Acids Res. 2017;46:D692–9.
44. Menzel P, Ng KL, Krogh A. Fast and sensitive taxonomic classi-fication for metagenomics with Kaiju. Nat Commun. 2016;7:11257. 45. Nayfach S, Pollard KS. Average genome size estimation improves comparative metagenomics and sheds light on the functional ecology of the human microbiome. Genome Biol. 2015;16:59–18.
46. Parks DH, Chuvochina M, Waite DW, Rinke C, Skarshewski A, Chaumeil P-A, et al. A standardized bacterial taxonomy based on genome phylogeny substantially revises the tree of life. Nature Publishing Group 2018;1–14.
47. Stamatakis A. RAxML-VI-HPC: maximum likelihood-based phylogenetic analyses with thousands of taxa and mixed mod-els. Bioinformatics. 2006;22:2688–90.
48. Biller SJ, Berube PM, Lindell D, Chisholm SW. Prochlorococcus: the structure and function of collective diversity. Nat Rev Micro. 2014;13:13–27.
49. Moore LR, Coe A, Zinser ER, Saito MA, Sullivan MB, Lindell D, et al. Culturing the marine cyanobacterium Prochlorococcus. Limnol Oceanogr Methods. 2007;5:353–62.
50. Rappé MS, Connon SA, Vergin KL, Giovannoni SJ. Cultivation of the ubiquitous SAR11 marine bacterioplankton clade. Nature. 2002;418:630–3.
51. Connon SA, Giovannoni SJ. High-throughput methods for cul-turing microorganisms in very-low-nutrient media yield diverse new marine isolates. Appl Environ Microbiol. 2002;68:3878–85. 52. Tripp HJ. The unique metabolism of SAR11 aquatic bacteria. J
Microbiol. 2013;51:147–53.
53. Giovannoni SJ, Vergin KL. Seasonality in ocean microbial com-munities. Science. 2012;335:671–6.
54. Benitez-Nelson CR, Bidigare RR, Dickey TD, Landry MR, Leonard CL, Brown SL, et al. Mesoscale eddies drive increased silica export in the subtropical Pacific Ocean. Science. 2007;316:1017–21.
55. Stingl U, Tripp HJ, Giovannoni SJ. Improvements of high-throughput culturing yielded novel SAR11 strains and other abundant marine bacteria from the Oregon coast and the Bermuda Atlantic Time Series study site. ISME J. 2007; 1:361–71.
56. Barofsky A, Vidoudez C, Pohnert G. Metabolic profiling reveals growth stage variability in diatom exudates. Limnol Oceanogr Methods. 2009;7:382–90.
57. Longnecker K, Kido Soule MC, Kujawinski EB. Dissolved organic matter produced by Thalassiosira pseudonana. Mar Chem. 2015;168:114–23.
58. Lee C. Characterizing Growth Promoters and Inhibitors of SAR11 Pelagibacter sp. HTCC7211. Honors [thesis]. Corvallis (OR): Oregon State University; 2013.
59. Lauro FM, McDougald D, Thomas T, Williams TJ, Egan S, Rice S, et al. The genomic basis of trophic strategy in marine bacteria. Proc Natl Acad Sci USA. 2009;106:15527–33.
60. Vergin KL, Done B, Carlson CA, Giovannoni SJ. Spatiotemporal distributions of rare bacterioplankton populations indicate adap-tive strategies in the oligotrophic ocean. Aquat Microb Ecol. 2013;71:1–13.
61. Sher D, Thompson JW, Kashtan N, Croal L, Chisholm SW. Response of Prochlorococcus ecotypes to co-culture with diverse marine bacteria. ISME J. 2011;5:1125–32.
62. Coe A, Ghizzoni J, LeGault K, Biller S, Roggensack SE, Chish-olm SW. Survival of Prochlorococcus in extended darkness. Limnol Oceanogr. 2016;61:1375–88.
63. Morris JJ, Kirkegaard R, Szul MJ, Johnson ZI, Zinser ER. Facilitation of robust frowth of Prochlorococcus colonies and dilute liquid cultures by “helper” heterotrophic bacteria. Appl Environ Microbiol. 2008;74:4530–4.
64. Morris JJ, Johnson ZI, Szul MJ, Keller M, Zinser ER. Dependence of the cyanobacterium Prochlorococcus on hydrogen peroxide scavenging. PLoS ONE. 2011;6:e16805.
65. Biller SJ, Coe A, Chisholm SW. Torn apart and reunited: impact of a heterotroph on the transcriptome of Prochlorococcus. ISME J. 2016;10:2831–43.
66. Aharonovich D, Sher D. Transcriptional response of Pro-chlorococcus to co-culture with a marine Alteromonas: differences between strains and the involvement of putative infochemicals. ISME J. 2016;10:2892–906.
67. Grote J, Thrash JC, Huggett MJ, Landry ZC, Carini P, Giovannoni SJ, et al. Streamlining and core genome conservation among highly divergent members of the SAR11 clade. mBio. 2012;3: e00252–12.
68. Sun J, Steindler L, Thrash JC, Halsey KH, Smith DP, Carter AE, et al. One carbon metabolism in SAR11 pelagic marine bacteria. PLoS ONE. 2011;6:e23973.
69. Scanlan DJ, Ostrowski M, Mazard S, Dufresne A, Garczarek L, Hess WR, et al. Ecological genomics of marine picocyanobacteria. Microbiol Mol Biol Rev. 2009;73:249–99.
70. Klahn S, Steglich C, Hess WR, Hagemann M. Glucosylglycerate: a secondary compatible solute common to marine cyanobacteria from nitrogen-poor environments. Environ Microbiol. 2010; 12:83–94.
71. Sun J, Todd JD, Thrash JC, Qian Y, Qian MC, Temperton B, et al. The abundant marine bacterium Pelagibacter simultaneously catabolizes dimethylsulfoniopropionate to the gases dimethyl sulfide and methanethiol. Nature. Microbiology. 2016; 1:16065.
72. Vila-Costa M, Simo R, Harada H, Gasol JM, Slezak D, Kiene RP. Dimethylsulfoniopropionate uptake by marine phytoplankton. Science. 2006;314:652–4.
73. Kiene RP, Hoffmann Williams LP, Walker JE. Seawater micro-organisms have a high affinity glycine betaine uptake system which also recognizes dimethylsulfoniopropionate. Aquat Microb Ecol. 1998;15:39–51.
74. Kempf B, Bremer E. Uptake and synthesis of compatible solutes as microbial stress responses to high-osmolality environments. Arch Microbiol. 1998;170:319–30.
75. Chisholm SW, Frankel SL, Goericke R, Olson RJ, Palenik B, Waterbury JB, et al. Prochlorococcus marinus nov. gen. nov. sp.: an oxyphototrophic marine prokaryote containing divinyl chlor-ophyll a and b. Arch Microbiol. 1992;157:297–300.
76. Moore LR, Rocap G, Chisholm SW. Physiology and molecular phylogeny of coexisting Prochlorococcus ecotypes. Nature. 1998;393:464–7.
77. Rocap G. Genetic diversity and ecotypic differentiation in the marine cyanobacteria Prochlorococcus and Synechococcus. PhD [dissertation]. Cambridge (MA): Massachusetts Institute of Technology; 2000.
78. Biller SJ, Berube PM, Berta-Thompson JW, Kelly L, Roggensack SE, Awad L, et al. Genomes of diverse isolates of the marine cyanobacterium Prochlorococcus. Sci Data. 2014; 1:140034–11.
79. Cubillos-Ruiz A, Berta-Thompson JW, Becker JW, van der Donk WA, Chisholm SW. Evolutionary radiation of lanthipep-tides in marine cyanobacteria. Proc Natl Acad Sci U S A. 2017;114:E5424–33.
80. Stingl U, Tripp HJ, Giovannoni SJ. Improvements of high-throughput culturing yielded novel SAR11 strains and other abundant marine bacteria from the Oregon coast and the Bermuda Atlantic Time Series study site. ISME J. 2007;1:361–71.