Clearance of Airway Liquid
Surface Tension
from the Lung Due to
Gradients
by
Barbara G. Hamer
B.S., Northwestern University (1993)
Submitted to the Department of Mechanical Engineering
in partial fulfillment of the requirements for the degree of
Master of Science in Mechanical Engineering
at the
MASSACHUSE'TS INSITUTE OF TECHNOLOGY
September 1995
© Massachusetts Institute of Technology 1995. All rights reserved.
Signature of Author
-
--Department of Mkhanical Engineering
September, 1995 ,- t.R
Certified bv
7
Accepted by /Chairman, Departmental Committee
;.;'AS-ACHfJSETTS INST S'ITUTE
OF TECHNOLOGY
Roger D. Kamm
Professor
Thesis Supervisor
Ain A. Sonin
on Graduate Students
- j- , , (~Clearance of Airway Liquid from the Lung Due to Surface
Tension Gradients
by
Barbara G. Hamer
Submitted to the Department of Mechanical Engineering on September 15, 1995, in partial fulfillment of the
requirements for the degree of Master of Science in Mechanical Engineering
Abstract
In the healthy human lung there exists a naturally occurring surface tension gradient. Measurements indicate that surface tension ranges from about 30 dynes/cm in the trachea, to between 20 dynes/cm and 0 dynes/cm in the most peripheral regions of the lung. One potential cause for this surface tension gradient is the difference in the amount of surface strain experienced during breathing; the central airways are much less compliant than the peripheral airways and alveoli. The surface tension gradient arises due to the tendency of pulmonary surfactant to lower the mean surface tension more in regions undergoing cyclic expansion and contraction. The presence of this gradient in surface tension should generate a flow from regions of low surface tension to regions of higher surface tension, i.e., from the alveolar region toward the conducting airways and trachea. This flow would help in the clearance of liquid and particulate matter from the alveoli and peripheral airways. This thesis describes an experimental model designed to measure bulk liquid flows due this mechanism. Results from the experiments were compared to those from a numerical model
developed by Espinosa and Kamm (1995.)
The experimental model consisted of a flat, elastic latex sheet with a linear variation in thickness coated with a thin liquid layer containing surfactant, glycerol and saline. According to the numerical model, cyclic expansion and relaxation of the elastic sheet should have produced surface tension gradients in the thin liquid layer, generating a flow from regions of high strain ("alveolar region") to regions of low strain ("trachea.") Using the parameters of the experiments, the model predicted that the film at the low strain end of the sheet would thicken by 9 - 13% compared to the film at the high strain end after 10 cycles.
Liquid layer thickness was measured using a fluorescent dye mixed into the surfactant solution. Liquid layer velocities were also measured by tracking the movement of fluorescent microspheres placed in the surfactant solution. In all experiments, flows were considerably smaller than those predicted by the model and were primarily due to gravity. It was unclear why the predicted flows were not observed in the experiments, although it is believed that the effects of glycerol on the kinetic properties of the surfactant and the possible binding effects of the latex on the surfactant were factors. Further experiments are necessary to understand better the role of surface tension gradients in liquid clearance from the lung and how these surface tension gradients are produced.
Thesis Supervisor: Roger D. Kamm Title: Professor
Acknowledgments
Thanks to Professor Kamnm for his patience and his help with this project. Thanks to all
the people who were generous with their time and use of their equipment: to Dr. Ingenito for supplying the surfactant and the surfactometer, to his student Lena for helping me out of the computer jams, to Dr. Lehr for the use of his camera (and supplying late night
chocolate) and to Nina for helping me learn how to use it, and to Dr. Lee for the use of his computer. Thanks also goes to Dick Fenner, who helped get me started.
The Fluid Mechanics Lab was a great place to work, thanks to all the wonderful people
there. Mil gracias to Frank Espinosa for running all those simulations for me, even at short
notice. Thanks to Jim McGrath for being a wonderful "cubicle-mate" and helping me through the qualifiers. I also could not have made it through the quals without my study partners, Arthur Sit and Amit "you woulda' passed in May" Dadhwal. Thanks to Naomi Chesler for her advice and friendship. Thanks to Mariano "the answer man" Gurfinkel for computer help. Thanks to James Shin for the "therapy" and interesting political conversations. Thanks also goes to Edwin "butt" Ozawa, Serhat "stinky tea" Yesilyurt, John "Chicago" Otto, "Big" John Dzenitis, Sanjay "hockey" Patel, Kathy "Mom" McKenzie, Hugo "Apple" Ayala, Gregg "Saab" Duthaler, Matteo "the Italian Stallion" Pedercini, Stefano "NYTimes" Schiaffino, "California" Dave Danitz, and Constantine
"Dino" Hrousis for making the work hours fun and interesting.
Thanks to my parents for their support and long phone conversations.
Table of Contents
1.
Introduction...
1.1 Background... 1.2 Problem Statement...2.
Literature
Review ...
2.1 Transient Studies...2.2 Steady State Studies...
2.3 Experimental Studies... 2.3.1 Earliest Investigators...
2.3.2 "Film Elasticity" Studies...
2.3.3 Particle Studies...
3.
Model
Description...
4.
Methods ...
4.1 Parameter Determination... 4.1.1 Surfactant: CD & cA ... 4.1.2 Liquid layer parameters and sheet design: v & ...
4.2 Apparatus... 4.3 Experimental Protocol...
5.
Results ...
5.1 Parameter Determination... 5.1.1 Surfactant: xD & rA ... 5.1.2 Liquid layer parameters and sheet design: v & ...
5.2 Expected results... 5.3 Experimental results...
5.3.1 Calibration experiments... 5.3.2 Gravity experiments...
5.3.3 Liquid pumping experiments...
5.3.4 Particle experiments...
6.
Discussion
6.1 6.2
and Future Research...
Discussion...
Future Research... 9 9 14 14 15 17 17 17 19 2127
27 27 28 30 3335
35 35 44 45 52 52 53 55 5861
61 67List of Figures
1-1 Qualitative description of a surfactant monolayer on a thin liquid film ... 10
1-2 Proposed liquid clearance mechanism ... 12
2-1 Ideal surface tension-area loop for "stop and go" transport. Adapted from G ebhardt et al. (1984.) ... 18
3-1 Net dimensionless volume pumped per unit width toward rigid end for various dimensionless parameter values. From Espinosa et al. (1995.) ... 24
3-2 Diagram of flat sheet model with liquid pumping due to surface tension gradients... 26
4-1 Design of the rubber sheet of variable strain . ... 29
4-2 Schematic of the apparatus... 31
4-3 Dimensions of the calibration chamber ... 32
4-4 Locations in liquid layer image where intensity profiles were taken . ... 33
5-la Steady-state surface tension-area loop forCLSE at 1 mg/ml concentration in normal saline and 5 mM CaC12. Standard bubble size, frequency = 20/min, t = min, T = 281 0 C ... 36
5-lb Surface tension-area loop for 0.01 mg/ml concentration CLSE in normal saline and 5 mM CaC12. Standard bubble size, frequency = 20/min, t = 1.33 hrs, T = 28C ... 36
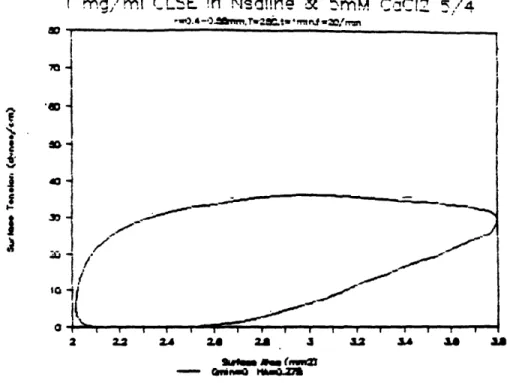
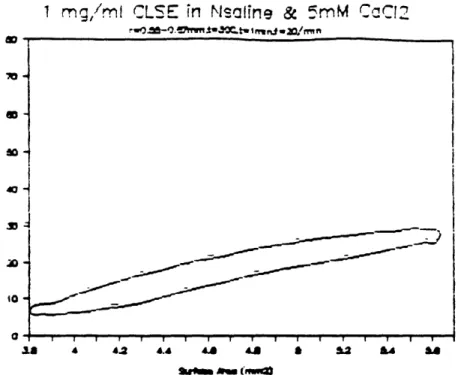
5-lc Surface tension-area loop for 1 mg/ml concentration CLSE in normal saline and 5 mM CaC12. Non-standard bubble size (r = 0.55 mm to 0.69 mm), frequency = 20/min, t = 1 min, T = 30°C ... 37
5-2a Steady-state model surface tension-area loop. Standard concentration (lmg/nml CLSE) and standard bubble size. Frequency = 20/min, klC = 25/min, k2 = 4/min ... 39
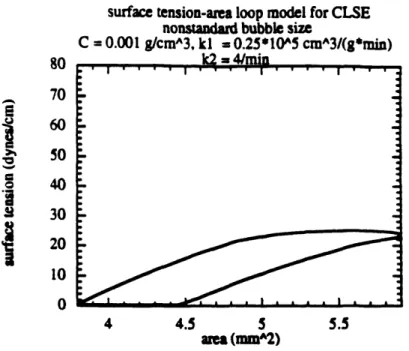
5-2b Model steady-state surface tension-area loop for non-standard concentration (0.01 mg/ml) CLSE. frequency = 20/min ... 39 5-2c Model steady-state surface tension-area loop for non-standard bubble size
(r = 0.55 to 0.69 mm). Standard concentration of 1 mg/ml, frequency =
5-3a Steady-state surface tension-area loop for CLSE at 1 mg/ml concentration in
a solution of normal saline, 5mM CaC12 and 67% by volume glycerol.
Standard bubble size, frequency = 20/min, t = 5 min, T = 370C ... 42
5-3b Surface tension-area loop for 1 mg/ml CLSE in normal saline/ 5mM CaC12/ 67% by volume glycerol solution. Standard bubble size, frequency = 20/min, t = 3 min, T = 280C ... 42
5-3c Surface tension-area loop for experiment shown in figure 5-3b after 22 min ... 43
5-4 Model surface tension-area loop for 1 mg/ml CLSE in glycerol/saline solution. Frequency = 20/min, kIlC = 4/min, k2 = 4/min ... 44
5-Sa Unfitted strain profile of rubber sheet ... 46
5-5b Fitted strain profile of rubber sheet... 46
5-5c Linearly fitted strain profile of rubber sheet ... 46
5-6 Net dimensionless volume pumped per unit width per cycle toward rigid end for various dimensionless parameter values and where the predicted experimental results (*) are located. Note that the ratio of adsorption to desorption timescales (xD/¶A) is inverted in the plot to SrALD. From Espinosa (submitted 1995) ... 47
5-7 Expected liquid layer profile according to numerical model for J, = 0.42 and CD/,CA = 6.25 ... 48
5-8 Surface tension-area loops from model calculations for fig. 5-7 at various values of ... 48
5-9 Expected liquid layer profile according to numerical model for %O/; = 0.42 and rD/EA = 1.0. Change in h/ho after 10 breaths is 9% ... 50
5-10 Surface tension-area loops from model calculations for fig. 5-9 at various values of ... 50
5-11 Expected liquid layer profile according to numerical model for V / = 0.77 and D/CA = 1.0. Change in h/ho after 10 breaths is 13% ... 51
5-12 Surface tension-area loops from model calculations for fig. 5-11 at various values of ... 51
5-13 Calibration chamber intensity profile. 8-21-95 expts ... 52
5-14 Results from 7-31-95 gravity experiments. Liquid tended to flow from center of sheet toward edges, and from the low strain ( = 0) to the high strain region ( = 1) of the sheet... 54
5-15 Results from liquid pumping experiments, 7-31-95. (Co/tv = 0.42,
predicted change in h/ho: 9%) Liquid tended to flow in the same directions as in the gravity experiments (fig. 5-14.) There was no clear indication of
liquid pumping from high strain to low strain regions ... 56 5-16 Results from liquid pumping experiments, 8-21-95. (To/rv = 0.77,
predicted change in h/ho: 13%.) There was no clear indication of liquid
pumping from high strain to low strain regions ... 57 5-17 Results from 4-9-95 liquid pumping experiments. Parameters were the
same as 7-31-95 experiments except e = 0.05. Liquid clearly flowed from regions of low strain to regions of high strain due to tilting of the rubber sheet. Flow velocities were an order of magnitude lower than those
predicted and in the opposite direction ... 59
6-1 Diagram of rubber sheet lined with a liquid layer and tilted at angle O to the
horizontal... 62
6-2a Surface tension-area loop of CLSE before spreading on latex sheet ... 64 6-2b Surface tension-area loop for CLSE after resting on latex for 5 minutes.
Low hysteresis and higher minimum surface tension suggest that the
surfactant was binding to the latex surface ... 64 6-2c Surface tension-area loop for CLSE after resting on latex surface for 10
minutes. Results indicate unusual surfactant behavior, but large hysteresis
area and low minimum surface tension indicate that the surfactant did not
List of Tables
5.1 Model assumption verification. In Pe, Ds = 3*10-5 (Jensen et al, 1993.) ...45 5.2 Dimensionless parameters to be used in the numerical simulation ... 45 5.3 Net volume pumped per unit width (V'net) and average liquid layer
velocities (uavg) at the end of each cycle at 4 = 0.5 for the simulations in
figures 5-7, 5-9 and 5-11 ... 49 5.4 Results from particle experiments 8-21-95. Last row contains the mean
Chapter 1
Introduction
1.1 Background
The human lung is a complex organ optimally designed for gas exchange with a large surface area to volume ratio. The surface area of the lungs is between 50-100 m2, yet the
volume of the lungs is only about 5-8 liters (West, 1990.) It is imperative that this large and delicate surface is kept free of debris and excess liquid so that gas exchange may take place. The lungs are equipped with several clearance mechanisms which allow for removal of particulates and excess liquid.
The airways and alveoli are lined with a thin liquid layer around 0-10 gm thick which protects the epithelium. Lung liquid balance depends on the rate liquid is filtrated into the lung from the microcirculation and the rate at which it is cleared from the lung. In the healthy lung, most of the excess liquid moves across the epithelium for subsequent removal by the lymphatic system (Drake and Gabel, 1995.) When the lung is edematous, then other clearance pathways are activated such as microvascular reabsorption, pleural, and airway clearance. The review by Drake and Gabel (1995) provides more detailed
information on pulmonary edema fluid clearance pathways
The most well known clearance mechanism is the muco-ciliary escalator. The upper airways of the lung are lined with epithelial cells from which project tiny finger-like extensions (the cilia). The cilia beat rhythmically toward the mouth, propelling liquid and debris out of the lung to be swallowed. In the healthy human adult lung about 10 ml of mucus may be passed out of the top of the trachea per day (Sleigh, 1991.) For a 2 cm
diameter trachea lined with a 10 gm layer of mucus, this volume flow rate corresponds to a
mean liquid velocity of about 200 gm/sec. Excess mucus produced in response to a respiratory infection may be cleared from the upper respiratory tract even more rapidly by coughing.
Inhaled particles must be removed from the lungs in order to prevent damage to the
delicate tissue. Larger particles settle first in the ciliated upper airways and are immediately
swept away by the cilia. Not all inhaled particles settle in ciliated regions of the lung; up to
50% of inhaled particles 2-5 gm in diameter settle in the terminal airways and alveolar zone. Most alveolar clearance is absorptive. Particles may imbed in the tissue and be degraded over the course of months, move across the epithelium and be cleared by the lymphatics, or be consumed by macrophages. The particle-laden macrophages may migrate through the alveolar wall into the interstitial space and lymphatics, or may be cleared by mucociliary transport directly (Clarke and Pavia, 1991.) However, it is uncertain how the macrophages eventually reach the ciliated regions. The marcophages may actively "crawr'l" to the ciliated regions, however this method of transport is too slow to account for some of the more rapid particle clearance rates observed (Green, 1973.) Green suggested that macrophages are transported passively with the flows produced by surface tension gradients.
The agent responsible for these surface tension gradients is pulmonary surfactant. Surfactants, (for surface active agents,) are molecules that reside at liquid-air interfaces which act to reduce the interfacial tension. Surfactants are bipolar molecules, with a large uncharged hydrophobic tail and a smaller charged hydrophilic head. This structure causes surfactant molecules in the interface to be in a lower energy state than those in the bulk (See figure 1-1.) Surfactants are widely used in industrial processes and are found in such common items as detergents and soaps.
Pulmonary surfactant is produced in the alveolar zone by type II cells and is mainly composed of phospholipid, dipalmitoyl phosphatidylcholine (DPPC.) DPPC alone does not possess the desired surface activity, so surfactant apoproteins are also present to improve its surface tension behavior (Hall et al., 1992.) Pulmonary surfactant has a
air
urfactant monolayerphobic tail
•
_,,.yropn77c tail\ 2 it it it., ~> hydrophilic head
-0 0U
0
0
~
0
~
thin
liquid
layer
minimum equilibrium surface tension around 22 dynes/cm; to decrease the surface tension further requires a physical compression of the interface (reduction of surface area) to increase the surface concentration. Pulmonary surfactant, unlike many other surfactants, is
remarkably stable in this compressed state, largely due to the apoproteins present. Alveolar
surface tensions may be less than 1 dyne/cm and may remain in a highly compressed state for over an hour (Schurch, 1982.) It is this state of low surface tension that makes lungs compliant, mechanically stable, and respiration effortless (Goerke and Clements, 1986). The lack of surfactant in prematurely born infants results in respiratory distress syndrome (RDS), which is characterized by a severe decrease in lung compliance, with atelectasis (collapse of alveoli) and edema. The recent development of surfactant replacement therapy has greatly reduced mortality of these neonates (Horbar et al., 1993.)
In the unhealthy neonate with RDS, a deficiency of surfactant produces a high interfacial tension in the lung. RDS is treated by instilling a bolus of exogenous surfactant into the trachea. Between the surfactant-rich bolus and the surfactant-deficient airways there exists a surface tension gradient. Surface tension gradients produce spreading of thin liquid films, or Marangoni convection, which pulls the liquid bolus into the airways, lowering the surface tension in the lung and allowing the infant to breathe. There are also surface tension gradients naturally present in the healthy lung. In the trachea and the upper airways, surface tensions are around 30 dynes/cm, whereas in the alveoli the surfactant is compressed to produce surface tensions around 0-10 dynes/cm (Schurch, 1976.) It is believed that these surface tension gradients produce a net flow of liquid and insoluble particles from the alveolar region to the trachea; these flows may be especially important in
the nonciliated regions such as the alveoli and terminal bronchioles.
1.2 Problem Statement
The surface tension gradients naturally present in the lung may be produced by regional differences in production and degradation of surfactant, regions of variable strain, or a combination of both mechanisms. Pulmonary surfactant is produced only in the alveoli by type-II epithelial cells; there are no surfactant-producing cells in other regions of the lung. This distribution of surfactant production alone could create a surface tension gradient, but not the gradient measured in the lung. If varying surfactant production were the only method for producing a surface tension gradient, then the alveoli would be at the minimum equilibrium surface tension of around 22 dynes/cm and the tracheal surface tension would range from 22 dynes/cm to that of water (70 dynes/cm). Yet alveolar surface tension has been measured to be as low as 1 dyne/cm (Schurch, 1982) and tracheal surface tension is
per airways
rea changes with breathing L production
cmwit
b
g
with breathing
Figure 1-2: Proposed liquid clearance mechanism.
measured to be around 30 dynes/cm (Gehr et al., 1990.) Clearly, distributed surfactant production alone does not account for the surface tension gradient in the lung.
Another explanation for the surface tension gradient is the existence of regions of variable strain throughout the lung. The trachea and upper airways are ringed with cartilage and therefore are relatively stiff. Due to their stiffness, the trachea and upper airways do not expand and contract much with breathing. The alveoli and the peripheral airways, on the other hand, are thin-walled and compliant; their surface area changes roughly with lung volume to the two-thirds power during breathing (Bachofen et al., 1987.) This repeated expansion and contraction of the surfactant-rich liquid layer lining the alveoli and peripheral airways enriches the interfacial concentration of surfactant due to rapid adsorption to the interface on expansion and reduced desorption during compression. Upon exhalation, alveolar surface tension drops to its minimum value of almost 0 dynes/cm, whereas the stiff trachea remains at a relatively high surface tension of around 30 dynes/cm. Inhalation increases the surface tension in the periphery, while the trachea remains near 30 dynes/cm; although this would seem to cause flow toward the periphery, it is unclear whether, even in this circumstance, peripheral surface tension exceeds that of the more central airways. This surface tension gradient would result in a tendency for liquid clearance from the alveoli to the trachea. (Figure 1-2.)
Several questions must be answered to understand liquid layer pumping by surface tension gradients. How much liquid is cleared from the airways by surface tension
gradients per day, and how does that flow rate compare with those of other liquid clearance pathways such as mucociliary pumping and transepithelial flux? How much strain is required to produce net liquid pumping toward the trachea, and is this strain physiologic? What are the effects of other parameters such as liquid layer viscosity and surfactant kinetics on liquid clearance from the lung? Several of these questions have been solved numerically by Espinosa & Kamm (submitted 1995); this study may either confirm or counter the results from the numerical model. The focus of this study is to experimentally
examine the potential for liquid layer clearance due to surface tension gradients produced by
Chapter 2
Literature Review
There have generally been two approaches in studies of surfactant spreading and liquid layer pumping. One approach is to examine the transient spreading of surfactant as it is introduced on a clean thin film. The other approach is to look at steady state liquid, particle, and surfactant clearance from the lung. A review of the literature on both transient and steady state approaches is given below, with emphasis on the steady state problem.
2.1 Transient Studies
Studies of transient spreading of surfactant on a thin viscous film have been conducted to better understand surfactant replacement therapy. Of particular importance are estimates of spreading rates of either a planar front of surfactant or of an aerosol droplet spreading radially on a planar surface. Grotberg and colleagues have done several studies, both computational and experimental, on surfactant spreading. Gaver and Grotberg found numerically (1990) and experimentally (1992) that a droplet of surfactant spreads radially on a planar surface at a rate proportional to tM
4, and Jensen and Grotberg (1992) demonstrated numerically that a front of surfactant (a 2-D drop) spreads on a planar surface at a rate of t'3. For a further review and exhaustive list of references on this topic, I refer the reader to the article by Grotberg (1994).
Espinosa et al. (1993) studied spreading of exogenous surfactant along a cylindrical airway rather than on a planar surface. Their model showed that surfactant spread at a rate
1/3
proportional to t, with capillarity having little effect on the rate of spreading; this was consistent with the results of Jensen and Grotberg (1992). Espinosa et al. also estimated the time for a bolus of surfactant to spread from the trachea to the periphery of a neonate to be around 12 seconds when the effect of area expansion along the airway tree is neglected and the liquid layer is assumed to have the viscosity of water and to be 10 pm thick. In a similar study, Jensen et al. (1993) estimated the spreading time of a bolus of surfactant in a
neonate to be much larger, around 15 minutes. However, they estimated the airway liquid layer viscosity to be 10 times that of water and only 1 m thick; their model also included
the effect of area expansion along the airway tree.
2.2 Steady State Studies
To examine the role of surface tension gradients in the steady elimination of liquid from the
lung, Davis et al. (1974) studied steady motions driven by surface tension gradients in a tube lining layer. Surface tension was fixed at both ends of the tube as well as the film thickness at the low surface tension end. A linear equation of state between surface tension and surfactant interfacial concentration was assumed. Their solutions showed that the liquid lining thins in the direction of flow, toward the high surface tension end of the tube, and that surface diffusion of surfactant is negligible for the situation found in the lung. The flow rate of liquid from an alveolar duct was specified in terms of RQ, the ratio of 'surface tension flux', -q, to the volume flow rate of liquid, Q. (The 'surface tension flux' is equal in magnitude but opposite in sign to the surface flux of surfactant, q.) Davis et al. stated that RQ may be simply identified from a still photograph of the interfacial shape; for each interfacial shape, there is a unique value of R. However, they did not conduct the experiments necessary to find RQ, nor was the effect of breathing considered.
To demonstrate the potential for surface tension gradient-driven flows, Espinosa et al. (1993) also used their surfactant spreading model to estimate the volume flow rate of liquid produced by a steady surface tension gradient. Using the boundary condition that the shear stress at the air-liquid interface is approximately equal to the surface tension gradient, or:
-7
= A
~~pt ~~~(2.1)&
_#
yh
--where a is the surface tension, z is the axial coordinate along the airway and g is the liquid viscosity, then one can estimate the surface velocity u3from the relation
U, - h (2.2)
Z A
where h is the liquid layer thickness and Z is the airway tree length. If B, is taken to be the viscosity of water, Xu-mian- =30 dynes/cm, h = 0.0005 cm and Z = 10 cm (for the adult lung) then u, 6cm/min, or a particle on the surface could travel the entire length of the airway tree in about 150 sec. With the assumption that the velocity profile between the
and the total airway circumference in the 14th generation of the Weibel model of the adult human lung (Weibel, 1963), the total volume flow rate of liquid toward the trachea would be around 350 ml/hr, an impossible quantity. This, of course, is a very rough estimate given the levels of uncertainty in h, g and aa/az, and the neglect of factors such as mucus, cilia and transepithelial flux of liquid, but it does indicate that steady state gradients in
surface tension may be an important factor in liquid and particle clearance from the lung. In
addition, as in Davis et al., these estimates ignore the possible influences of breathing and
the branching structure of the airway tree on liquid transport
In the first study to consider the influence of breathing, Podogorski and Gradon (1990) developed a simplified model of hydrodynamical clearance in the alveoli. In their model, a surface tension gradient arose as a consequence of a difference in surface energies between inspiration and expiration due to the presence of surfactant in the liquid layer, and an unequal distribution of surfactant production. They found that the properties of the lung surfactant system, (such as surface activity of surfactant and viscosity of the hypophase,) and the depth and frequency of respiration play the most important role in the net surface displacement. High surface activity due to high surface concentrations of surfactant, low viscosity of the hypophase and deep but frequent respiration with short inhalation and prolonged exhalation produce the largest net displacement of impurities from their alveolar model. From their computations, they found impurities may be displaced from the alveoli at a velocity of about 1 m/min. Their model assumed, however, that the airways remained at constant length while their diameter changed in proportion to the cube root of the lung volume. They also neglected the interfacial geometry where the alveolus and airway duct were joined. Because of these geometrical limitations, their results may be regarded only as approximate.
Model studies have indicated that surface tension gradients may play a significant role in liquid and particle clearance from the lung. Exact informnation about the parameters in the lung such as airway liquid layer thickness and viscosity, and the complicated branching lung geometry make it difficult to determine exactly how much liquid may be cleared due to surface tension gradients. Estimates of surface velocities, for example, range widely from as high as 6 cm/min to as low as 1 Wm/min. In vivo experiments may be necessary to determine how significant these flows are in the lung. Also, several questions remain such as: how are surface tension gradients produced in the lung, how do regions of variable strain with breathing play a role in liquid clearance, and is this strain
2.3 Experimental Studies
2.3.1 Earliest Investigators
Mendenhall (1972) was the first to suggest that surfactant could act as an agent to remove substances from the alveoli to the ciliated part of the lung. He conducted simple experiments where lung alveolar surfactant (LAS) was placed in one half of a Langmuir trough, with a clean interface on the other half, the two sides separated by a gate. He then lifted the gate and measured how quickly the sides reached a common dynamic surface tension. Because the equilibration times were so rapid, Mendenhall concluded that differentials in surface tension in the alveolar region would tend to be small, and since alveoli are "surface cul-de-sacs," a net movement of LAS away from the alveoli would serve as a mechanical cleansing agent to move particulates (including moveable cells such
as macrophages) from the alveoli to the ciliated regions.
In his review article, Green (1973) examined the various pathways of fluid, particle and cellular transport in the lung. He concluded that transport of particle-laden macrophages was not caused by active ameboid activity but by passive fluid movement. One type of fluid transport is via the lymphatic drainage system, the other is "excretion of
surfactant as fluid" from the alveoli to the mucociliary stream.
Faridy (1976) studied the effect of ventilation on movement of surfactant in airways. In his experiments he excised rat lungs and either held them at constant inflation with air, or ventilated them with air, nitrogen or oxygen. After three hours, he then separated the extrapulmonary airways (i.e., trachea and bronchi) from the lungs and flushed them with saline. Faridy then measured surface tension and lecithin content of the saline wash. He found that the surface activity and lecithin content of the wash did not differ from the controls if the lungs were held at constant volume, but surface activity and lecithin content increased in the ventilated lungs. The increase was directly related to the duration of ventilation and to the tidal volume. The mechanism which he assumed from these results was that deflation to low lung volumes reduces the alveolar surface area, thereby lowering the surface tension and, because of the tendency for lung surfactant to spread, would result in surfactant moving to regions of higher surface tension such as the airways.
2.3.2 "Film Elasticity" Studies
Rensch et al. (1983) proposed a "stop and go" particle transport model for alveolar clearance based on their experiments. In a Langmuir trough they placed small solid
particles on a solution of sodium dodecyl sulfate (SDS), a soluble surfactant which they believed to behave similarly to pulmonary surfactant. They then moved the barrier back and forth in the trough with a 30% change in area upon compression. Over several cycles, Rensch et al. observed a net movement of the particles away from the barrier; this effect could not be demonstrated in a trough filled only with water. They concluded that the dynamic asymmerty of the elasticity of the surface film is the main cause of the unidirectional transport
Further details on film elasticity were presented in a later work by Gebhardt et al. (1984.) The gradient in surface tension, o, was substituted for the gradient in surface density (or surface concentration,) F, and film elasticity, e, using the relation
or dlnF
d=-e nr.
(2.3)
dX ~ dx
They determined that the necessary conditions for transport are: that there must be an exchange of surfactant with the hypophase, that the film must be able to move on the hypophase, and that the surface elasticity must be different for expansion and compression (i.e., there must be hysteresis in the surface tension-area diagram.) Ideal surfactant behavior would be characterized by a triangular-shaped surface tension-area loop as shown in figure 2-1. The film should break after initial expansion at nearly infinite elasticity (jump in surface tension). Further expansion at low elasticity would cause the surfactant to adsorb from the hypophase, and then compression at nearly constant elasticity would return the surfactant film to its compressed state. Lung lavage fluid behaves somewhat in this ideal way, but the sodium dodecyl sulfate which they used previously (Rensch et al., 1983) had a relatively poor surface tension-area loop with little hysteresis and with a more oblong rather than triangular shape. Gebhardt et al. concluded that lung surfactant would produce
surface tenron
area
Figure 2-1: Ideal surface tension-area loop for "stop and go" transport. Adapted from Gebhardt et al. (1984.)
even more unidirectional particle transport than SDS in the trough experiments; however, they did not conduct these experiments with pulmonary surfactant.
Lachmann (1985) did similar experiments to those of Rensch et al. using various detergents and synthetic and natural phospholipids in a Langmuir trough. He did not find any correlation between the shape or hysteresis of the surface tension-area loops and net particle transport as did Rensch et al. and Gebhardt et al. In fact, the surfactant with the largest hysteresis area produced negative particle transport (i.e., transport toward the barrier,) while the detergent with virtually no hysteresis produced the most positive particle transport. However, Lachmann concluded that his findings demonstrated even more than those of Rensch et al. that surfactant may play a role in lung clearance. In his experiments, Lachmann used a 50% area excursion in the trough and Rensch et al. used a 30% excursion; a normal breath, however, involves only about a 15% change in lung surface area. This relatively low change in area would produce negligible hysteresis and surface tension change in the lung, which would mimic the behavior of the detergent in the trough. Therefore, Lachmann concluded, surfactant activity during normal tidal breathing plays the
most significant role in particle clearance from the lung.
2.3.3 Particle Studies
Further evidence for lung clearance due to surface tension gradients is given by studies of particle evacuation from the alveolar region. Langenback et al. (1990) used sheep to study long term dynamic alveolar clearance of supramicron sized polystyrene particles labeled with 57Co. Using these inert and insoluble particles, they were able to avoid inflammation
and to study normal routes of alveolar clearance over the course of four months. Langenback et al. found three different phases of clearance: a rapid initial phase of tracheobronchial clearance, followed by a slower phase of mostly alveolar clearance, and finally a very slow phase of pure alveolar clearance. Surprisingly, all the particles were removed by the mucociliary escalator, regardless of region of deposition, rather than being removed by the lymphatics. The authors concluded that the major route of particle clearance involves either passive flow of alveolar liquid or by active macrophage participation. Also, macrophage transport was unidirectional from the alveoli to the tracheobronchial tree. They were uncertain exactly what the methods of alveolar transport were, but clearly their results could be explained by the mechanism of clearance due to surface tension gradients.
John, et al. (1994) studied the effects of large tidal volume ventilation (LTVV) on clearance of 0.68 gm fluorescent latex particles from rabbit lungs. Rabbits ventilated conventionally for three hours had most of their latex particles found in clusters, compared
with the controls which had particles in singles. The investigators attributed this clustering to phagocytosis by macrophages. However, both the control group and the conventional ventilation group had similar particle counts in the alveolar tissue; conventional ventilation did not produce accelerated alveolar clearance of particles. The group subjected to LTVV for three hours had significantly lower numbers of particles found in tissue counts. In all groups, very few particles were found to have been cleared by the lymphatics. John et al.
attributed the rapid alveolar clearance in the LTVV group to distension related evacuation of
surfactant into proximal airways. This mechanism could further involve either facilitated movement of particle-laden macrophages due to accelerated movement of the surface film,
or passive movement of nonphagocytized particles with the surface film.
This thesis examines clearance of airway liquid due to surface tension gradients produced by variable strain. A simple planar model is presented in the next chapter, with a brief description of the physics and the key parameters which appear in the numerical model developed by Espinosa. In Chapter 4, the experimental model and protocol are presented, along with expected results from the numerical simulation. Experimental results are given in Chapter 5 and are discussed in Chapter 6 with suggestions for future research.
Chapter 3
Model Description
In this chapter, a brief description of the model used to study liquid pumping on a variable-strain sheet will b presented, along with the equations governing the flow. From the equations comes a list of key parameters; the numerical solution yields optimum values of these parameters which are used to design the experiments. Experimental results are
subsequently compared to theoretical predictions to test the validity of the theoretical model.
A detailed derivation of the equations governing liquid layer pumping due to surface tension gradients and numerical simulation techniques are not within the scope of this work. For details on equation derivation and numerical simulation, I refer the reader to Espinosa et al. (submitted 1995.) The complete presentation the model used to describe surfactant function is given in Otis et al. (1994.)
The model"consists of a thin liquid layer of thickness h(x,t), where x is the horizontal coordinate and t is time. The liquid is Newtonian with a viscosity p and density p and contains a soluble surfactant at a constant, uniform bulk concentration C. Some of the surfactant adsorbs to the interface to form a monolayer of surface concentration r(xt). When the surface is maximally packed, the surface concentration is defined as ref.
Surface tension o(x,t) is a function of surface concentration; with no surfactant at the interface the surface tension is ae,. In this system, ram is set to be the surface tension of water, or 7P dynes/cm. In the model a linear equation of state is assumed to describe the relationship between surface tension and surfactant concentration, or
cr = a, -ar (3.1)
where
(am
a = n. (3.2)
Underneath the liquid layer is a membrane whose length, L(t) is given by
L(t) = Lo + ALsin(2J (3.3)
where Lo is the average membrane length, 2AL is the total amplitude of distension and to is the cycle time. Strain in the membrane () is distributed linearly along its length, or:
£ = 2i4 (3.4)
where e is the average strain and 4 is the material point on the sheet, or x/L. At =--O0, the sheet is inextensible; this stiff end represents the "trachea" in the model. At = 1 the sheet strains maximally at twice the value of the average strain; this compliant end represents the "alveolar zone."
The momentum equation can be simplified to one-dimensional, inertia-free flow since certain simplifying assumptions apply. One is that Re<<1, where
Re = p(0'ho / PLo)ho h. (3.5)
(Espinosa et al, 1993.) The initial liquid layer thickness is ho, and the term hhJo/L is the velocity scale from the boundary condition that the shear stress at the interface is
approximately equal to the surface tension gradient, or
du_ _a (3.6)
yeah
The model assumes gravitational effects are negligible compared with the shear stress exerted by the surface tension gradients, or Bo<<l, where
Bo pghoLo (3.7)
ama.
and g is the acceleration due to gravity.
The model also makes the lubrication approximation, and that pressure gradients due to longitudinal interfacial curvature are negligible. The resulting momentum equation and boundary conditions are:
do2u _ o2 dul dcT # y~ (3.8) u(O) = U. (X, t)
where umis the membrane velocity, which after the appropriate coordinate transformation is
given by:
The continuity equation for the liquid layer is:
A 0(3.10)+ (h!~)
~=o
-
-where is the average liquid layer velocity. This equation was developed with the assumption that no liquid moves across the membrane over the times considered.
The last of governing equations concerns the conservation of surfactant at the interface. Transport of surfactant along the interface is assumed to be dominated by convection, since Pe>>l. Here,
Pe= hk 'am (3.11)
pD,
where D, is the surface diffusion coefficient. Sorption of surfactant to and from the bulk is governed by various kinetic relations which are described in Otis et al. (1994.) The final conservation equation is
dl'd
dF+ +d (ru,) =dr,
drk (3.12)tx
dt
In the interfacial dynamics model by Otis et al., the value of drL/dt depends on the local
value of
r.
kc(r-r)- k
2
r
r < r
d_
0
< r er , (3.13)d
0
r=r.f
where F is the maximum equilibrium concentration in the limit of C-ow. These equations describe three regimes of surfactant behavior. When the surface concentration is less than its maximum equilibrium value (3.13a), the transport between the interface and the bulk, or subphase, is sorption controlled, with k governing adsorption and k2 determining
desorption from the interface. When rf<'<rref, the surfactant is modeled as insoluble (3.13b), and when Ir reaches rrc (3.13c), the surface is maximally packed, and any further reduction in surface area is assumed to result in "squeeze-ou't" of surfactant from the interface, with r remaining constant at rf.
From the dimensionless equations (Espinosa et al., submitted 1995) come four parameters which determine how much liquid pumping occurs due to the surface tension
gradients. They are:
D
A
r,
__where:
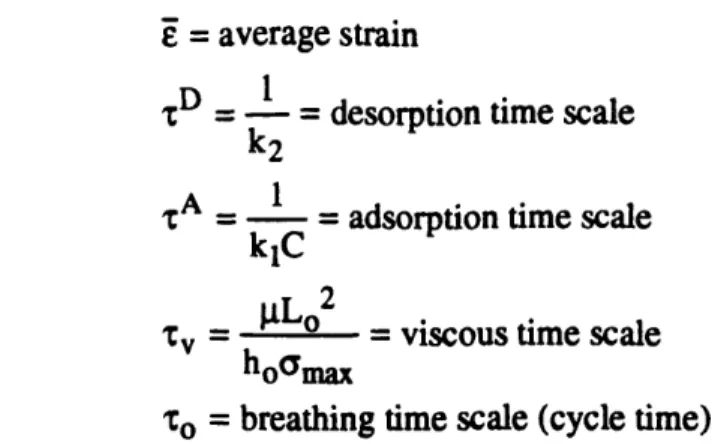
£ = average strain
CD = I = desorption time scale k2
A = 1 = adsorption time scale
kIC
xv = o = viscous time scale
hoema
To = breathing time scale (cycle time)
Espinosa et al. solved the governing equations numerically and investigated how the above four parameters affected liquid pumping. They found a family of curves of net volume pumped toward the rigid (--=O) end per cycle for various values of the dimensionless parameters (see figure 3-1.) There is a definite "envelope" inside which flows due to surface tension gradients are significant. These curves were used to design the experiments. The parameters in the experiments must match the parameters in the model for which significant flows occur, else the flows would be undetectable or nonexistent.
lo 104 hoLo 0 lo 4 -04 To/To
Figure 3-1: Net volume pumped per unit width toward
dimensionless parameter values. From Espinosa et al. (submitted
rigid end for various
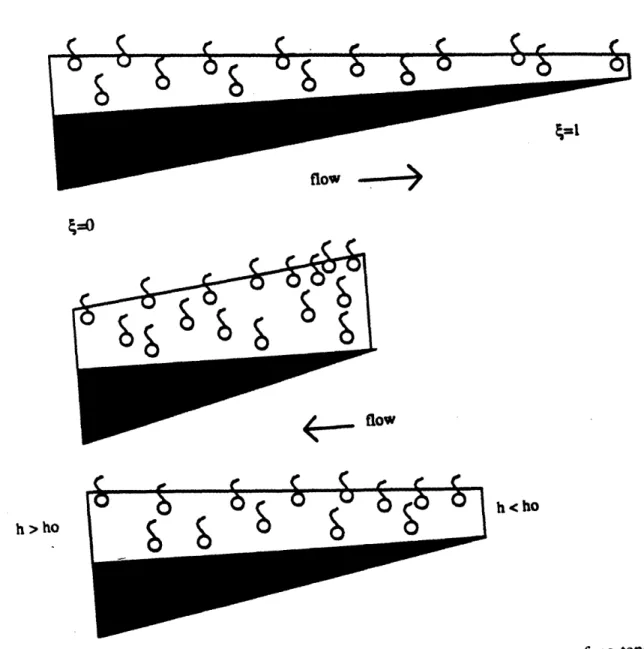
A diagram explaining how these flows are produced provided conditions are correct is shown in figure 3-2. Figure 3-2(a) shows the initial condition with a thin liquid layer containing surfactant spread over a membrane of linearly varying strain. The interface expands upon stretching the membrane, causing the surface concentration,
r,
to drop below equilibrium at the high strain end (fig. 3-2 b). Surfactant simultaneously adsorbs to the interface at the high strain end. The stiff end sees no interfacial expansion, and thesurface tension and concentration remain at equilibrium. The surface tension gradient is
positive, producing a flow from the low strain to the high strain region. Compressing the membrane (fig. 3-2 c) causes
r
to increase at the high strain region. Surface tension drops at the high strain region, not only from physical compression but also from enrichment of the monolayer due to surfactant adsorption while the membrane was stretched. The surface tension gradient is now from the high strain ("alveolar") region to the low strain ("tracheal") region. Flows during the compressed state are greater in magnitude than while the membrane is stretched for two reasons: first because the liquid layer is thicker during compression than expansion, second because adsorption of surfactant to the interface moderates the rise in surface tension on expansion, while the reduction in surface tension during contraction is augmented by the existence of the insoluble regime. This produces a net flow from the high strain to the low strain region. Figure 3-2 (d) depicts the net changesurfactant concentraton C
interfacial conc
r
ant end-alveoli
stiff end - trachea
K
h < ho
h > ho
Figure 3-2: Diagram of flat sheet model
with liquid pumping due to surface tension gradients.
Chapter 4
Methods
The objective of this thesis is to develop an experimental model for liquid pumping due to surface tension gradients produced by regions of variable strain. The experimental apparatus was designed for optimum pumping as indicated by the numerical simulations. The experimental study consisted of two parts. First, the parameter values corresponding to the experiments were determined and the expected results were calculated using the numerical model. If the simulations predicted little liquid pumping, then the apparatus was redesigned. Lastly, the pumping experiments were conducted and results were compared with the expected values from the simulations.
4.1 Parameter Determination
4.1.1 Surfactant: rD & A
Calf lung surfactant extract (CLSE) was used in the experiments and provided by Dr. E. P. Ingenito of Brigham and Women's Hospital. CLSE was chosen for the experiments because it was readily available and provided the desired surface activity. The calf lungs were obtained from a meat packing plant and were used within the hour of receipt to avoid surfactant degradation and contamination. Preparation involved lavaging the lungs with
saline and centrifuging the lavage twice to obtain a surfactant pellet. If a significant amount
of blood was present in the pellet, then a sucrose gradient centrifugation was performed to remove the hemoglobin. Lastly, phospholipid content of the solution was determined by performing a Stuart assay with a spectrophotometer (Spectronic 20D, Spectronic Instruments, Rochester, NY.)
Surface activity of the CLSE was determined using a pulsating bubble surfactometer (Electronetics, Amherst, NY.) The surfactant solution tested consisted of CLSE at a concentration of 1 mg/ml in normal saline and 5 mM CaCl2. Once the solution
at the end of a 0.4 mm diameter capillary and allowed to rest for five minutes to reach
equilibrium. Then the bubble volume was cycled at a frequency of 20 cycles/minute so that
the air-liquid interfacial area changed sinusoidally with time. During cycling, the bubble radius varied between 0.4 mm and 0.55 mm. Data from the surfactometer, such as bubble pressure and bubble radius, were processed using data collection and analysis software (Labtech Notebook, Taunton, MA), an analog-to-digital converter (12-bit Dash-8, Metrabyte, Taunton, MA) and a personal computer (Compu-Add 8086 PC, Austin, TX.) Surface tension was calculated by Laplace's law using measurements of the bubble radius and bubble pressure, and surface tension-area loops were plotted.
Surface tension-area (-A) loops were also obtained for low surfactant
concentrations (0.1 mg/ml CLSE) and non-standard bubble sizes (r = 0.55mm - 0.69mm.) Low concentration a-A loops were required to find the desorption coefficient (k2) in the
model. Surface tension-area loops were obtained for standard concentrations (1 mg/ml CLSE) but for non-standard bubble sizes as a check to determine that different interfacial area excursions produce different surface tension behavior.
The parameters Aand D (i.e., /kIC and /k2) were found by matching as well as
possible the a(-A loops from the surfactometer data and the a-A loops produced numerically from code written by Otis. In Otis et al. (1994), bubble surfactometer data of TA surfactant were used to find the parameters for the model. The same iterative procedure was used here, on the assumption that the behaviors of TA surfactant and CLSE were similar because of their similar compositions and because equilibrium surface tensions were about the same for both surfactants. Various values of kjC and k2were chosen until the shapes of the a-A loops and the minimum surface tensions from both the high and low concentration data
matched in the experiments and theory.
The solutions used in the liquid layer pumping experiments contained the additional ingredients glycerol and fluorescein, for reasons explained later in this chapter. There were few bubble surfactometer studies done on surfactant solutions containing glycerol, and none were conducted with fluorescein in the mixture, as both ingredients tended to damage
the surfactometer.
4.1.2 Liquid layer parameters and Sheet design: , & E
In order to obtain the correct viscosity, glycerol had to be mixed in the surfactant solution. Various volume ratios of glycerol and saline were mixed and viscosities of the mixtures were determined using a standard bulb viscometer. We did not measure the viscosity of the surfactant/glycerol/saline solution, however, because the liquid charge required for the viscometer was too large for the amount of surfactant we had available at any one time.
CLSE concentrations used in the experiments were I mg/ml. At these surfactant concentrations the glycerol was likely to be the most viscous component, so the difference in viscosity of the solutions with and without surfactant were probably not significant.
There were several critical aspects to the design of the rubber sheet. One was that
the top of the sheet must be able to be cleaned easily and must be wettable by the surfactant
liquid to obtain sufficiently thin films. The shape of the sheet must be such that it would deform as little as possible as the sheet was stretched and relaxed during the experiments. Lastly, the thickness profile of the sheet was designed to give a nearly linear strain profile with sufficiently high average strain (E) so that liquid pumping would be detectable.
The final design of the rubber sheet is shown in figure 4-1. The base was formed from silicone rubber (Silastic® T-RTV, Dow Coming, Midland, MI) cast in a mold constructed from plexiglass. The sloped underside of the sheet would produce a hyperbolic strain profile which would be approximately linear along most of the sheet. However, the sloped underside also caused surface deformation, for the sheet dipped downward at the thin region as it was stretched. The relatively long and gentle slope of the underside minimized this deformation. The length of the sloped region was 5 cm, and the thickness of the rubber was about 6mm at the thick end and mm at the thin end. The rubber base also had holes molded into the sides for placement of 13 gauge steel hypodermic wire (Small Parts, Inc. Miami Lakes, FL). The steel wires served as supports to reduce lateral necking as the sheet was stretched. Finally, the silicone rubber base was coated with a thin layer of urethane latex rubber (Heveatex, Fall River, MA) dyed black with india ink for better visualization during the experiments. The latex coating was necessary so that the surfactant solution would spread to a thickness of 0.1mm without beading up.
thin coating of black urethane latex
I -l 7v holes tor metal posts to reduce necking
silicone rubber base, molded
To find the strain profile of the rubber sheet, small rubber dots (about 2mm in diameter) colored with fluorescent yellow dye were placed in a grid-like pattern on top of the black rubber top layer. Photographs of the sheet in its relaxed and stretched state were taken, and distances between the dots were measured on the photographs by hand. From the measurements, the strain profiles in both the axial direction and lateral direction (necking) were determined.
4.2 Apparatus
A schematic of the apparatus is shown in figure 4-2. The rubber sheet was mounted on a converted micromanipulator which served as a spring loaded platform. The platform was moved back and forth by a cam and follower which were attatched to a 1/50 horsepower variable speed motor (Bodine Electric Motors, Chicago, IL.) Platform displacement (and therefore the average strain in the rubber sheet) was controlled by the eccentricity of the cam. Cams of various eccentricities could be attached to the motor shaft. The spring-loaded platform and motor were mounted on an adjustable platform so that the surface
could be leveled to minimiz gravitational flows.
The surfactant liquid mixture was thinly spread over the top of the rubber sheet. To determine the liquid layer thickness a fluorescent dye, fluorescein, (Sigma Chemical Co., St. Louis, MO) was added to the surfactant mixture at a concentration of 0.5 mg/ml. Fluorescein absorbs at a peak of around 442-500 nm light (violet) and emits around 514-550 nm (yellow-green.) An ultraviolet lamp was used with sufficient power to excite the dye but not so strong as to cause extensive photobleaching or heating of the liquid layer. At these concentrations and film thicknesses Beer's law holds, i.e., the intensity of the
emitted light is directly proportional to the film thickness. (Lakowicz, 1983.)
F= I0o(1-e ) = 0Ioebc (4.1)
where:
F = emitted light intensity 0= quantum efficiency Io = intensity of incident light
e = molar absorptivity
b = film thickness
c = fluorescein concentration and 0, Io, s, and c remained constant throughout the experiment.
. ... .. .. s.... ... . ..-....-... : ...:... i:.:.:.:i:.:.:.:.:.:.:.:.:.:. .:.:.::-:-:-:-:-:-:-:.:.:.:-: 1. Liquid layer 2. Rubber sheet
3. Spring loaded platform 4. Variable displacem cam 5. Variable speed motor
6. Adjustable platform 7. Ultraviolet lamp
8. Photometrics CCD camera 9. Camera cooling system
10. Computer
Figure 4-2: Schematic of the apparatus
Images of the liquid layer were taken with a liquid-cooled CCD camera (Photometrics Ltd., Tuscon, AZ) and displayed on a PC monitor (Gateway 2000 486 PC, Sioux City, IA.) Liquid layer thicknesses were obtained using the image analysis software
package Optimas (Bioscan Inc., Edmonds, WA.) Each pixel on the image had a gray-scale
value which corresponded to the emitted light intensity. To obtain an intensity profile of an object, a line was drawn across the object's image on the screen with the mouse. The user would specify the line width and the number of points along the line where gray-scale
values would be obtained. Optimas would average the gray-scale values over the line width
at each specified interval, and return a profile of intensity values. In this case, profiles were obtained at 0.5 mm intervals over a line width of 0.5mm. Slight imperfections in the rubber sheet or tiny bubbles in the surfactant liquid produced some noise in the profiles. This noise was filtered when the data were analyzed by applying a smooth curve fit to the profile. Length scales were calibrated on Optimas from an image of a ruler taken at the beginning of each experiment.
Gray-scale intensity values were calibrated to the film thickness using a triangular calibration chamber of known dimensions. The chamber was constructed from pieces of polystyrene spectrophotometer cuvettes (Fisher Scientific, Pittsburgh, PA) with the dimensions shown in figure 4-3. Polystyrene was chosen so that the ultraviolet light may pass through and excite the dye in the surfactant mixture that filled the chamber. Intensity profiles were obtained along the length of the chamber, and the gray-scale values obtained corresponded to the known liquid thicknesses inside the chamber. Calibration with the chamber also served as a validation of Beer's law and as a test to determine any effects of photobleaching.
h(0) - 0 mm
4
A|~~J
I
h(L) = 0.5 mm-
f
L=40mm
4.3
Experimental Protocol
A series of -calibration procedures were performed before the liquid layer pumping experiments. First, the CLSE was checked in the pulsating bubble surfactometer to make certain that it was still active, since it has a tendency to degrade quickly. Then, once the apparatus was in place and the camera focused, images of the ruler and of the filled calibration chamber were taken for length and liquid layer thickness scales. Strain profiles of the rubber sheet were also calculated before the actual experiments to make sure there was sufficient strain for pumping to occur.
Before the liquid layer was spread, the platform was leveled using a small bubble level which was placed on top of the rubber sheet. Then the rubber sheet was cleaned with acetone and allowed to dry. 0.1 ml of surfactant liquid was spread evenly with a syringe over a 5 cm x 2 cm area on the unstretched rubber sheet, to give an average thickness of 0. mm. The liquid did not spread on its own, but once it was spread by hand it did not bead up. Liquid without surfactant would bead up immediately. After spreading, the liquid layer was allowed to set for 5 minutes so that uneven spreading may be leveled by
gravity and that the surfactant may come to equilibrium at the interface.
The rubber sheet could not be kept level at all times, for it would dip slightly when it was stretched. Improper placement of the metal rods when the rubber sheet was formed also produced deformation of the sheet, so experiments were conducted to determine the effects of gravity on the flows in the liquid layer. At various times, intensity profiles of the liquid layer were taken at the "top", "middle" and "bottom" (see fig. 4-4) of the sheet when the sheet was in its stretched and relaxed state. These data indicated flows solely due to gravity and not surface tension gradients. The intensity profiles were also used to validate the strain profile previously obtained, for profiles taken immediately before and after stretching or relaxing the sheet should reflect the percent change in the surface area of the sheet.
topline
midline
bottomline
Before the pumping (or "breathing") experiments, the liquid layer was spread over the relaxed sheet. Then the sheet was stretched and then held at fixed length for 5 minutes to allow the liquid to level out and the surfactant to adsorb to the interface. The intensity profile after 5 minutes rest was regarded as the initial profile. Intensity profiles were again taken at the top, middle and bottom of the sheet. To achieve flows due to surface tension gradients the sheet was stretched and relaxed sinusoidally in time with a cycle period of
either 3.0 or 5.5 seconds. (The cycle times were varied to examine the effects of breathing period on liquid layer pumping.) Intensity profiles were taken at various time intervals, but
always when the sheet was in its stretched state. The time intervals were: after the first "breath" (or complete cycle), after about ten breaths, after 2 minutes of cycling and after 5 minutes of cycling. According to the numerical model, these times were sufficient to produce detectable changes in liquid layer thickness caused by pumping from surface tension gradients.
More sensitive measurements of liquid layer velocities were made using small (45 Im) fluorescent latex particles (Polysciences, Warrington, PA) in the solution instead of fluorescein. The yellow-green particles absorbed and emitted at the same wavelengths as the fluorescein, so the same UV lamp was used. The density of the particles was 1.05 g/ml, so they were expected to rise near to the surface of the denser liquid layer. The surfactant solution containing a dilute suspension of the particles was spread over the latex sheet, and the experimental procedure used in the fluorescein experiments was repeated. Photographs of the liquid layer simply contained bright spots which could be identified and
Chapter 5
Results
The results to the experiments described in the previous chapter are given here. First, the experimental parameters are determined, and the expected results are calculated from the numerical model. Also, the assumptions made in the numerical model are checked against the experimental parameters. Finally, results from the liquid pumping experiments are presented and compared to the theory.
5.1 Parameter Determination
5.1.1 Surfactant: rD & rA
The steady-state surface tension-area loops for CLSE are given in figures 5-1. Steady-state loops for standard concentrations (lmg/ml) of CLSE in saline were reached almost immediately (fig. 5-la.) Different sample preparations of CLSE produced slightly different shapes in the hysteresis loops, yet the overall behaviors were consistent. Minimum and maximum surface tensions were the same among samples, and the sudden rise in surface tension upon expansion of the bubble was present in the loops from all sample preparations. The "clicking" phenomenon described by Schurch et al. (1989) was also observed when the bubbles reached minimum area, which would indicate surfactant film collapse.
The loop for the low (0.01 mg/ml) concentration of CLSE is given in figure 5-lb. It was difficult to tell when the solutions containing a low concentration of surfactant reached steady state since the dynamic behavior changed very slowly, so the time when the "final"' loop was measured was somewhat arbitrary. However, this had little effect on the parameter value determined for the model.
I ,.j/ml SLcE
'n
Nsa!.ne
& 5rnmA , K..
-u) .4 .,.Am/. e - -k ., a1u !r -I $ 0 ! II
M D/
/f..
IG i o a I I I ! i2 I I r I [ i ] * v , . . . .I. 2 2 24 2 2* 3 3.2 14 3_A-M
AG
t
(IMll
Figure 5-la: Steady-state surface tension-area loop for CLSE at lmg/ml concentration in normal saline and 5 mM CaCl2. Standard bubble size, frequency = 20/min, t = mm, T =
280C.
0.01 mg/ml CLSE n Nsaline & mM CaCI7 rOQ.4-Q.M?-T:4Y.fwr2fmti,. i. M
I
*1I
.I IC a 2 2 2 2 1 I.. i. Xi O"Mm
-b"
f*S.
2 .14 &1 3sFigure 5-lb: Surface tension-area loop for 0.01 mg/ml concentration CLSE in normal
saline and 5 mM CaC12. Standard bubble size, frequency = 20/min, t = 1.33 hrs, T = 280C.
LA
m
I mg,/ml CLSE in Noaline & rmnM CrCI2 ID 40 -10 -0 is 4
4.2
I I I I ! 4.4 4. 4. 9,_ *Ad ('NFigure 5-lc: Surface tension-area loop for 1 mg/ml concentration CLSE in normal saline
and 5 mM CaC12. Non-standard bubble size (r = 0.55 mm to 0.69 mm), frequency = 20/min, t = 1 min, T = 300C.
I 12 l4 I I
-- _ _ _ _ __
The hysteresis loop for the non-standard (r = 0.55mm to 0.69 mm) bubble size is shown in figure 5-1c. The surfactometer did not record a minimum surface tension of 0 dynes/cm, but the clicking of the oversized bubble produced severe deformations in its spherical shape, which suggests that there may be some error in the surfactometer recording due to the deformation of the bubble as it "clicked." However, comparison of the loops for standard and non-standard bubble sizes reveals how the surfactant behaves differently with different percent area changes. The standard loops correspond to a 47% change in bubble area; this relatively large change produces the large hysteresis area and low minimum surface tension. The non-standard loops correspond to a 36% change in bubble area, which produces less hysteresis area, and higher minimum and lower maximum surface tensions. This difference in surfactant behavior with varied surface area excursions (or variable strain) produces the surface tension gradients in the flat sheet model.
The hysteresis loops from the numerical model for the surfactant solutions without
glycerol are given in figures 5-2. The values of kIC and k2used in the numerical model are klC = 25/min and k2 = 4/min, or CA = /klC = 0.04 min and xD = 1/k2 = 0.25 min, for a ratio of D /,CA = 6.25. The model captured well the rectangular shape and the low (almost
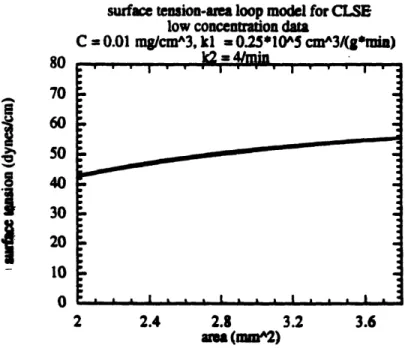
0 dynes/cm) minimum surface tension of the surfactometer loops for the standard bubble size and surfactant concentration (fig. 5-2a.) The same minimum surface tensions (about 42 dynes/cm) and small hysteresis area were present in both the model and experimental results for the loops for low concentration of surfactant. (fig. 5-2b) And the more elongated shapes and lower maximum surface tensions in the non-standard bubble size loops were captured in the model results. (fig. 5-2c) The model differed from the measurements in the following respects: the model consistenly underpredicted the maxiumum surface tension obtained, and the model did not capture the difference in the slopes of the loop between expansion and contraction. These differences were not expected to affect the results significantly, and were likely to slightly underestimate the
surface tension-area loop model for CLSE C = 0.001 g/cmA3. kl = 0.25* IOA5 cmA3/(g*nin)
k2 = 4/rmin 80 70 60 50 40 30 20 10 0 2 2.4 2.8 3.2 3.6 am (mA2)
Figure 5-2a: Steady-state model surface tension-area loop. Standard concentration (1
mg/ml CLSE) and standard bubble size. frequency = 20/min. kC = 25/min, k2 = 4/min.
80 _A 70 g 60 .0 50 a 40 30 20 10 0
surface tension-area loop model for CLSE low concenuation data
C = 0.01 m/cma^3, kl - 0.2Sl'OA5 cmA3/(g*min)
It2 = 41min
2 2.4 2.8
ama(mm2)3.2 3.6
Figure 5-2b: Model steady-state surface tension-area loop for non-standard
concentration (0.01 mg/ml) CLSE. frequency = 20/min.
:
. . . I .. . I