Supplementary Data
Intra- and inter-rater reliability
As we used a new technology, there is no information available about the reliability of the methodology used in this study. Therefore, we assessed intra- and inter-rater reliability on ten hill jumps. Each jump was evaluated twice by each of two different experimenters (rater) and the biomechanical parameters were calculated for every jump.
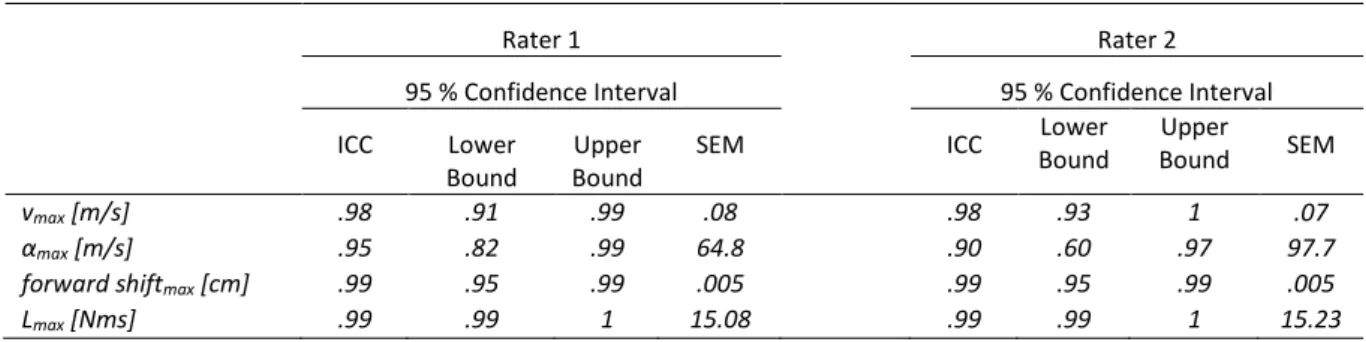
For the intra-rater analysis, the intraclass correlation coefficient (ICC) is assessed. According to the classification of Shrout and Fleiss22, an ICC-type specified as (ICC3,k) is used. The underlying SPSS model is a two-way mixed model with absolute agreement. The selected confidence interval is 95 % and the correlation is reported by mean of k raters. For the inter-rater analysis, a different approach must be used. Since both inter-raters evaluated each jump twice, there are four different interrater combinations, all of which have their own ICC (Rater 1a vs. Rater 2a, Rater 1a vs. Rater 2b, Rater 1b vs. Rater 2a, Rater 1b vs. Rater 2b). However, in order to obtain a single ICC value indicating inter-rater reliability per parameter, the ICC is calculated from the output of a repeated measure ANOVA.23 The calculated ICC are evaluated according to the classification of Portney and Watkins24. In addition, the standard error of measure (SEM) is calculated for each parameter of the reliability analyses. The results for intra-rater reliability and inter-rater reliability are given in table 3 and 4, respectively.
Table 3: ICC and SEM for intra-rater reliability.
Rater 1 Rater 2
95 % Confidence Interval 95 % Confidence Interval ICC Lower
Bound
Upper Bound
SEM ICC Bound Lower Bound Upper SEM
vmax [m/s] .98 .91 .99 .08 .98 .93 1 .07
αmax [m/s] .95 .82 .99 64.8 .90 .60 .97 97.7
forward shiftmax [cm] .99 .95 .99 .005 .99 .95 .99 .005
Table 4: ICC and SEM for inter-rater reliability 95 % Confidence Interval ICC Lower Bound Upper Bound SEM vmax [m/s] .99 .92 1 .04 αmax [m/s] .96 .75 .98 57.5
forward shiftmax [cm] .99 .95 1 .006
Lmax [Nms] 1 1 1 16.6
Correlation analysis
We conducted a Bravais-Pearson correlation analysis to investigate the relationship of the measured biomechanical parameters and the achieved jumping distance. The jumps were recorded in nine male athletes during the national german championship 2018. The results of the correlation analysis are given in Table 5.
Table 5: Correlation coefficient for the biomechanical parameters and the jumping distance. * p < .05.
r p
vmax [m/s] .55* .014
αmax [m/s] -.01 .489
forward shiftmax [cm] .01 .492
![Table 4: ICC and SEM for inter-rater reliability 95 % Confidence Interval ICC Lower Bound Upper Bound SEM v max [m/s] .99 .92 1 .04 α max [m/s] .96 .75 .98 57.5](https://thumb-eu.123doks.com/thumbv2/123doknet/14320209.496937/2.892.105.501.135.274/table-reliability-confidence-interval-lower-bound-upper-bound.webp)
