HAL Id: hal-02062344
https://hal.archives-ouvertes.fr/hal-02062344
Submitted on 8 Mar 2019
HAL is a multi-disciplinary open access
archive for the deposit and dissemination of
sci-entific research documents, whether they are
pub-lished or not. The documents may come from
teaching and research institutions in France or
abroad, or from public or private research centers.
L’archive ouverte pluridisciplinaire HAL, est
destinée au dépôt et à la diffusion de documents
scientifiques de niveau recherche, publiés ou non,
émanant des établissements d’enseignement et de
recherche français ou étrangers, des laboratoires
publics ou privés.
scat: Learning from a Single Execution of a Binary
Franck de Goër, Christopher Ferreira, Laurent Mounier
To cite this version:
Franck de Goër, Christopher Ferreira, Laurent Mounier. scat: Learning from a Single Execution of
a Binary. IEEE 24th International Conference on Software Analysis, Evolution and Reengineering
(SANER), 2017, Klagenfurt, Austria. �hal-02062344�
scat: Learning from a Single Execution
of a Binary
Franck de Go¨er
Laboratoire Informatique de Grenoble Univ. Grenoble Alpes
France
Christopher Ferreira
Verimag Univ. Grenoble AlpesFrance
Laurent Mounier
Verimag Univ. Grenoble AlpesFrance
Abstract—Retrieving information from a binary code is re-quired in several application domains such as system integration or security analysis. Providing tools to help engineers in this task is therefore an important need. We present in this paper scat, an open-source toolbox, relying on lightweight runtime instru-mentation to infer source-level and behavioral information from a binary code, like function prototypes or data-flow relations. We explain the functioning principle of this toolbox, and we give some results obtained on real examples to show its effectiveness. Index Terms—Reverse-engineering, data-flow, binary code, dynamic analysis, memory allocation
I. INTRODUCTION
“ Reverse engineering, also called back engineering, is the processes of extracting knowledge or design information from anything man-made. ” [3]
In computer sciences, one often wants to understand a pro-gram behavior, either for integration, for testing, for security analysis, etc. This analysis of the behavior is much easier to do from the source code, but sometimes the only thing we have is a binary file. This can be the case with commercial products as well as with malwares for instance.
In this paper, we introduce scat, a tool based on Pin for reverse-engineering binaries in a few executions with an acceptable overhead. The goal of scat is to retrieve source-level (in particular prototypes of functions) and behavior-level (coupling, memory management, etc.) information from a binary under some critical constraints: no source code, no compilation with special flags, possibly stripped. For each analysis, scat works over one single instrumented execution, and performs heuristics-based inferences.
Section II presents scat as a toolbox, ie how to use it and what it is capable of. Section III presents some interesting aspects of scat under the hood. Finally, section IV presents some experiments we conducted and some numeric results.
II. USINGscat
In this section, we present the main capabilities of scat through a chosen example: mupdf. Mupdf is an open-source PDF reader. Selecting an open-source system enables us to validate our results, but our tool does not rely on it nor does it require specific compilation options.
A. Recover Prototypes
The first feature of scat is to recover prototypes of functions. To do so, two kinds of information need to be recovered: the arity (i.e., the number of parameters) and the type of each parameter (plus the type of the return value). Each of the following two steps is performed in one single execution with a low overhead due to instrumentation (see sections IV-A and IV-B for more details).
1) Arity: The first step to retrieve function prototypes is to retrieve the arity of functions. We execute the program under the analysis called arity:
| scat> launch arity mupdf-x11 poc.pdf
This command runs the program mupdf-x11 under anal-ysis, and logs the results of the inference in a file. After this, we can display the results using the command display, but it is more interesting to complete the prototype inference by retrieving type of parameters before displaying results.
2) Type: Note that we only consider a subset of all high-level types that exist: INT (integers), ADDR (pointers) and FLOAT(floating values). We consider that it is not a priority to differentiate a short int from a long int, nor a pointer to a string from a pointer to an object. What we want to know is if we can dereference a parameter or not.
| scat> launch type mupdf-x11 poc.pdf
After this step, we can display the prototypes inferred by scat:
| scat> display mupdf-x11 type | ...
| addr fz_keep_font(addr, addr); | void fz_drop_font(addr, addr); | ...
One can check that these prototypes correspond to functions we can find in the source code of Mupdf1.
scat also gives general information about what was in-ferred:
Inference
| Date: 2016-10-07 16:00:59 | Total functions inferred: 841
- Program functions inferred: 517
1See for instance http://mupdf.com/docs/browse/include/mupdf/fitz/font.h.
3) Remarks:
• Due to the single execution, we miss a lot of functions as we only catch the ones that are executed during this particular trace. This point will be discussed in section IV-A.
• In this paper, we present results including function names.
scat uses function names as identifiers if the symbol table is embedded in the binary, but it is not required: scat works as well on stripped binaries.
• Every analysis we present in the following sections use the prototype inference as a base.
B. Memory Analysis
Another interesting feature of scat, from the results of the previous one, is to perform memory use analysis of various kind. First, scat runs once again the binary under analysis in order to collect runtime information about addresses used (see section II-B1). Then, from the data collected, we can infer behavioral information (see section II-B2), retrieve allocators (see section II-B3), reconstruct memory blocks (see section II-B4) and perform some safety and security checks (see section II-B5).
1) Online - Collecting Data: The first step to perform memory analysis using scat is to collect data at runtime. This can be done using the module memcollect which traces every call and return from a function that deals with addresses (either in parameter or in return value).
| scat> launch memcollect mupdf-x11 poc.pdf
This step outputs a log file containing lines of the type io:type:val:func:tc where:
• iois either in if the line corresponds to a parameter or out if it corresponds to a return value ;
• typeis the type of the value (ADDR, INT or FLOAT) ;
• val is the concrete value of the parameter ;
• func is the function that is taking this value as a parameter or returning this value ;
• tc is the timecounter of the call or return. The following steps are based on this log file.
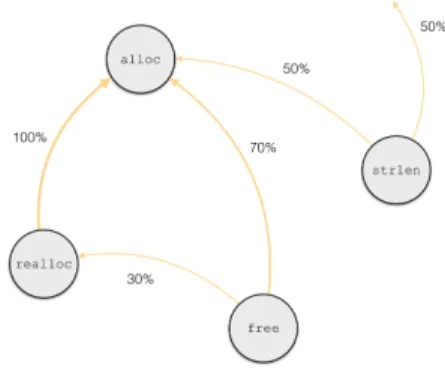
2) Coupling: The idea of coupling (detailed in [2]) is to illustrate relevant dataflows between functions. More precisely, we say that a function f is ρ-coupled to g if the parameter of g comes from a value output by f with a proportion of at least ρ. Note that we only consider coupling between ADDR parameters. Figure 1 illustrates the idea on a forged example. On this figure, an arrow from g to f labeled with the percentage ρ represents the dataflow between the output of f and the input of g with a proportion of ρ. For instance, the parameters of free come from alloc with a proportion of 70% and from realloc with a proportion of 30%.
To compute couples, the command is couple:
| scat > couple mupdf-x11 | [*] parsing memory blocks...
| [*] #f: 706 | #g: 228 | #in: 2379871 | #out: 687874 | [*] computing couples...
| ...
| (’fz_malloc_array’, ’js_free’, 0.9914)
Fig. 1. Illustration of the idea of coupling on a forged example | ...
Coupling gives a good idea of the interactions between func-tions. In this example, we find coupling between allocating and liberating functions. Note that there are a lot of couples output in this case, but with a few different functions (706 left-functions and 228 right-functions). Some additional work is required to extract the relevant data from this output, but automatic tools can use this to discover dataflows and track the user inputs for example.
3) Retrieve Allocators: From the memory trace, scat can also try to retrieve the allocating and liberating functions. Technical details are given in section III-B2. The knowledge of allocators is very helpful to track memory bugs (e.g., memory leaks, read-before-write, ...) and memory vulnerabilities (e.g., use-after-free). This is a problem when memory blocks are managed by a custom embedded allocator that one does not know a priori. The command to launch the allocator retrieving analysis is memcomb:
| scat > memcomb mupdf-x11
| [*] allocator found - mupdf-x11:4210672: | [*] liberator found - mupdf-x11:4211232:
In the case of mupdf, the allocator found is the Global Offset Tablerelative to malloc from the standard libc. This is the result one can expect, as mupdf does not use a custom allocator. An example with a program embedding a custom allocator is presented in section IV-C. Note that this is a work in progress: we are currently experimenting deeper to validate our approach at a larger scale.
4) Reconstruction of Memory Blocks: Once ALLOC and FREE have been retrieved, it is possible to reconstruct the history of the memory during the execution (using the data produced in section II-B1). To do so, scat uses a simulated memory that allocates and liberates blocks each time ALLOC or FREE is called. The size of each block is assumed to be the first INT parameter of ALLOC. Performing this reconstruction ca be useful, for example, to perform some checks on memory use during the execution.
5) Memory Checks: The next step is to use this memory reconstruction to check accesses. For instance, we can check that every address given as a parameter corresponds to an allocated block. We can also check that blocks are freed before
the end of execution, etc. This work is currently in progress, and the implementation is not available yet.
C. Modularity
In addition to the capabilities of scat we presented in this section, one can develop its own analysis and include it to our tool easily. The process is described in the GitHub page of the project2.
III. INSIDEscat
For its analysis, scat works on two levels. It leverages the instrumentation facilities offered by the Pin software [5] to execute the program, collect some runtime data about it and store them. Then, the offline step uses these runtime data to deduce high-level information.
A. Dynamic Instrumentation with Pin
1) Register Access: Thanks to Pin, scat can keep track of register accesses. This is the cornerstone of the arity analysis. Consider this simple execution of pseudo-instructions :
WRITE register X
// ... other instructions ...
// (where register X is not modified) CALL callee
// ... other instructions ...
// (where register X is not modified) READ register X
In this sample, the value of register X read by function callee is the same value written by the caller. This kind of pattern is most likely due to a parameter of function callee being passed in the register X. Building on this, scat monitors register accesses and function calls/returns to infer functions arity. See Algorithms 1 & 2.
Input: reg: register being written
Data: call_stack: Stack of the function calls, last_write: Tells for each register the last function from the call_stack which wrote this parameter
Result: Update last_write according for the register being written
begin
last write[reg] ← call stack.current() end
Algorithm 1: on register write
2) Address Tracking: The main part of the type analy-sis is to differentiate between parameters of type INT and parameters of type ADDR. Indeed, FLOAT parameters are actually straightforward to detect because they are passed through specific registers (%xmm0 to %xmm7). To do this, scat executes the program and does two things :
• Monitor memory writes to infer the range which corre-sponds to valid memory addresses.
• Keep for each function parameter a fixed number of values.
2https://github.com/Frky/scat#add-your-own-pintool
Input: reg: register being read
Data: call_stack: Stack of the function calls, last_write: Tells for each register the last function inside the call_stack which wrote this parameter, param_detections:
param detections[f][p] is the number of times the parameter of index p for function f has been detected.
Result: Modify param_detections to account for the new parameter detection
begin
foreach f in call stack from last write[reg] up to the topdo
param index = param index for reg(reg) ; param detections[f][param index] ++ ; end
end
Algorithm 2: on register read
Once this is done, for each parameter, if a sufficient portion of the stored values (empirically fixed at 75%) is inside one of the inferred address ranges, the parameter is then deduced to be of type ADDR.
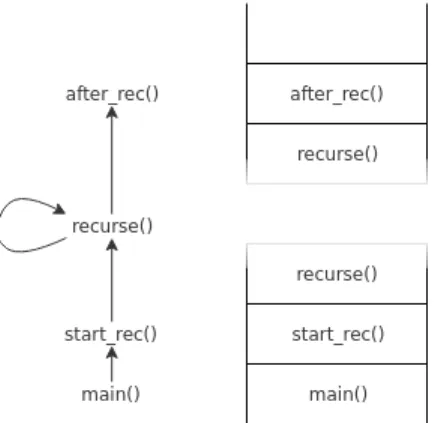
3) Hollow Stack: For the arity and type analysis for which the recovered data are related to functions, scat has to keep tracks of the current call stack. In order to do this accurately, i.e., keep track of a good sampling of the calls for each functions but not each and every calls, and to avoid some performance and memory issues with heavy recursive calls, it was necessary to design a (new) dedicated solution we named Hollow Stack. The Hollow Stack behaves exactly like a straightforward fixed-size stack until the limit size is reached, in which case it will discard elements in the middle. The intuition is that with a reasonably-sized stack (for example, the number of functions inside the executable can be used as a large upper bound), overflows will only occur in cases of heavy recursion, and when this happens the stack will be filled with a lot of redundant calls in its middle while the bottom and the top will contain relevant calls (head and tail of the recursive calls chain). The principle of this stack is shown in Figure 2.
B. Offline Analysis
1) Prototype Result Analysis: scat provides a way to validate its results on prototype recovery using the source code of the binary under analysis and/or debugging information. This can only be done in a particular context of testing where this kind of information is available. This requires two steps. First, create an oracle from the source code (using clang) and/or from the debugging information (using dwarf). This oracle contains the source-level prototype of each function, including its arity and the type of each one of its parameters.
| scat > parsedata mupdf-x11 src/mupdf/
Second, once this oracle is generated, we can compare the results extracted from dynamic analysis (as described in
Fig. 2. Recursive calls chain and the corresponding hollow stack
section II-A), either for the arity inference or for the type inference. For arity, it outputs the accuracy as the percentage of functions where the arity (including the return value) was inferred correctly among the functions inferred (this means that functions that were not inferred are not included in the computation of arity). For types, the accuracy is the number of parameters (including return values) for which the type was inferred correctly relatively to the number of parameters inferred.
| scat > accuracy arity mupdf-x11 | Accuracy of inference
| | Params Ok/Total tested: 561/568 | | Return Ok/Total tested: 565/568 | | Ratio params: 98.77% | - Ratio return: 99.47%
Some results on a few open-source programs are presented in section IV.
2) (WIP) Retrieve ALLOC and FREE: As mentioned in section II-B3, scat provides a module to retrieve allocators from a memory trace. We propose here to present the heuristics based method that scat implements. For ALLOC, the idea stands in one sentence:
ALLOC is the function that outputs the greatest number of new addresses.
This heuristic leads to a simple algorithm to retrieve ALLOC from the memory trace we obtained in section II-B1: see Algorithm 3.
To retrieve FREE, we also base our approach on heuristics that can be summed up in one sentence:
Statistically, FREE is the last function that accesses addresses output by ALLOC (assuming that uses-after-free are rare).
Some results of ALLOC and FREE retrieving experiments are presented in section IV-C.
IV. SOMERESULTS
We present in Table I some results to illustrate the relevancy and the practical usability of our implementation. To obtain these results, we used a set of open source programs written mostly in C, which were compiled from source using the standard options (except for the additional debug flag to get the
Data: log trace of execution (as produced by section II-B1)
Result: The best ALLOC candidate foreach param in trace log do
/* param.id contains the function
that uses this param */
if param.id is external then continue;
end
if param.val already seen then continue;
end
if param is ADDR and param is return value then mark param.val as seen;
increment number of ADDR produced by the function param.id;
end end
return max(all functions, key = number of ADDR produced)
Algorithm 3: Detection of ALLOC
function information for comparison). Sections IV-A and IV-B comment the accuracy of arity and type detection. These two detections are easy to test: as explained in section III-B1, we compare the results obtained with scat with data we extract either from the source code or from dwarf information. Section IV-C comments the preliminary results in allocator detection, but this part is harder to evaluate strongly, because of the lack of benchmark in this way. Finally, section IV-D presents some overhead measurements.
A. Arity
The arity detection, first presented in [2], has been improved since, and now gives very accurate results, as shown in Table I, with an acceptable overhead. We remind that this detection is performed over a single execution. This means that:
• given the low overhead per execution, the detection is light in time,
• however functions that are not called during the one execution will not be recovered.
Relatively to the functions that are wrongly inferred, the main sources of error are:
• Variadic functions: a function that does not take the same number of parameters at each call is currently a problem for our arity detection algorithm.
• Unused parameters: some functions never use a param-eter (often the last one), often because it is deprecated but it has been kept for compatibility reasons.
• Incomplete trace: some functions use some parameters
in specific cases (depending, for instance, on the value of other parameters). Because we do not use code-coverage tools, we may miss some paths in the control flow graph and thus miss parameters.
TABLE I
ACCURACY AND OVERHEAD OFscatON SEVEN OPEN-SOURCE PROGRAMS
bash grep mupdf git tar xterm vim arity total #functions 4176 1559 16680 10597 1154 1103 4978 #functions inferred 53 81 569 476 79 54 198 accuracy (in %) 94 94 99 95 78 95 96 type #parameters 143 204 1500 1112 166 151 443 accuracy (in %) 94 94 97 97 95 95 95 overhead no instrumentation (in s) 0.005 0.006 2.430 213.698 7.523 0.043 1.316 arity(in x) x350 x314 x4.24 x1.04 x1.18 x129 x8.00 type(in x) x311 x259 x4.22 x0.996 x1.15 x137 x7.04 memcollect(in x) x366 x435 x10.2 x1.14 x6.02 x238 x6.57 B. Type
In the same way, we significantly improved our results since [2] relatively to type detection. Types of parameter are detected with an accuracy of about 95%, with a lower overhead than the arity detection (see Table I).
The identified sources of error for type are:
• NULL pointers: some pointer parameters are optional, and sometimes the caller always set it to NULL. In this scenario, scat is not able to detect that the type of this parameter is ADDR, and this leads to a detection mistake. This also affects ”out parameter” whose function use the common idiom of accepting NULL as a way for the caller to tell the callee to allocate the required space.
• Random integers: random parameters or return values
are likely to be detected as addresses, because these values are often in the range of valid addresses.
C. Allocator Detection
The first results of our allocator detection are encouraging, though this is a work in progress. The lack of benchmark (to our knowledge) adapted to allocator retrieving makes an au-tomation of tests difficult. However, we tested our tool on four open-source programs. Three of them use the standard libc allocator (malloc/free), and one is a program we wrote that embed a custom allocator (mem_alloc/mem_free). On those four examples, we successfully retrieve the expected allocators. Adding more tests over well-known open-source programs will be addressed in a future work.
D. Overhead
The last lines of Table I present some experiments to illustrate the scalability of our approach. For each runtime analysis, we give the overhead as a multiple of the normal time of execution. These results are very spare for several reasons (fixed cost of the intrumentation, logging into files, etc.). However, on large programs running for a long time (eg mupdf or git), the overhead is very acceptable.
V. RELATEDWORK
Analysis of binaries with no source-code is a field for which a lot of tools have been developed. Among them, the most famous are probably gdb [7], IDA [4] and Valgrind [6]. GDB is a debugger that is useful to manually analyze an
execution, but does not perform analysis automatically, such as prototype inference. On the other hand, IDA is a fantastic toolbox for a reverse-engineer, which includes a lot of features and powerful capabilities. However, IDA is mainly designed to work statically, so it comes with some limitations (for instance if the binary under analysis is packed). Finally, Valgrind is really interesting to analyze the memory use of a program, but it relies on the knowledge of the allocator.
Relatively to allocator detection, the most advanced research work in this domain is [1]. scat has an approach similar to what is done in this paper: it uses Pin as well as heuristics. However, there are some points of differentiation. For example, they rely on the assumption that the initial allocation (of a large block within the memory handled by a custom allocator) is done by a well-known allocator (typically malloc or memmap/brk). Our approach does not rely on such an assumption. In addition, by opposition to membrush, our tool is open-source3.
VI. CONCLUSION
In this paper, we presented scat, an open-source toolbox that we designed to perform scalable dynamic analysis of binaries in one execution. We showed that scat allows to retrieve prototype of functions with a reasonable overhead, and we presented an approach to perform memory inspection, combining an online and an offline step. The central idea, allocator detection, is not mature yet but is promising.
REFERENCES
[1] X. Chen, A. Slowinska, and H. Bos. Who allocated my memory? detecting custom memory allocators in c binaries. In 2013 20th Working Conference on Reverse Engineering (WCRE), pages 22–31. IEEE, 2013. [2] F. de Go¨er, R. Groz, and L. Mounier. Lightweight heuristics to retrieve
parameter associations from binaries. In PPREW5, 2015.
[3] E. Eilam. Reversing: secrets of reverse engineering. John Wiley & Sons, 2011.
[4] S. Hex Rays. Ida pro disassembler and debugger.
[5] C.-K. Luk, R. Cohn, R. Muth, H. Patil, A. Klauser, G. Lowney, S. Wal-lace, V. J. Reddi, and K. Hazelwood. Pin: Building customized program analysis tools with dynamic instrumentation. SIGPLAN Not., 40(6):190– 200, June 2005.
[6] N. Nethercote and J. Seward. Valgrind: A framework for heavyweight dynamic binary instrumentation. SIGPLAN Not., 42(6):89–100, June 2007.
[7] R. Stallman, R. Pesch, S. Shebs, et al. Debugging with gdb. Free Software Foundation, 51:02110–1301, 2002.