Accurate Estimation of Membrane Capacitance from Atomistic
Molecular Dynamics Simulations of Zwitterionic Lipid Bilayers
Vikram Reddy Ardham, Valeria Zoni, Sylvain Adamowicz, Pablo Campomanes, and Stefano Vanni
*
ABSTRACT: Lipid membranes are indispensable to life, and they regulate countless cellular processes. To investigate the properties of membranes under controlled conditions, numerous reconstitution methods have been developed over the last few decades. Several of these methods result in the formation of lipid bilayers containing residual hydrophobic molecules between the two monolayers. These contaminants might alter membrane properties, including bilayer thickness, that is usually inferred from measurements of membrane capacitance assuming a simple slab model. However, recent measurements on solvent-free bilayers raised significant questions on the reliability of this approach. To reconcile the observed discrepancies, we developed a protocol to predict membrane capacitance from the dielectric profile of lipid bilayers computed from molecular dynamics simulations. Our methodology shows excellent agreement against available data on solvent-free noncharged bilayers, and it confirms that the uniform slab model is a reliable approximation from which to infer membrane capacitance. We find that the
effective electrical thickness contributing to membrane capacitance is different from the hydrophobic thickness inferred from X-ray scattering form factors. We apply our model to estimate the concentration of residual solvent in reconstituted systems, and we propose that our protocol could be used to infer membrane properties in the presence of hydrophobic solvents.
■
INTRODUCTIONCellular membranes play a pivotal role in the modulation of numerous biological processes.1−4 Therefore, a thorough quantitative understanding of their physical and chemical properties is crucial to understanding and predicting how membranes might selectively modulate cellular mechanisms.
To simplify the extreme chemical complexity of cellular membranes5,6 and to systematically and quantitatively investigate the influence of membrane properties on bio-logically relevant processes, various approaches to reconstitut-ing model cellular membranes in vitro have been proposed in the last few decades.7−14The ultimate goal of these approaches is to reconstitute systems that mimic biological behavior, for example, by membrane embedding functionally active proteins while being able to concomitantly measure membrane properties.
From a practical point of view, however, the precise measurement of membrane properties is not always a straightforward task. Membrane thickness, for example, has been shown to play a major role in regulating membrane protein localization15 or lateral diffusion,16 yet the unambig-uous determination of membrane thickness in reconstituted systems is still an open challenge. This is particularly
problematic since several reconstitution approaches are not entirely solvent-free but rather contain residual oil in the bilayer,17−19 potentially altering the membrane thickness to nonphysiological levels.
The gold standard for the determination of the lipid bilayers’ thickness is based on the estimation of the electron density profiles from X-ray form factors.20 While extremely accurate, this methodology is incompatible with the concomitant investigation of protein activity, and it can thus be performed exclusively for protein-free lipid bilayers. As a practical alternative, the determination of membrane thickness based on capacitance measurements has been used for a number of reliable membrane reconstitution methods, such as black lipid membranes (BLMs),14 droplet interface bilayers (DIBs),11 large-area model biomembranes (LAMBs),7and recently giant unilamellar vesicles (GUVs).21This approach takes advantage
http://doc.rero.ch
Published in "The Journal of Physical Chemistry B 124(38): 8278–8286, 2020"
which should be cited to refer to this work.
of the peculiar organization of a lipid bilayer, where a thin layer of low dielectric constant (εh≈ 2), the hydrophobic membrane
core, separates two aqueous regions of high dielectric constant (εwat≈ 80). As a consequence, if we assume that the relative
dielectric of the entire system can be described with a uniform slab model (i.e., with constant (high) permittivity outside the bilayer and constant (low) permittivity inside the bilayer), then the bilayer capacitance is directly proportional to its relative dielectric constant and inversely proportional to its hydro-phobic core thickness, thus allowing an estimation of the thickness from capacitance measurements.22
While this approach has potential, it relies on several untested assumptions: first, that a slab model faithfully describes the dielectric profile of a lipid bilayer; second, that the contribution of the phospholipid head groups (εP ≈ 10−
30)23,24 to the total capacitance is negligible; third, that the thickness of the bilayer hydrophobic core is precisely known; and fourth, that the relative dielectric of the membrane interior can be considered to be identical to that of alkanes, with values of around 2.0−2.1.25,26
Recently, Garten et al.27 managed to measure for the first time the capacitance of solvent-free lipid bilayers using GUVs. Using afitting procedure based on a uniform slab model, they found that their capacitance measurements led to a value of 2.06 for the dielectric constant of the bilayer interior εh and
observed a good correlation between membrane capacitance and bilayer thickness measured using X-ray form factors. In order to achieve a good correlation, however, they had to subtract from the experimentally derived headgroup-to-head-group thickness a fixed value of 0.78 nm for the interfacial thickness (interpreted as the thickness of the polar head groups), which is different from the experimental value of 0.55 nm.28
In an independent study, Beltramo et al.29 recently noted that in order to convert capacitance measurements to membrane thickness values comparable to those obtained using small-angle X-ray scattering (SAXS), a value of 2.5 for the hydrophobic core dielectric constant provided the bestfit. These discrepancies raise important questions about our theoretical understanding of the electrostatic behavior inside lipid bilayers and our ability to predictively infer membrane thicknesses from experimental measurements of membrane capacitance. This is particularly relevant in the case of oil-enriched lipid bilayers, such as BLMs,14 DIBs,11 or LAMBs,7 that are extremely convenient to use in performing experi-ments in the presence of proteins but for which X-ray measurements cannot be directly performed.
In this article, we provide a protocol to directly determine membrane capacitance from molecular dynamics (MD) simulations of uncharged lipid bilayers, and our results show very good agreement with capacitance measurements on solvent-free lipid bilayers. We show that the “textbook” slab model is a good approximation and that the “electrical” thickness of membranes differs from experimentally deter-mined values of hydrophobic thickness using X-ray spectros-copy. We conclude by showing how the approach we present here can be used to infer the concentration of hydrophobic solvents within a bilayer, which cannot be measured otherwise.
■
METHODSMolecular Dynamics Simulations. All MD simulations were performed under periodic boundary conditions using the GROMACS software.30,31 Suitable starting configurations for
the various solvated lipid bilayers employed in our classical MD studies (Tables 1 and 2) were generated using the CHARMM-GUI membrane builder.32 The all-atom CHARMM36m force field33 was used to describe lipids, and the TIP3P34model was employed for water molecules because this specific water model was used in the development of the CHARMM36 forcefield for lipids.33 Long-range electrostatic interactions were taken into account by means of the particle mesh Ewald (PME)35algorithm with a Fourier grid space of 0.12 nm and a real space cutoff of 1.2 nm. The van der Waals interactions were truncated using the same cutoff value, and a standard smoothing function for the tail region (1.0−1.2 nm) was employed. The bonds involving hydrogen atoms were constrained using the LINCS36 and SETTLE37 algorithms, thus allowing the use of an integration time step of 2 fs. The temperature (298.15 K) and pressure (1 atm) were controlled by coupling the systems to a Nosé−Hoover chain thermostat38
with a time constant of 1 ps−1 and a Parrinello−Rahman barostat39 with a coupling constant of 5 ps−1, respectively. After an equilibration period of about 50 ns, all of the systems (containing about 128 lipids and about 6000 water molecules) were run for at least 400 ns to collect statistics. We simulated bilayer systems for which capacitance values were measured by Garten et al.27(shown inTable 2), and the ion concentration was assumed to be zero.
To perform simulations containing hexadecane and squalene, topologies for the two molecules were obtained using available resources online. For hexadecane, the parameters were obtained using the “ligand reader and modeler” tool in CHARMM-GUI. For squalene, topologies compatible with the CHARMM 27 forcefield were obtained from data available at the online repository.40The parameters for a new atom-type (CEL0) were integrated into the CHARMM36 force field, and the writegmxtop function of TopoTools for VMD was used to convert CHARMM topologies to a format compatible with GROMACS.41
To build these systems, boxes consisting of about 7000 water molecules, 128 DOPC molecules, and a variable number of squalene and hexadecane molecules were initially prepared (Table 1). The two DOPC monolayers were displaced along the z axis in order to allow the insertion of the oil molecules and avoid steric clashes due to overlapping molecules. The oil molecules were subsequently placed randomly between the two monolayers. The systems were equilibrated for 375 ps while slowly removing constraints using the Membrane Builder six-step process.32 After equilibration for about 50 ns, production simulations were run for 400 ns using the same parameters described above for systems not containing oil.
Production runs were divided in two parts of 200 ns each and analyzed separately. The values reported are averages and standard deviations from the two portions.
Table 1. Fraction of Oil Molecules Used in Simulations with Squalene and Hexadecane in DOPC Bilayer Systems
oil fraction no. of oil molecules 0.065 9 (squalene) 0.10 15 (squalene) 0.19 30 (squalene/hexadecane) 0.32 60 (squalene/hexadecane) 0.43 98 (hexadecane) 0.5 128 (hexadecane)
http://doc.rero.ch
Membrane Capacitance. Membrane-specific capacitance values were computed assuming the slab model. The justification for the use of this model is presented in the Results and Discussion. According to this “textbook” model, lipid bilayers can be approximated as uniform parallel plate capacitors embedded in water (Figure 1) because they consist
of low-dielectric hydrocarbon chains connected to a very high dielectric continuum through the small region where the polar headgroups are located and whose contribution to the capacitance is negligible.42As a result, the membrane effective specific capacitance can be calculated from
= + ≈ C C C C 1 1 1 1 h P h (1) ε ε ε ε ≈ = − = C C d 2t d h o h b o h h (2)
where C is the effective specific capacitance of the membrane, Chand CPare the specific capacitances of the hydrophobic and
polar regions, respectively, dbis the bilayer thickness, dhis the
thickness of the hydrophobic core, t is the interfacial thickness, εois the vacuum permittivity, andεhis the dielectric constant
of the hydrophobic region.
The parameters of this model are therefore the dielectric permittivity of the hydrophobic region and the widths of the hydrophobic and polar regions. A general and detailed theory regarding this model is available for inorganic substrates next to solvents, and this topic has been thoroughly discussed in the literature.43−45
Physical Membrane Thickness from MD Simulations. From the MD simulations, we defined two different physical bilayer thicknesses. The first one (dP−P) was defined as the ensemble average of the distance between the phosphorus atoms belonging to both upper and lower lipid leaflets. The second one was defined from the water density profile along
the direction perpendicular to the membrane plane (z axis): from thefirst derivative of this profile, we obtained the bilayer thickness (db) as the separation between its extrema, as shown
in Figure 2. Similarly, the interfacial thickness t was also extracted as the distance between the neighboring extrema of thefirst and second derivatives (Figure 2).
GROMACS tools were used to obtain water density profiles, with a binning size for all systems of about 0.4 Å. In instances where the first derivative was showing two close maxima/ minima, the average value between the two peaks was chosen for the calculation of db.The distance between the phosphorus
atoms, db(P−P), was calculated using the FATSLIM
program.46
Electrical Membrane Thickness from MD Simulations. An analogous strategy to that described above was followed to compute the interfacial and bilayer thicknesses using information from the dielectric permittivity profile of the solvated bilayers; in particular, in this case, the topology of function (εzz− 1)/4πεzzwas used instead of that of the water
density profile to define db, dh, and t from the atomistic
simulations.
The dielectric permittivity profiles of the lipid bilayers were constructed using the methodology proposed by Stern and Feller,47 which we summarize briefly here. The calculation of the corresponding profiles is based on the evaluation of the components of the dielectric constant parallel and perpendic-ular to the bilayer surface according to the following expressions
ε∥= + π ⟨ ∥ ∥⟩
k T P z M
1 4
2 B ( ) (3)
Figure 1.Membrane simplified as a uniform slab model along the line of symmetry. (Left) Atomistic model. (Right) Simplified model. The definitions of the various thicknesses used in the article are shown here: hydrophobic atoms, yellow; polar headgroups, gray; and water molecules, blue.
Figure 2. Definitions of various thicknesses used from the relevant profile (water density (ρw) shown here). The extrema from the first
and second derivatives of the density are used to define the thicknesses, bilayer thickness (db), hydrophobic thickness (dh), and
interface thickness (t). To facilitate visualization, in the figure the quantities are scaled by an arbitrary prefactor.
ε πε − = ⟨ ⟩ − ⟨ ⟩⟨ ⟩ + π ⟨ − ⟨ ⟩ k T P z M P z M 1 4 1 ( ( ) ( ) ) 1 zz zz z z z z M M Vk T B 4 ( z2) z2) B (4)
where V is the volume,⟨ ⟩ indicates the ensemble average, kBis
the Boltzmann constant, T is the temperature, z is the direction perpendicular to the bilayer plane, and P(z) and M are the polarization density and total dipole moment vectors, respectively, which are defined as
∑
μ δ = Δ − A z z z P z( ) 1 ( ) i i i (5)∑
μ = M i i (6)where A is the cross-sectional area of the simulation box,Δz is the bin width, andμi is the dipole moment vector associated
with a bond i between two atoms. Equations 3and4 are the result of combining two different descriptions of the polarization and dipole moment vectors. Thus, combining their microscopic statistical mechanical description with the macroscopic continuum electrostatics one (where the dielec-tric tensor is defined as a proportionality constant) allows us to express the dielectric permittivity tensor in terms of the fluctuations in both vectors.45,47−51
Spatial polarization density profiles were evaluated by binning along the z direction, after computing the local dipole moments defined at the covalent bond midpoints according to the protocol described elsewhere.47All of the aforementioned quantities were computed by averaging over the MD trajectories. To this end, we used an in-house parallel implementation coded in Python 3 that includes calls to the MDTraj library52 to iteratively read the binary xtc files generated by GROMACS. The implementation is freely available and can be downloaded from GitHub: https:// github.com/vannilab/MemCap.
Notably, εzz presents big fluctuations and a low
signal-to-noise ratio; however, the functional form ineq 4, because of its nature, is smoother, so after appropriate denoising (see below), the topological features of this function can be unambiguously identified. For that reason, (εzz − 1)/4πεzz, termed the
dielectric function in the rest of the article, was used in this study instead ofεzz itself.
Noise Removal from the Dielectric Function. As mentioned above, our procedure requires the accurate determination of the topological properties of the first and second derivatives of the dielectric function to determine reliable membrane thicknesses. Consequently, prior to any analysis, the noise that still exists in this relatively rough function must be removed. To this end, we considered the noisy data to be the independent variable and built a generalized linear model in which cubic B-splines were used as regressors. Finding a unique solution (coefficients of the B-spline basis set) to this inverse problem requires solving the corresponding least-squares problem by imposing some kind of regularization. We used ridge regression,53 which imposes a penalty on the size of the B-spline coefficients. This involves minimizing the following penalized residual sum of squares
ω λ ω
||X − || + || ||y
min 22
2 2
where X is the design matrix, y is the independent variable (noisy data), ω are the B-spline coefficients, and λ is the regularization parameter required to avoid overfitting the data. We determined the value for λ via generalized cross validation.54
Relative Dielectric Determination from Linear Re-gression Fitting. The linear reRe-gression protocol used to determine the optimal value for the dielectric constant of the hydrophobic region, εh, was based on minimizing the mean
absolute error (MAE) between the computed and exper-imental membrane capacitances. Although other loss functions could have been used with a minimal influence on the optimal value of εh, we chose MAE as the loss and metric because it
provides a direct interpretation of the error. When nofitting was performed, a value ofεh= 2.0 was employed.
■
RESULTS AND DISCUSSIONEstimation of Bilayer Capacitance from Physical Properties. The origin of the discrepancies found between the bilayer thicknesses and dielectric constants that had to be assumed in previous experimental studies27,29tofit capacitance measurements is unknown and calls for further investigation. Although the conclusions from these experiments seem to indicate that the slab model captures with sufficient accuracy the physics underlying the process under study, the above-mentioned inconsistency questions some of the decisions that Figure 3. Comparison between experimental measurements of membrane capacitance from Garten et al.27 and predicted values using two definitions of bilayer thickness from atomistic MD trajectories using the slab model, namely, the water density profile and P−P distance. (Left) Capacitance derived usingεh= 2.0. (Right) Capacitance computed using best-fit relative dielectric constants. The dotted lines in green represent
the y = x line.
must be made for the application of this model to this kind of system, such as the manner in which membrane thickness is defined or the protocols used to calculate the dielectric permittivity and its different contributions. In this work, we explored the use of atomistic simulations as an alternative methodology to correlate bilayer thickness with membrane capacitance and to provide a molecular explanation for the validity of the slab model.
To this end, we performed MD simulations of various solvated lipid bilayers for which membrane capacitances have been experimentally measured in solvent-free bilayers,27 and from the corresponding trajectories, we evaluated the hydro-phobic thickness (dh) by averaging over all of the snapshots
extracted from the dynamics by using different strategies for dh
determination.
Two distinct approaches were initially considered. In the first one, we first estimated dbas the ensemble average of the
upper-to-lower distance between the phosphorus atoms belonging to the upper and lower lipid leaflets. In the second one, dbwas determined from the water density profile as the
distance between the extrema of its first derivative. In both cases, we relied on the topological properties of the first derivatives of the water density profile obtained from the MD simulations to compute the interfacial thickness. (See the Methodssection for further details.)
Remarkably, membrane capacitance values obtained from these measurements using εh = 2.0 for the relative dielectric
constant, a value that is generally accepted for nonpolar hydrocarbons,55 resulted in very poor agreement with experimental measurements of membrane capacitance (Figure 3a). Next, rather than assuming afixed value for εh, we sought
to estimate it by fitting the best value from the data using a linear regression model (Methods). This led to relatively high dielectric constants: εh≈ 2.61 (MAE = 0.03) for the former
approach and εh ≈ 2.47 (MAE = 0.03) for the latter one.
Taken together, these results indicate that, assuming the validity of the slab model in this scenario, both protocols lead to inadequate dhdefinitions.
Estimation of Bilayer Capacitance from Electrical Properties. To overcome these limitations, we sought to estimate dhdirectly from the electrical properties of the lipid
bilayer by calculating the bilayer dielectric profile from the fluctuations found in the polarization and dipole moment vectors along the MD trajectories.43,45,47 This approach is limited to uncharged molecules,47 but it is theoretically rigorous and can be applied to the investigation of the role of organic solvents, such as hexadecane and squalene, typically used in reconstitution studies.56 In addition, with the sole exception of one composition (DOPC/DOPS), all available capacitance measurements on solvent-free membranes have been performed on lipid bilayers constituted by noncharged lipids.27
The bilayer dielectric profile is shown in Figure 4 for a representative lipid composition (DOPC) together with its first and second derivatives.
Using the value estimated for dh from this profile, we
computed, in a parameter-free approach, the capacitance values directly fromeq 2using afixed value of εh= 2.0 for all of the
systems investigated. In Figure 5, we report the values of capacitances obtained using this approach. As clearly shown there, they show good agreement with the corresponding experimental values. Furthermore, the best fit for εh using a
linear regression model led to a value of εh = 2.01 that is
consistent with experimentally derived values for alkanes.25 Notably, the computed bilayer thicknesses dbshow a poor
match with the experimental data obtained from X-ray experiments (Table 2). This suggests that the “membrane capacitor thickness” of the bilayer is different from simply the physical thickness of the hydrocarbon chains, possibly as a result of molecular interactions arising in the lipid bilayer at the interface between the hydrophobic and hydrophilic regions.
Finally, although thickness and capacitance values computed via the various approaches described above correlate to varying degrees with the experimental values, it appears that the simple slab model is able to describe the underlying physics quite well. The molecular origin of such behavior is apparent fromFigure 4, where the dielectric profile in the direction perpendicular to the membrane surface resembles that of a low dielectric slab Figure 4.Dielectric function of a DOPC bilayer before ( f) and after ( fden) denoising in the direction perpendicular (z) to the membrane
surface shown together with its first and second derivatives. The extrema from the first (f′) and second derivatives (f″) of the dielectric function are used to define the thicknesses, bilayer thickness (db), hydrophobic thickness (dh), and interface thickness (t). To
facilitate visualization, in thefigure, the quantities are scaled by an arbitrary prefactor.
Figure 5.Capacitance values computed using the hydrophobic bilayer thickness from the dielectric profile in the z direction vs experimental values from Garten et al.27(The error bars are about the same size as the symbols.) The dotted line in green represents the y = x line.
submerged in water, with the dielectric function switching its value rather abruptly as we move from bulk water to the lipid bilayer. Remarkably, the switching between low and high values is significantly more gradual in the water density profile (Figure 2), further supporting why estimations of bilayer thickness from physical properties are unsatisfactory for the prediction of capacitance values.
Capacitance Measurements in Solvent-Rich Lipid Bilayers. In several reconstituted systems, membranes might contain residual synthetic or natural hydrophobic solvents (e.g., oils) as a result of the bilayer formation process. Measuring the oil concentration in this kind of systems is extremely challenging; therefore, an accurate theoretical determination of residual solvent based on the procedure outlined in this article could be of interest because no alternative approaches are currently available.
We thus decided to use our protocol to predict the solvent concentration from available membrane capacitance measure-ments. To do so, we computed the membrane capacitance from MD simulations of solvent-rich lipid bilayers at multiple solvent concentrations and subsequently used these data as calibration curves to identify the correct solvent concentration by comparing the predicted data with those from experiments (Figure 6). In particular, we focused on DOPC bilayers including various concentrations of squalene and hexadecane within the bilayer because these solvents are widely used in the formation of lipid membranes.29,59
Our theoretical results are summarized in Table 3 and Figure 6 and show that, as expected, the membrane thickens when increasing the oil concentration. As a consequence of membrane thickening, capacitance values decrease in the
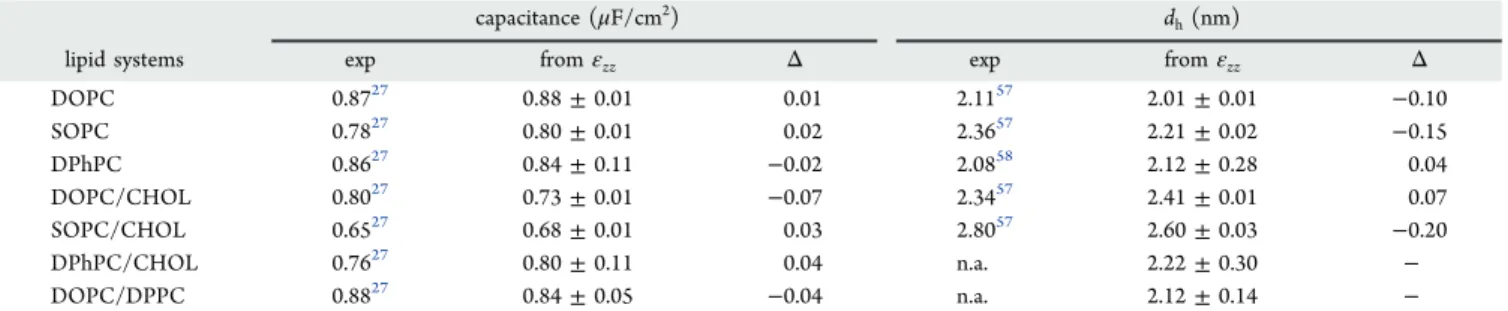
presence of solvents. This behavior is markedly different for different solvents, as was expected from the widely distinct measurements reported in the literature between squalene and hexadecane.29In detail, our approach predicts that the solvent-to-lipid concentration of squalene in reported experimental studies29 is below 10%, while hexadecane is present at concentrations slightly above 35%. Thus, our method suggests that lipid bilayers prepared with hexadecane, such as BLMs,14 DIBs,11and LAMBs,7might have physical properties that are Table 2. Capacitance Values, Hydrophobic Thicknesses Obtained from Experiments (exp), and the Dielectric Profiles (εzz) Are Presenteda
capacitance (μF/cm2) d
h(nm)
lipid systems exp fromεzz Δ exp fromεzz Δ
DOPC 0.8727 0.88± 0.01 0.01 2.1157 2.01± 0.01 −0.10 SOPC 0.7827 0.80± 0.01 0.02 2.3657 2.21± 0.02 −0.15 DPhPC 0.8627 0.84± 0.11 −0.02 2.0858 2.12± 0.28 0.04 DOPC/CHOL 0.8027 0.73± 0.01 −0.07 2.3457 2.41± 0.01 0.07 SOPC/CHOL 0.6527 0.68± 0.01 0.03 2.8057 2.60± 0.03 −0.20 DPhPC/CHOL 0.7627 0.80± 0.11 0.04 n.a. 2.22± 0.30 − DOPC/DPPC 0.8827 0.84± 0.05 −0.04 n.a. 2.12± 0.14 −
aFor the sake of comparison, all values are rounded to the second decimal even in the presence of larger errors.Δ is the difference between
computed and experimental values.
Figure 6.Capacitance measured for DOPC with oil solvents: squalene and hexadecane. The experimental values29(indicated in gray) can be used to infer the unknown oil concentration. The experimental capacitance of pure DOPC bilayers is 0.87μF/cm2(marked in green).
Table 3. Capacitances and Thicknesses Computed from MD Simulations of DOPC Bilayers in the Presence of Different Amounts of Squalene and Hexadecanea
oil fraction C (μF/cm2) d h(εzz) (nm) db(P−P) (nm) Hexadecane 0.00 0.88± 0.01 2.01± 0.01 3.89± 0.01 0.19 0.81± 0.01 2.18± 0.01 4.13± 0.01 0.32 0.72± 0.12 2.51± 0.43 4.38± 0.01 0.43 0.60± 0.01 2.93± 0.01 4.77± 0.02 0.50 0.58± 0.01 3.05± 0.01 5.11± 0.01 Squalene 0.00 0.88± 0.01 2.01± 0.01 3.89± 0.01 0.065 0.84± 0.01 2.10± 0.01 4.00± 0.01 0.1 0.84± 0.06 2.11± 0.15 4.07± 0.01 0.19 0.73± 0.08 2.44± 0.28 4.26± 0.01 0.32 0.61± 0.04 2.89± 0.17 4.78± 0.03
aThe bilayer thickness from P−P distances is shown as well.
Capacitance values were computed using the hydrophobic thickness estimated from the dielectric profile. For the sake of comparison, all values are rounded to the second decimal point even in the presence of larger errors.
significantly different from those of solvent-free lipid bilayers (e.g., the P−P distance as shown in Table 3). As such, our results indicate that data originating from these approaches must be interpreted with particular care for what pertains to membrane properties.
■
CONCLUSIONSIn this work, we present a methodology based on previous work by Stern and Feller47 to estimate the membrane capacitance of lipid bilayers from MD simulations. We observe a very good correlation between the capacitance values computed using our approach and recent measurements on solvent-free lipid bilayers.27This allows us to provide insights into the electrical properties of lipid bilayers and to propose a protocol, based on calibration curves, to estimate the amount of residual solvent based on capacitance measurements in reconstituted lipid bilayers.
We found that a textbook uniform slab approximation works well for bilayer membranes and that the hydrophobic thickness determined from X-ray measurements does not provide a good estimation of the membrane capacitor thickness.
Our methodology is limited to systems composed of uncharged molecules. As such, the approach we propose is not suited to the study of lipid bilayers in the presence of charged lipids or ions. The good correlation we observe between our computational results in the absence of ions and experimental capacitance measurements in the presence of physiological ion concentrations,27however, seems to suggest that bilayer capacitance does not originate from variations in charge distribution due to ions (that take place close to the bilayer surface) but rather is solely due to the low permittivity of the hydrophobic layer. In addition, potential artifacts may arise from a possible unsatisfactory description of ion− membrane interactions in nonpolarizable atomistic force fields.60
In order to include charged lipids and ions in the determination of membrane capacitance from MD simulations, we envision that alternative methodologies, possibly based on different electrical properties of lipid bilayers such as bilayer charge or electricfield,61,62will be required. However, the lack of further experimental data on charged lipid systems (only one lipid composition is currently available27) is a major roadblock in this direction.
The main motivation of this work was to be able to infer, in solvent-rich lipid bilayers, the solvent concentration based on capacitance measurements and, consequently, to investigate structural and physical properties of lipid bilayers in the presence of residual solvent molecules. In fact, several reconstitution approaches are not solvent-free, but they generally represent very convenient methodologies for the investigation of complex lipid bilayers, including asymmetric ones,63 in combination with proteins.64 However, to our knowledge, the exact determination of solvent concentration in such reconstituted systems is not currently possible, and the difference in capacitance measurements between solvent-rich and solvent-free lipid bilayers can vary from almost zero to up to more than 30%.27While the low end of this spectrum is in good agreement with NMR measurements on oil concen-tration in small unilamellar vesicles (SUV)65,66 and with coarse-grained MD simulations mimicking droplet−interface bilayers,67,68the concentration of solvent molecules in the high end of the spectrum (i.e., for capacitance values of around 0.6− 0.7μF/cm2are typical of alkanes (>10 carbons)19,69) remains
unknown. Using the methodology developed in this work, we have been able to estimate the mol/mol concentration of hexadecane in DOPC lipid bilayers at approximately 30%. Remarkably, this corresponds to a phosphate-to-phosphate thickness increase of 0.5 nm and an increase in the area per lipid from 0.67 (±0.01) to 0.71(±0.01) nm2 in comparison with solvent-free DOPC lipid bilayers.
In summary, our methodology provides a viable strategy for a better interpretation of the experimental results in solvent-rich lipid bilayers while concomitantly allowing for more informed experimental design. In particular, we foresee that our approach could be particularly useful in guiding the design of the optimal lipid composition for the incorporation of integral membrane proteins in reconstituted membranes given the importance of hydrophobic matching between lipid bilayers and integral membrane proteins.
■
ASSOCIATED CONTENT*
sı Supporting InformationThe Supporting Information is available free of charge at https://pubs.acs.org/doi/10.1021/acs.jpcb.0c03145.
Comparison between experimental measurements of hydrophobic thickness from X-ray experiments and predicted values using three definitions of bilayer thickness from atomistic MD trajectories using the slab model (PDF)
■
AUTHOR INFORMATIONCorresponding Author
Stefano Vanni − Chemin du Musée 10, Department of Biology, University of Fribourg, 1700 Fribourg, Switzerland;
orcid.org/0000-0003-2146-1140; Phone: +41 26 300 8896; Email:stefano.vanni@unifr.ch
Authors
Vikram Reddy Ardham − Chemin du Musée 10, Department of Biology, University of Fribourg, 1700 Fribourg, Switzerland Valeria Zoni − Chemin du Musée 10, Department of Biology,
University of Fribourg, 1700 Fribourg, Switzerland Sylvain Adamowicz − Chemin du Musée 10, Department of
Biology, University of Fribourg, 1700 Fribourg, Switzerland Pablo Campomanes − Chemin du Musée 10, Department of
Biology, University of Fribourg, 1700 Fribourg, Switzerland Complete contact information is available at:
https://pubs.acs.org/10.1021/acs.jpcb.0c03145 Notes
The authors declare no competingfinancial interest.
■
ACKNOWLEDGMENTSThis work was supported by the Swiss National Science Foundation (grant PP00P3_163966) and by grants from the Swiss National Supercomputing Centre (CSCS) under project IDs s726 and s842. We acknowledge PRACE for awarding us access to Piz Daint, ETH Zurich/CSCS, Switzerland. S.V. and P.C. acknowledge support from the Novartis Foundation for Medical-Biological Research (17C139). S.V. and S.A. acknowl-edge support from the NCCR for Bioinspired Materials (51NF40-182881) for the summer internship program.
■
REFERENCES(1) Escribá, P. V.; González-Ros, J. M.; Goñi, F. M.; Kinnunen, P. K. J.; Vigh, L.; Sánchez-Magraner, L.; Fernández, A. M.; Busquets, X.; Horváth, I.; Barceló-Coblijn, G. Membranes: A Meeting Point for Lipids, Proteins and Therapies: Translational Medicine. J. Cell. Mol. Med. 2008, 12 (3), 829−875.
(2) van Meer, G.; Voelker, D. R.; Feigenson, G. W. Membrane Lipids: Where They Are and How They Behave. Nat. Rev. Mol. Cell Biol. 2008, 9 (2), 112−124.
(3) Cheng, X.; Smith, J. C. Biological Membrane Organization and Cellular Signaling. Chem. Rev. 2019, 119 (9), 5849−5880.
(4) Watson, H. Biological Membranes. Essays Biochem. 2015, 59, 43−70.
(5) Lee, A. G. Biological Membranes: The Importance of Molecular Detail. Trends Biochem. Sci. 2011, 36 (9), 493−500.
(6) Harayama, T.; Riezman, H. Understanding the Diversity of Membrane Lipid Composition. Nat. Rev. Mol. Cell Biol. 2018, 19 (5), 281−296.
(7) Beltramo, P. J.; Van Hooghten, R.; Vermant, J. Millimeter-Area, Free Standing, Phospholipid Bilayers. Soft Matter 2016, 12 (19), 4324−4331.
(8) Seddon, A. M.; Curnow, P.; Booth, P. J. Membrane Proteins, Lipids and Detergents: Not Just a Soap Opera. Biochim. Biophys. Acta, Biomembr. 2004, 1666 (1−2), 105−117.
(9) Ritchie, T. K.; Grinkova, Y. V.; Bayburt, T. H.; Denisov, I. G.; Zolnerciks, J. K.; Atkins, W. M.; Sligar, S. G. Reconstitution of Membrane Proteins in Phospholipid Bilayer Nanodiscs. Methods Enzymol. 2009, 464 (C), 211−231.
(10) Richter, R. P.; Bérat, R.; Brisson, A. R. Formation of Solid-Supported Lipid Bilayers: An Integrated View. Langmuir 2006, 22 (8), 3497−3505.
(11) Bayley, H.; Cronin, B.; Heron, A.; Holden, M. A.; Hwang, W. L.; Syeda, R.; Thompson, J.; Wallace, M. Droplet Interface Bilayers. Mol. BioSyst. 2008, 4 (12), 1191−1208.
(12) Castellana, E. T.; Cremer, P. S. Solid Supported Lipid Bilayers: From Biophysical Studies to Sensor Design. Surf. Sci. Rep. 2006, 61 (10), 429−444.
(13) Mueller, P.; Rudin, D. O.; Ti Tien, H.; Wescott, W. C. Reconstitution of Cell Membrane Structure in Vitro and Its Transformation into an Excitable System. Nature 1962, 194 (4832), 979−980.
(14) Papahadjopoulos, D. Bilayer Lipid Membranes (BLM): Theory and Practice By H. Ti Tien. Perspect. Biol. Med. 1975, 18 (4), 575− 577.
(15) Sharpe, H. J.; Stevens, T. J.; Munro, S. A Comprehensive Comparison of Transmembrane Domains Reveals Organelle-Specific Properties. Cell 2010, 142 (1), 158−169.
(16) Clay, L.; Caudron, F.; Denoth-Lippuner, A.; Boettcher, B.; Frei, S. B.; Snapp, E. L.; Barral, Y. A Sphingolipid-Dependent Diffusion Barrier Confines ER Stress to the Yeast Mother Cell eLife 2014, 3,
DOI: 10.7554/eLife.01883.
(17) White, S. H. Phase Transitions in Planar Bilayer Membranes. Biophys. J. 1975, 15 (2), 95−117.
(18) Taylor, G. J.; Venkatesan, G. A.; Collier, C. P.; Sarles, S. A. Direct in Situ Measurement of Specific Capacitance, Monolayer Tension, and Bilayer Tension in a Droplet Interface Bilayer. Soft Matter 2015, 11 (38), 7592−7605.
(19) Gross, L. C. M.; Heron, A. J.; Baca, S. C.; Wallace, M. I. Determining Membrane Capacitance by Dynamic Control of Droplet Interface Bilayer Area. Langmuir 2011, 27 (23), 14335−14342.
(20) Nagle, J. F.; Tristram-Nagle, S. Structure of Lipid Bilayers. Biochim. Biophys. Acta, Rev. Biomembr. 2000, 1469 (3), 159−195.
(21) Wesołowska, O.; Michalak, K.; Maniewska, J.; Hendrich, A. B. Giant Unilamellar Vesicles - a Perfect Tool to Visualize Phase Separation and Lipid Rafts in Model Systems. Acta Biochim. Polym. 2009, 56 (1), 33−39.
(22) Everitt, C. T.; Haydon, D. A. Electrical Capacitance of a Lipid Membrane Separating Two Aqueous Phases. J. Theor. Biol. 1968, 18 (3), 371−379.
(23) Gramse, G.; Dols-Perez, A.; Edwards, M. A.; Fumagalli, L.; Gomila, G. Nanoscale Measurement of the Dielectric Constant of Supported Lipid Bilayers in Aqueous Solutions with Electrostatic Force Microscopy. Biophys. J. 2013, 104 (6), 1257−1262.
(24) Raudino, A.; Mauzerall, D. Dielectric Properties of the Polar Head Group Region of Zwitterionic Lipid Bilayers. Biophys. J. 1986, 50 (3), 441−449.
(25) Panuganti, S. R.; Wang, F.; Chapman, W. G.; Vargas, F. M. A Simple Method for Estimation of Dielectric Constants and Polar-izabilities of Nonpolar and Slightly Polar Hydrocarbons. Int. J. Thermophys. 2016, 37 (7), 75.
(26) Scaife, W. G. The Relative Permittivity of the n Alkanes from n Pentane to n Decane as a Function of Pressure and Temperature. J. Phys. A: Gen. Phys. 1972, 5 (6), 897−903.
(27) Garten, M.; Mosgaard, L. D.; Bornschlögl, T.; Dieudonné, S.; Bassereau, P.; Toombes, G. E. S. Whole-GUV Patch-Clamping. Proc. Natl. Acad. Sci. U. S. A. 2017, 114 (2), 328−333.
(28) Lewis, B. A.; Engelman, D. M. Lipid Bilayer Thickness Varies Linearly with Acyl Chain Length in Fluid Phosphatidylcholine Vesicles. J. Mol. Biol. 1983, 166 (2), 211−217.
(29) Beltramo, P. J.; Scheidegger, L.; Vermant, J. Toward Realistic Large-Area Cell Membrane Mimics: Excluding Oil, Controlling Composition, and Including Ion Channels. Langmuir 2018, 34 (20), 5880−5888.
(30) Berendsen, H. J. C.; van der Spoel, D.; van Drunen, R. GROMACS: A Message-Passing Parallel Molecular Dynamics Implementation. Comput. Phys. Commun. 1995, 91 (1−3), 43−56.
(31) Van Der Spoel, D.; Lindahl, E.; Hess, B.; Groenhof, G.; Mark, A. E.; Berendsen, H. J. C. GROMACS: Fast, Flexible, and Free. J. Comput. Chem. 2005, 26 (16), 1701−1718.
(32) Jo, S.; Kim, T.; Im, W. Automated Builder and Database of Protein/Membrane Complexes for Molecular Dynamics Simulations. PLoS One 2007, 2 (9), e880.
(33) Huang, J.; Rauscher, S.; Nawrocki, G.; Ran, T.; Feig, M.; De Groot, B. L.; Grubmüller, H.; MacKerell, A. D. CHARMM36m: An Improved Force Field for Folded and Intrinsically Disordered Proteins. Nat. Methods 2017, 14 (1), 71−73.
(34) MacKerell, A. D.; Bashford, D.; Bellott, M.; Dunbrack, R. L.; Evanseck, J. D.; Field, M. J.; Fischer, S.; Gao, J.; Guo, H.; Ha, S.; Joseph-McCarthy, D.; et al. All-Atom Empirical Potential for Molecular Modeling and Dynamics Studies of Proteins. J. Phys. Chem. B 1998, 102 (18), 3586−3616.
(35) Darden, T.; York, D.; Pedersen, L. Particle Mesh Ewald: An N· log(N) Method for Ewald Sums in Large Systems. J. Chem. Phys. 1993, 98 (12), 10089−10092.
(36) Hess, B.; Bekker, H.; Berendsen, H. J. C.; Fraaije, J. G. E. M. LINCS: A Linear Constraint Solver for Molecular Simulations. J. Comput. Chem. 1997, 18 (12), 1463−1472.
(37) Miyamoto, S.; Kollman, P. A. Settle: An Analytical Version of the SHAKE and RATTLE Algorithm for Rigid Water Models. J. Comput. Chem. 1992, 13 (8), 952−962.
(38) Evans, D. J.; Holian, B. L. The Nose-Hoover Thermostat. J. Chem. Phys. 1985, 83 (8), 4069−4074.
(39) Parrinello, M.; Rahman, A. Polymorphic Transitions in Single Crystals: A New Molecular Dynamics Method. J. Appl. Phys. 1981, 52 (12), 7182−7190.
(40) Tajkhorshid, E. MD Simulation of the integral purple membrane of H. Salinarum http://www.ks.uiuc.edu/~emad/emad_ pm.htmlhttp://www.ks.uiuc.edu/~emad/emad_pm.html.
(41) Vermaas, J. V.; Hardy, D. J.; Stone, J. E.; Tajkhorshid, E.; Kohlmeyer, A. TopoGromacs: Automated Topology Conversion from CHARMM to GROMACS within VMD. J. Chem. Inf. Model. 2016, 56 (6), 1112−1116.
(42) Scopes, R. K. Protein Purificaton: Principles and Practices; Springer Verlag: New York, 1984.
(43) Kornyshev, A. A.; Schmickler, W.; Vorotyntsev, M. A. Nonlocal Electrostatic Approach to the Problem of a Double Layer at a Metal-Electrolyte Interface. Phys. Rev. B: Condens. Matter Mater. Phys. 1982, 25 (8), 5244−5256.
(44) Kornyshev, A. A.; Vorotyntsev, M. A. Nonlocal Dielectric Response of the Electrode/Solvent Interface in the Double Layer Problem. Can. J. Chem. 1981, 59 (13), 2031−2042.
(45) Bonthuis, D. J.; Gekle, S.; Netz, R. R. Dielectric Profile of Interfacial Water and Its Effect on Double-Layer Capacitance. Phys. Rev. Lett. 2011, 107 (16), 166102.
(46) Buchoux, S. FATSLiM: A Fast and Robust Software to Analyze MD Simulations of Membranes. Bioinformatics 2017, 33 (1), 133− 134.
(47) Stern, H. A.; Feller, S. E. Calculation of the Dielectric Permittivity Profile for a Nonuniform System: Application to a Lipid Bilayer Simulation. J. Chem. Phys. 2003, 118 (7), 3401−3412.
(48) Zhou, F.; Schulten, K. Molecular Dynamics Study of a Membrane - Water Interface. J. Phys. Chem. 1995, 99 (7), 2194− 2207.
(49) Ballenegger, V.; Hansen, J. P. Dielectric Permittivity Profiles of Confined Polar Fluids. J. Chem. Phys. 2005, 122 (11), 114711.
(50) Nymeyer, H.; Zhou, H. X. A Method to Determine Dielectric Constants in Nonhomogeneous Systems: Application to Biological Membranes. Biophys. J. 2008, 94 (4), 1185−1193.
(51) Shushkov, P. G.; Tzvetanov, S. A.; Ivanova, A. N.; Tadjer, A. V. Dielectric Properties Tangential to the Interface in Model Insoluble Monolayers: Theoretical Assessment. Langmuir 2008, 24 (9), 4615− 4624.
(52) McGibbon, R. T.; Beauchamp, K. A.; Harrigan, M. P.; Klein, C.; Swails, J. M.; Hernández, C. X.; Schwantes, C. R.; Wang, L. P.; Lane, T. J.; Pande, V. S. MDTraj: A Modern Open Library for the Analysis of Molecular Dynamics Trajectories. Biophys. J. 2015, 109 (8), 1528−1532.
(53) Hoerl, A. E.; Kennard, R. W. Ridge Regression: Biased Estimation for Nonorthogonal Problems. Technometrics 1970, 12 (1), 55−67.
(54) Golub, G. H.; Heath, M.; Wahba, G. Generalized Cross-Validation as a Method for Choosing a Good Ridge Parameter. Technometrics 1979, 21 (2), 215.
(55) P, D. Book Review: CRC Handbook of Chemistry and Physics. J. Mol. Struct. 1992, 268 (1−3), 320.
(56) Beltramo, P. J.; Van Hooghten, R.; Vermant, J. Millimeter-Area, Free Standing, Phospholipid Bilayers. Soft Matter 2016, 12 (19), 4324−4331.
(57) Pan, J.; Mills, T. T.; Tristram-Nagle, S.; Nagle, J. F. Cholesterol Perturbs Lipid Bilayers Nonuniversally. Phys. Rev. Lett. 2008, 100 (19), 198103.
(58) Tristram-Nagle, S.; Kim, D. J.; Akhunzada, N.; Kuerka, N.; Mathai, J. C.; Katsaras, J.; Zeidel, M.; Nagle, J. F. Structure and Water Permeability of Fully Hydrated DiphytanoylPC. Chem. Phys. Lipids 2010, 163 (6), 630−637.
(59) Andersen, O. S.; Koeppe, R. E. Bilayer Thickness and Membrane Protein Function: An Energetic Perspective. Annu. Rev. Biophys. Biomol. Struct. 2007, 36, 107−130.
(60) Melcr, J.; Martinez-Seara, H.; Nencini, R.; Kolafa, J.; Jungwirth, P.; Ollila, O. H. S. Accurate Binding of Sodium and Calcium to a POPC Bilayer by Effective Inclusion of Electronic Polarization. J. Phys. Chem. B 2018, 122 (16), 4546−4557.
(61) Ding, W.; Palaiokostas, M.; Wang, W.; Orsi, M. Effects of Lipid Composition on Bilayer Membranes Quantified by All-Atom Molecular Dynamics. J. Phys. Chem. B 2015, 119 (49), 15263−15274. (62) Melcr, J.; Bonhenry, D.; Timr, Š.; Jungwirth, P. Trans-membrane Potential Modeling: Comparison between Methods of Constant Electric Field and Ion Imbalance. J. Chem. Theory Comput. 2016, 12 (5), 2418−2425.
(63) Marquardt, D.; Geier, B.; Pabst, G. Asymmetric Lipid Membranes: Towards More Realistic Model Systems. Membranes (Basel, Switz.) 2015, 5 (2), 180−196.
(64) Shen, H. H.; Lithgow, T.; Martin, L. L. Reconstitution of Membrane Proteins into Model Membranes: Seeking Better Ways to Retain Protein Activities. Int. J. Mol. Sci. 2013, 14 (1), 1589−1607.
(65) Hamilton, J. A.; Vural, J. M.; Carpentier, Y. A.; Deckelbaum, R. J. Incorporation of Medium Chain Triacylglycerols into Phospholipid
Bilayers: Effect of Long Chain Triacylglycerols, Cholesterol, and Cholesteryl Esters. J. Lipid Res. 1996, 37 (4), 773−782.
(66) Kamp, F.; Westerhoff, H. V.; Hamilton, J. A. Movement of Fatty Acids, Fatty Acid Analogues, and Bile Acids across Phospholipid Bilayers. Biochemistry 1993, 32 (41), 11074−11085.
(67) Zoni, V.; Campomanes, P.; Khaddaj, R.; Thiam, A. R.; Schneiter, R.; Vanni, S. Lipid Droplet Biogenesis Is a Liquid Phase Separation Spatially Regulated by Seipin and Membrane Curvature. bioRxiv 2019, 777466.
(68) Ben M'barek, K.; Ajjaji, D.; Chorlay, A.; Vanni, S.; Foret, L.; Thiam, A. R. ER Membrane Phospholipids and Surface Tension Control Cellular Lipid Droplet Formation. Dev. Cell 2017, 41, 591− 604.
(69) Bartlett, P. N. Bioelectrochemistry: Fundamentals, Experimental Techniques and Applications; John Wiley & Sons, 2008.