Antiperovskite Crystal Growth by Stephanie L. Eiler Submitted to the
Department of Materials Science and Engineering in Partial Fulfillment of the Requirements for the Degree of
Bachelor of Science
at the
Massachusetts Institute of Technology
June 2019
© 2019 Stephanie L. Eiler All rights reserved
The author hereby grants to MIT permission to reproduce and to distribute publicly paper and electronic copies of this these document in whole or in part in any medium now known or
hereafter created.
Signature of Author……… Department of Materials Science & Engineering
April 26, 2019
Certified by……… Yet-Ming Chiang Kyocera Professor of Materials Science & Engineering
Accepted by………... Juejun Hu Associate Professor of Materials Science & Engineering Chairman, Undergraduate Committee
2
Antiperovskite Crystal Growth By
Stephanie L. Eiler
Submitted to the Department of Materials Science and Engineering on April 26, 2019, in partial fulfillment of the
requirements for the degree of
Bachelor of Science in Materials Science and Engineering
Abstract
Research towards the implementation of solid state electrolyte in lithium ion batteries is necessary to increase the energy density of such devices. This technology is imperative for the adoption of sustainable technology such as electric vehicles. The study of antiperovskites is vital for success of solid state electrolyte. Antiperovskites have been shown to have high ionic conductivities in literature, making it an attractive area of study. Single crystals of this structure are necessary to fully identify the mechanism of ion conduction in antiperovskite. X-ray photon correlation spectroscopy on a single crystal would provide clear data that could help determine the mobility of various defects through the antiperovskite lattice. Characterization of defect mobility would allow for the better design of antiperovskites as a solid state electrolyte by providing parameters for how the material can be altered for higher ionic conductivity.
Experiments show that Li2OHCl is an antiperovskite possibly capable of congruent melting,
making it a possible candidate for single crystal growth through the Bridgman method. With this rational, the PARADIM Bulk Crystal Growth Facilities at Johns Hopkins University were utilized to attempt this type of crystal growth. Additional crystal growth experiments were conducted by simply slowly cooling the material in box furnaces with the notion that this would promote large grain growth. Samples created using these methods were examined using optical microscopy and Laue diffraction. Crystals grown in PARADIM Bridgman furnaces were shown to have some grains that are roughly two mm across. From these attempts at crystal growth, recommendations for improved Li2OHCl crystal growth have been identified. Phase transformations in the material
presented clear challenges in crystal growth by offering an opportunity for twinning to occur in the crystal as it cooled. In addition to this, the volume change during solidification and the thermal coefficient of expansion was such that very slow cooling rates would be necessary for single crystal growth.
Thesis Advisor: Yet-Ming Chiang
3 Acknowledgements
I would firstly like to thank my thesis advisor, Professor Yet-Ming Chiang, for providing me guidance on this thesis and for granting me so many research opportunities in his group as an undergraduate. I cannot imagine my undergraduate experience without being a part of the Chiang group. I have learned and grown so much from all of my UROP projects and this thesis.
I would also like to thank Dr. Fei Wang, Dr. Ping-Chun Tsai, and Yiliang Li for assisting me on my research. They have provided much needed support and answered many questions on how to carry out lab work for this project.
For his assistance with gathering Laue diffraction, I would like to thank Dr. Charlie Settens. I would finally like to thank Professor Tyrell McQueen and Dr. Adam Phelan for their guidance on how to conduct bulk crystal growth at the PARADIM facilities at Johns Hopkins University.
4
Table of Contents
1 Introduction………...………5
2 Background………...7
2.1 Antiperovskites………7
2.2 Bridgman Growth Method………...9
2.3 Laue Diffraction……….10
3 Methods………...13
3.1 Li2OHCl Synthesis……….13
3.2 X-Ray Diffraction………..14
3.3 Differential Scanning Calorimetry……….14
3.4 Slow Cooling Crystal Growth………15
3.5 Bridgman Crystal Growth………..18
3.6 Optical Microscopy………22
3.7 Laue Diffraction……….25
4 Results and Discussion………...25
4.1 Validation of Li2OHCl………...25
4.2 Confirmation of Congruent Melting………..…28
4.3 Bridgman Growth Methods………...33
4.4 Optical Microscopy………39
4.5 Laue Diffraction……….40
4.6 Future Work………...43
5 Conclusion………..44
5 1 Introduction
Previous studies have shown limited success in the synthesis and characterization of antiperovskites, leaving a gap in knowledge of how easily materials of this structure can conduct ions and how these properties are affected by the symmetry and distribution of defects in these materials [1, 2]. Tracking of these properties in connection to non-Arrhenius ionic conduction behavior in antiperovskites has not been sufficiently studied to provide a scientific and theoretical foundation for further design of these materials. Lithium-based antiperovskites have shown promise as ionic conductors as they show a large voltage stability window and chemical stability in conjunction with lithium metal along with acceptable ionic conductivity, inspiring investigations into their alkali metal counterparts [2-5]. Systematic study of multiple antiperovskite compositions will optimize scientific theory and provide a basis for further study.
This class of materials maybe effective for the use as solid state electrolyte in batteries, making it a practical area of study. Study of a single crystal of an antiperovskite could provide insight into its structure and distribution of defects within the lattice. The movement of defects is thought to be main mechanism for the transport for ions within an antiperovskite solid state electrolyte. For lithium-based antiperovskites, the differences in mobility of various forms of defects, such as alkali ion vacancies and interstitials, is debated and is considered to be a vital area of study in order to influence the design of future materials as a solid state electrolyte [4, 5]. A single crystal would be necessary for X-ray photon correlation spectroscopy (XPCS) measurements. XPCS would provide information on structure changes through the crystal on a similar time scale to that of defects moving through the lattice, making it a technique that should be pursued. This has been performed on other electrolytes in order to better understand ion
6
transport mechanisms [6]. Other characterization techniques can be carried out on such crystals with fascinating results due to the lack of grain boundaries.
With this reasoning, I have pursued the synthesis of a single crystal of an antiperovskite. Li2OHCl was previously synthesized by members of the Chiang group. This antiperovskite
structure was confirmed in our samples using x-ray diffraction (XRD) and compared to patterns in literature. Experiments proved that Li2OHCl possibly melts congruently, making it a prime
candidate for growing a single crystal of this material through the Bridgman method. Experiments were conducted in order to determine a suitable crucible material. Differential scanning calorimetry (DSC) was used to precisely determine the melting temperature of the material and confirm the congruent melting behavior. Simplified crystal growth experiments involving melting Li2OHCl and then slow cooling the melt in a box furnace with a natural temperature gradient to
spur the growth of larger grains were also conducted. In pursuit of the Bridgman method, I gained access to Bridgman furnaces at the Platform for the Accelerated Realization, Analysis, & Discovery of Interface Materials (PARADIM) facilities at Johns Hopkins University. At the PARADIM facilities, single crystal growth was attempted three times with a laser diode floating zone furnace. Samples from these crystal growth attempts were analyzed using Laue diffraction in order to determine the success of these methods. Large domains were formed in one sample, providing evidence of progress towards a method for antiperovskite single crystal growth. From these results, improvements to the single crystal growth process for this compound and other antiperovskites can be recommended.
7 2 Background
2.1 Antiperovskites
In the antiperovskite lattice, the locations of the anions and cations in a perovskite are reversed. Anti-perovskites have the general composition X3AB, where X is an alkali ion (Li, Na,
K), A is the smaller of two anions (typically O, S or Se) and B is a larger anion such as a halogen (F, Br, Cl, I) or cluster anion (BH4, NO2), are of interest as potential fast-ion conductors for solid
state batteries. Figure 1, below, depicts this structure using Li3OCl, a compound similar to
Li2OHCl where crystal growth was focused within this thesis. The structural variations that occur
as the three main constituent ions vary, and the resulting effects on ionic conductivity and other material characteristics have yet to be fully understood. Lithium-based antiperovskites have shown promise as solid electrolytes for solid-state batteries since, in addition to superionic conduction, they show a large voltage stability window and chemical stability in contact with lithium metal [2-5]. Study of an antiperovskite composition, as is planned within this project, will lead to new understanding of this general class of compounds.
Figure 1. Atomic structure of the antiperovskite, Li3OCl. The alkali ion, Li, is located at the octahedral vertices. The smaller anion, O, is located at the octahedral center. Finally, the larger anion, Cl, is located at the cube vertices. [7]
8
Li2OHCl is an example of an antiperovskite. Figure 2, below, exhibits representations of
the different ion distributions for this ceramic. Study of this material has been limited, but literature suggests two antiperovskite phases of different crystal symmetry depending on temperature. Using computational methods, Howard, Hood, and Holzwarth showed the potential phases of Li2OHCl
to be tetragonal and orthorhombic [8]. Experimentally, the phases of Li2OHCl was found to be
cubic and orthorhombic. XRD patterns were outlined in this paper from computational methods, allowing for the identification of this material in real life. Due to the low X-ray scattering factor of hydrogen and lithium, XRD will be incapable of fully determining the structure of Li2OHCl.
Neutron diffraction would be necessary to truly solve for Li2OHCl’s structure.
Figure 2. (a) A proposed structure of the cubic phase of the Li2OHCl, one of the two phases found
9 2.2 Bridgman Growth Method
Bridgman crystal growth is a method useful for growing single crystals. The lack of grain boundaries allows for unique characterization techniques and measurements, making methods for single crystal growth important across many fields.
In Bridgman crystal growth, polycrystalline charge material is loaded into an ampoule or crucible with a narrow, pointed tip. The ampoule is then loaded into a Bridgman furnace where the temperature gradient of the charge material can be precisely controlled. Congruent melting of the target material is required for the Bridgman method to work, like any other method that involves direct solidification of the crystal from the melt. The charge material is slowly melted in a controlled temperature gradient beginning from the bottom point of the crucible and moving towards the top. The narrow point of the crucible and controlled temperature gradient would assist in the formation of only one nucleation site. Crystal growth would then occur in the direction of that the material is solidified. In a successful single crystal growth attempt, the melt will solidify by directionally growing the single crystal rather than forming new nucleation sites and then creating new grains. Figure 3 shows a schematic of this technique.
10
Figure 3. Schematic of a Bridgman furnace with an ampoule inside. The ampoule is lowered through a heat zone. The melt will begin to crystallize at the bottom of the ampoule as it moves farther from the hottest region in the furnace. The crystal will grow upwards. [9]
2.3 Laue Diffraction
Laue diffraction is a form of X-ray diffraction that is typically used for assessing the quality and orientation of single crystals. In this type of XRD, an X-ray beam is aimed at a sample and then either passes through the crystal or is reflected back at an angle [10]. The reflected X-rays are detected and its location on the detector is recorded. This method requires a detector that can either measure over a large area while the crystal is held at a stationary position or be swept over a large area while the crystal is being rotated. By analyzing the angle of reflected beams in relation to the location of the inputted beam and the detector, we can determine the orientation of a single crystal. The symmetry of reflected X-rays and the reflection angle with the crystal are used to determine the orientation of the crystal by the calculation of Laue angles. Equation 1, below, shows
11 how to calculate the angle that the X-rays will be diffracted at derived from the interacting crystallographic planes [10]. Here, θ is the angle that is formed between the planes and the reflecting angle of the X-ray beam. H, k, and l correspond to the crystallographic planes in (hkl) nomenclature. By determining this value, we are able to identify the location where the diffracted Laue beam will fall on the detector as long as we know the distance between the detector and the sample. Analyzing the position of all the diffracted beams will yield information on how the single crystal being measured is oriented. A diagram to show the diffraction of the Laue beam is shown in Figure 4.
(1)
Figure 4. Example diagram of Laue diffraction on a simple cubic crystal. Θ, the angle between the (201) planes and the incoming beam is 26.6⁰. Experimentally, the Laue beam diffracts off of various planes and is detected as different spots on the eventually collected image. This only represents an interaction with one plane. [10]
12
In addition to being able to determine the location of reflected beams in relation to the detected area, the Laue wavelength can be calculated to provide the distance between crystallographic planes in the lattice structure. This is based off of the Bragg condition typically utilized in XRD. For example, equation 2 shows the equation to determine this for a simple cubic lattice [10]. Here, a is the lattice parameter, and d is the distance between planes.
(2)
Figure 5 shows the result of Laue diffraction on a single crystal. Each spot corresponds to an angle of X-ray reflection with a plane in the crystal lattice. The symmetry of the spots can also lead to clues on the orientation of the crystal. If the sample undergoing Laue diffraction is not a single crystal, then a pattern of clear spots will not be shown. Instead, the detector will show a cloud of detected X-ray beams as the differently oriented grains will reflect the beams in an unorganized manner. Due to this, Laue diffraction can be used to evaluate the quality of single crystals, making it a useful technique for this study.
13 Figure 5. Example of Laue diffraction on a single crystal of ammonium oxalate monohydrate. Clear points are seen due to Laue refraction [11].
3 Methods
3.1 Li2OHCl Synthesis
Li2OHCl was synthesized using the following procedure. Alfa Aesar 99% anhydrous LiCl
and Alfa Aesar 98% anhydrous LiOH were placed in a small plastic vial at a molar ratio of 1:1.05 under an argon environment in a glove box. This ratio was selected due to repeated synthesis attempts revealing unconsumed LiCl in the ceramic after synthesis. Four large zirconia balls and two small zirconia balls were placed in the vial. The vial was sealed using Teflon tape wrapped around the threads for the cap, electrical tape tightly wrapped around the gap between the cap and the vial, and Parafilm wrapped to cover the top and the bottom of the electrical tape. This was done
14
to protect the powder mixture from hydration as Li2OHCl is a water sensitive compound. The vial
was removed from the glovebox and secured in a SPEX SamplePrep Mixer/Mill 800M. The powder was ball milled for three 30 minute periods with 15 minute cooling periods in between. The powder was then pressed into pellets with a half inch diameter and a mass of roughly 0.5 grams. Approximately 1.5 g of pellets were placed in an alumina crucible and heated to 320 ⁰C for 24 hours in a Thermolyne 1300 Furnace in each batch of Li2OHCl. The pellets melt during
synthesis. Li2OHCl was scraped out of the crucibles using a VWR stainless steel spatula.
3.2 X-Ray Diffraction
Due to the water sensitive nature of Li2OHCl, a special holder was used with an
interlocking zero background dome to prevent exposure to water. X-ray diffraction (XRD) was carried out with a Panalytical X’Pert Pro at MIT and a Bruker D8 Focus at the PARADIM facilities at JHU. Highscore Plus software and the 2019 International Centre for Diffraction Data database were utilized to interpret x-ray diffraction data.
3.3 Differential Scanning Calorimetry
Differential scanning calorimetry (DSC) was conducted using a Mettler Toledo TGA/DSC. The sweep went from 50 C to 320 ⁰C at a rate of 5 ⁰C per minute. The temperature was held at 320 ⁰C for 20 minutes before ramping down to 50 ⁰C at the same rate. This heating procedure was first conducted with an empty alumina crucible in order to subtract the thermal effects of the crucible from the collected data. 9.64 milligrams of Li2OHCl were placed in an identical crucible and had
15 Figure 6. Graphical representation of the temperature procedure that was used on DSC samples.
3.4 Slow Cooling Crystal Growth
An aluminum crucible was constructed out of aluminum foil. In order to protect the Li2OHCl compound from water, the aluminum crucible was placed and sealed in a large Swagelok
cell with caps on the ends in a glovebox with water and oxygen levels below 0.1 ppm. Figure 7 shows a schematic of this method. 0.76 grams of Li2OHCl was placed in the crucible within the
Swagelok cell and then taken out of the glove box. Attempts at crystal growth were made using a Thermolyne 47900 box furnace outside of a glove box and in air atmosphere. In the furnace, the cell was heated up to 310 ⁰C over 2 hours. The cell was held at this temperature for one hour. The cell was then cooled to room temperature over 48 hours, at a rate of roughly 5.83 ⁰C per hour.
16
Figure 7. Schematic depicting the placement of the aluminum crucible within a Swagelok cell in to seal Li2OHCl from water in an air atmosphere.
Figure 8. Photograph of the first slow cooling crystal. A small amount of aluminum foil is attached back of the crystal. Due to the rough shape of the aluminum foil crucible, the crystal was of an irregular shape.
17 An additional slow crystal growth attempt was made using the same box furnace, aluminum crucible, and Swagelok cell set up but with a different temperature procedure. In this attempt, the sample was brought to 310 ⁰C from room temperature over one hour. The furnace was held at 310 ⁰C for two hours. The sample was then cooled to 275 ⁰C from 310 ⁰C at a rate of 1 ⁰C per hour. Finally, the furnace cooled back to room temperature from 275 ⁰C over 20 hours. Upon opening the Swagelok cell within a glove box, it was evident that the melt had leaked out of the constructed aluminum foil crucible. The melt had collected and solidified in the bottom cap of the Swagelok cell. Figure 9 shows an image of the solidified sample that was grown. This sample was removed and characterized. The sample was easily removed from the Swagelok cap by pulling it out.
18
3.5 Bridgman Crystal Growth
Bridgman crystal growth experiments were conducted at the PARADIM crystal growth facilities at Johns Hopkins University. A tilting laser diode optical floating zone furnace (Tilt-LDFZ) was utilized in order to perform Bridgman crystal growth at relatively low temperatures. This furnace operated by aiming GaAs laser diodes with an operating center wavelength of 975 nm at a graphite sleeve. The graphite sleeve would absorb the light produced by the lasers and begin to heat up. The power of the lasers would be adjusted reach a desired temperature based off of readings from an infrared thermometer.
Custom made silver crucibles from Stanford Advanced Materials were filled with Li2OHCl
powder as a charging material. The powder was packed down evenly throughout the crucible. The silver crucibles were each sealed in quartz tubes under 0.5 atm of Ar gas. In all attempts, the sealed quartz tubes were placed in a graphite sleeve. The sleeve was made from an Alfa Aesar 99% graphite rod of one inch diameter that was machined to accommodate 19 mm outer diameter quartz tubes. Holes were machined into the sleeve sides to allow for the sleeve to hang in the Tilt-LDFZ. A loop to allow the sleeve to hang in the furnace was constructed using nickel chromium wire by hand. An image of how the graphite crucible was held up in the Tilt-LDFZ is shown below in Figure 10.
19 Figure 10. Image of Tilt-LDFZ with quartz tube and graphite sleeve being held up by a wire loop and hook. Five lasers were aimed at the sample.
In the first attempt at crystal growth at PARADIM, roughly 2 grams of Li2OHCl powder
was loaded into a silver crucible that had most of the top part of the crucible cut off, leaving only the point. This was sealed in a 16 mm diameter quartz tube and then directly loaded into the graphite sleeve. The sleeve was hung on a hook within the Tilt-LDFZ. The heat zone created by
20
the lasers was stationary. Using an infrared thermometer in the Tilt-LDFZ to measure the temperature of the sleeve and crucible, lasers were powered to reach 320 ⁰C from room temperature over roughly two hours. The sleeve was first lifted through the heat zone, melting the powder from the top of the filled crucible to the bottom in order to densify the material. Once the bottom of the silver crucible (labelled by a line on the outside of the graphite crucible) had passed through the heat zone, the sleeve’s direction of movement was reversed. This caused the material to melt from bottom to top. In both directions of movement, the sleeve was either lifted at lowered at a rate of 10 mm per hour. Using the infrared thermometer to measure the temperature of the graphite sleeve, the power of the lasers were adjusted in order to maintain a stable temperature. The temperature of the sleeve and crucible were kept in between 314 ⁰C and 322 ⁰C. After the second sweep of the entire crucible through the heat zone, the laser was linearly powered down over two hours.
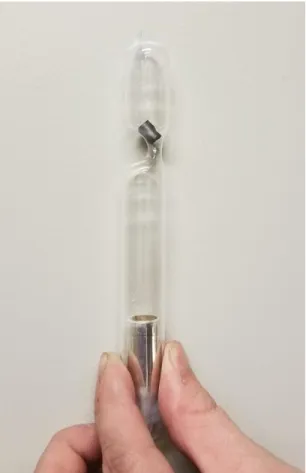
In the second attempt, a silver crucible was cut down to being roughly 4 cm tall and filled with roughly 3.5 grams of Li2OHCl. The crucible was sealed in a quartz tube under 0.5 atm of Ar
gas. A carbon getter was sealed above the silver crucible with charging material to absorb any potential water that could have been trapped in the quartz. The quartz tube with the loaded crucible inside was stood up in a box furnace and heated to melt and densify the charging material and in the second attempt, drive off water. This was done to the silver crucibles before being loaded into the graphite sleeve. In both cases, the box furnace was heated up to 320 ⁰C over 2 hours at a rate of 160 ⁰C per hour, held at 320 ⁰C for 5 hours, and then cooled at a rate of 40 ⁰C per hour until it reached room temperature. After this procedure, the silver crucible was loaded into the graphite sleeve and hung in the Tilt-LDFZ. The Tilt-LDFZ was heated up to 320 ⁰C over roughly two hours. The graphite sleeve was held around 320 ⁰C for 30 minutes. After this, the sleeve and crucible were lowered through the heating zone at a rate of 3.13 mm per hour. This melted the material at
21 the bottom first moving towards the top. The temperature of the graphite sleeve at the point of contact with the lasers was kept between 313 ⁰C and 320 ⁰C. After the entire crucible had passed through the heating zone, movement through the heat zone was ceased, and the lasers were powered down over 2 hours.
Figure 11. Image of silver crucible sealed with a piece of carbon in a quartz tube. In order to maintain that the getter remained above the crucible, the quartz was narrowed to form to compartments.
In the third crystal growth attempt, a silver crucible was filled with roughly 9 grams of Li2OHCl. The crucible was sealed in a quartz tube under 0.5 atm of Ar gas. The sealed crucible
underwent the same procedure of heating in a box furnace as occurred in the second attempt. Once placed in the graphite sleeve and hung in the Tilt-LDFZ, the sleeve and crucible were heated up to
22
320 C over 2 hours. The bottom of the sleeve where the lasers were pointed at the sleeve was held at roughly 318 C for 30 minutes. The sleeve was then lowered through the heat zone at a rate of 1.43 mm per hour. After the entire length of the sleeve had travelled through the heat zone, the lasers were powered down to zero over twelve hours.
Only the last sample from PARADIM was dismantled for characterization as it did not visibly show a gap running through the center of the crystal. The crucible for this sample was also significantly longer, allowing for easier handling during disassembly. At this time, we have only successfully opened a silver crucible with a pipe cutter. The pipe cutter was used to slowly deform the silver material into separating. An attempt was made to open the second crucible using wire cutters. Due to the thickness of the crucible walls, wire cutters were not sufficiently capable of cutting through the silver.
3.6 Optical Microscopy
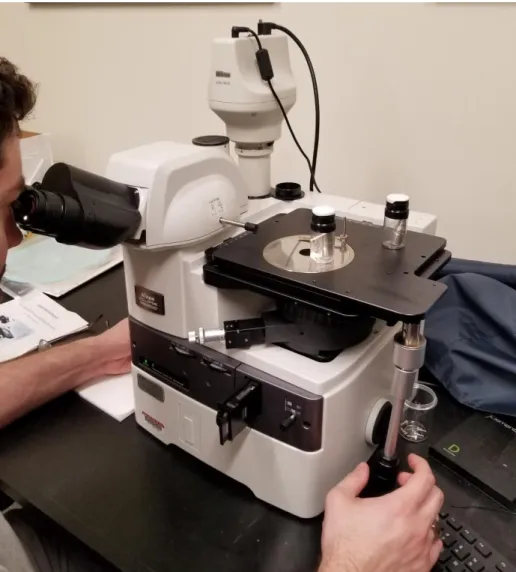
Optical microscopy was carried out using two different microscopes, one more advanced instrument that was located outside of a glove box and one simple microscope located inside of a glove box. A Nikon MA 200 Inverted Metallurgical Microscope was used to take high magnification photographs of crystal samples grown at the PARADIM Bulk Crystal Growth Facilities at Johns Hopkins. A Leica DMS 300 was used within a glove box to gain an understanding of crystal surface structure.
In order to protect the samples from water, they were sealed in clear, plastic vials that were then placed on the microscope lens surface. A layer of Teflon tape was wound around the threads of the vial. With the cap closed on the vial, a strip of electrical tape was wrapped to seal the gap between the cap and the vial. The vials were placed on the inverted lens for analysis. Figure 12
23 shows an image of this experimental set up. Imaging at 50 times magnificationwas successfully conducted on a piece of the PARADIM crystal that had broken off during the cutting of the silver crucible. The geometry of the vial and the crystals that were stuck in the silver crucibles caused the desired areas of measurement to be too far away from the microscope lens for it to successfully focus on the crystal focus. Only pieces of the crystal that had fractured off were able to be examined. Due to the three-dimensional nature of the fractured pieces, image stitching over a range of focus using the microscope’s software was required to to create photographs that were all in focus. Polarized light,backscattered light, and dark field were attempted on the samples.
24
Figure 12. Due to the inverted configuration of this microscope, containment of samples within plastic vials was a simple and effective method for performing this method of characterization.
Microscopy with the Leica DMS 300 was conducted in a glove box, so a method to contain samples was unnecessary. This microscope is not capable of precise measurements and is mainly intended to take pictures. Due to this, images taking with this instrument do not have scale bars and can only provide an idea of surface texture.
25 3.7 Laue Diffraction
Laue diffraction was conducted using a unique back-reflection Laue instrument. Polychromatic “white” X-rays from a tungsten anode were directed at the sample. Back-reflected X-rays from samples were detected using a large area Multiwire detector. Due to this experimental set up, we are only able to determine single crystal quality and crystal orientation. Samples were coated in Vaseline petroleum jelly to protect against water exposure. Samples were mounted on an aluminum mount. A spot size of 1 mm was used for the first box furnace sample. This sample was characterized roughly 50 mm away from the X-ray source. All other samples were characterized with a spot size of one or two mm and a distance of 125 mm from the X-ray source. In order to estimate the size of grains in the final PARADIM crystal, three minute measurements were conducted across one radial direction with roughly one mm between each measurement. Distances were measured by hand with a caliper. Images were compared to determine where the crystallographic spots changed or stopped appearing. Diffraction images were recorded using North Star v. 7.3 software and processed to optimize contrast and brightness using ImageJ.
4 Results and Discussion
4.1 Validation of Li2OHCl Synthesis
The successful synthesis of Li2OHCl was verified by XRD. Due to the lack of Li2OHCl
data in any XRD databases, the diffraction pattern was compared to the simulated diffraction pattern found in literature. The diffraction patterns matched the literature results, showing only trace amounts of LiOH and LiCl, leading to the conclusion that the synthesis method could
26
successfully be used to create material for further experiments. Charge material for further experiments were verified to be Li2OHCl through this XRD method.
27 Figure 13. (Top) Simulated and experimental XRD peaks from literature [8]. Here, SL stands for the simulated peaks “corresponding to the static lattice approximation.” The QH curves correspond to quasiharmonic approximations. (Bottom) XRD taken from samples synthesized for this project. The XRD peaks align in with almost no detection of residual LiOH and LiCl.
28
4.2 Confirmation of Congruent Melting
In order to determine that Li2OHCl was capable of congruent melting, the ceramic was
placed in alumina crucibles and then melted at 310 ⁰C in a box furnace for 16 hours. The material was scraped out of the crucibles and then analyzed using XRD. Figure 14 shows the comparison of the XRD patterns before and after melting and solidification. The peaks in both diffraction patters generally align with some differences in peak height. In particular, the difference in peak splitting can be explained by possible changes in the lattice parameter ratios. Due to the phase change from cubic to orthorhombic around 40 ⁰C, close to room temperature, the extent of orthorhombic symmetry is based off of the history of heat treatment of the sample. These samples likely underwent differing rates of cooling after synthesis. In general, the XRD patterns provided evidence that the Li2OHCl was the only crystalline phase present before and after melting and
solidification. Upon removal of the crucibles from the box furnace, the molten Li2OHCl appeared
transparent, a sign of congruent melting. Figure 15 shows a photograph of what the melt of this material typically looks like.
29 Figure 14. XRD patterns of Li2OHCl before and after melting. Peaks generally aligned with
30
Figure 15. Li2OHCl melted in an alumina crucible. The material in this picture was left at 320 C
for three hours in a box furnace in a glove box under an Ar gas environment. The picture was taken quickly after removal from the box furnace before solidification could take place.
Similar to the experiments to determine if Li2OHCl melted congruently, Li2OHCl was
melted on nickel, aluminum, or silver foil for 16 hours in a box furnace at 310 ⁰C. These materials were selected as possible crucible materials for Bridgman crystal growth. An example of this experimental method for silver, the material that was ultimately chosen as our crucible material for bulk crystal growth, is shown in Figure 16. Once solidified, the material would again appear white. XRD of the solidified material showed that Li2OHCl was again the only detectable
crystalline phase. Similar to the XRD of the material before and after melting in an alumina crucible, the peaks from 32⁰ to 35⁰ have different degrees of splitting due to different rates of cooling. A few degree shift is present in the data after Li2OHCl was melted on silver foil due to
31 Figure 16. XRD data of Li2OHCl before melting on silver foil and after. The few degree shift
between the two sets of data is from an instrument error. Outside of the few degree shift, the peaks align between the two measurements, thus indicating that the material remains Li2OHCl after
melting and solidifying on Ag foil.
In addition to characterization through XRD, DSC was performed in order to determine the melting temperature and verify congruent melting. As seen in the DSC heat flow curves in Figure 17, melting occurs at roughly 280 ⁰C and solidification occurs sharply at 285 ⁰C. Since the heat flow for the melting and solidification of Li2OHCl show no plateaus and is repeatable between
heating and cooling, this indicates that congruent melting occurs. Small “bumps” in the curves at slightly lower temperatures than the melting and solidification of Li2OHCl indicate a possible
32
material. These characteristics were captured in both the first and second DSC measurements, verifying the accuracy of these measurements. Incongruent melting involving another crystalline phase would not be consistent with the XRD congruent melting experiments that were conducted, but the formation of an amorphous phase would not be significantly detectable from XRD. Typically to distinguish between a phase transition and incongruent melting with DSC curves, multiple DSC curves would be conducted over different compositions to create a phase diagram. Thus, further experimentation is required to determine if these small bumps are a solid-solid phase transition. The few degree shift between the two curves can be potentially explained by how the first cycle was conducted on powder and the second cycle was conducted on a solid piece. This would allow for a phase transition or melting to nucleate and more easily spread throughout the sample.
33 Figure 17. Heat flow curves from DSC. The same sample was run under the same temperature cycle twice. Heating and cooling occurred at 5⁰C per hour.
The combination of both XRD before and after the melting of Li2OHCl samples and the
characteristics of DSC data provided ample evidence of congruent melting. Based off this information, we determined that Bridgman crystal growth could be possible for this ceramic.
4.3 Bridgman Growth Methods
Modification to the parameters that affect Bridgeman crystal growth were made based on visual inspection of samples that were made at the PARADIM crystal growth facilities. The first sample made at PARADIM with a velocity through the heat zone of 10 mm per hour showed a
Heating
Cooling
34
crater in the center of the crystal that was visible by looking down the crucible. Figure 18 shows an image of this sample after it was removed from the sealed quartz tube. This is attributed to how the crystal will nucleate at the crucible wall. If the region of crystallization is translated through the hot zone too quickly, then solidification will continue up the walls of the crucible rather than allowing for solidification into the center of the crucible. This issue may have been exacerbated by how the crucible was passed through the heat zone twice at the same quick speed. Solidification of the powder would have been contained to the crucible walls in both sweeps. XRD taken at the PARADIM facilities verified that the sample remained to be Li2OHCl, proving that the method of
sealing the sample in a quartz tube was sufficient to prevent exposure to water.
Figure 18. First attempt at crystal growth using PARADIM facilities. A gap ran down the center of crucible. The white scratches on the crystal near the crucible walls were due to collecting a sample to use XRD to confirm that sealing the crucible was sufficient to protect the charge material from moisture.
For the second attempt at crystal growth, a slower velocity of 3.13 mm per hour through the heat zone was used in an attempt to prevent the same hole in the middle of the crystal forming.
35 This is a significant decrease from the first attempt that travelled at 10 mm per hour through the heat zone. In addition to the slower velocity, the charge material underwent a heat treatment where it was heated to 320 ⁰C for 4 hours before undergoing Bridgman crystal growth. The box furnace heat treatment densified the material and potentially drove off water from the material. Even though a slower rate of 3.13 mm per hour and a heat treatment were used in this case, a crater in the center of the sample surface was formed. The crater was smaller, showing that a lower velocity was helpful in limiting its formation. Like in the first attempt, dark patches are visible on the surface. While attempting to remove the sample from the crucible for characterization, some of the solidified surface was chipped off. This revealed a white crystal underneath. This provides evidence of zone refinement, a common occurrence in Bridgman crystal growth. Impurities would be separated out to the surface of the crystal.
Figure 19. Image of second crystal grown at the PARADIM Bulk Crystal Growth Facilities. A hole can be seen in the center of the crystal. This reveals white crystal underneath, a sign of zone refinement.
36
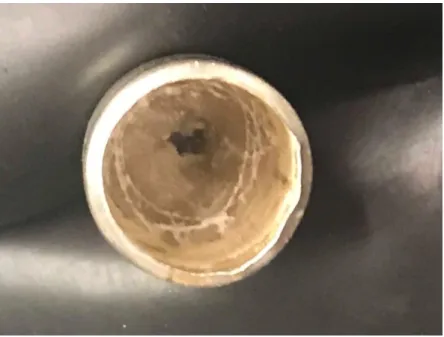
Given the presence of a hole in these two attempts, a slower velocity of 1.43 mm through the heat zone and slower cooling period of 12 hours was used. In Figure 20a, we see that no hole formed on the surface of the crystal. This indicated that the cooling rate at the end of this method was sufficiently slow to allow for crystallization through the center of the crucible. Once the crucible was opened, a small hole of roughly 2 mm in diameter could still be found in the center of the crucible. This showed that the velocity through the heat zone was still too quick for this size of crucible. Additionally, once the crucible was opened, the crystal easily fractured apart to form the two pieces seen in Figure 20b. Smaller pieces also easily cracked off unlike other samples with smaller grains. This is potentially due to the strain imposed by the phase transformation between grains.
37
Figure 20. (Top) Image of surface of the third and final crystal that was grown at PARADIM. (Bottom) Cut cross section of crucible with crystal still encased.
Difficulty with single crystal growth through the Bridgman crystal growth method is attributed to the volume change upon solidification. The volume change between the melt and the solid sample would cause a hole to form as it solidifies at the crucible wall first. This can be
38
remedied by decreasing the crucible’s velocity through the heat zone as more of the remaining charge material can fill in the hole left by solidification.
Both literature and data acquired by members of the Chiang group point towards a cubic phase occurring above 40 ⁰C and an orthorhombic phase occurring below 50 ⁰C. Figure 21 clearly provides proof of this with temperature dependent XRD scans. By going through a phase transformation as the crystal cools, twinning is introduced in the crystal as the lattice constant and structure changes slightly. Strain caused by this is released through the altered orientation at some points within the crystal. In this situation, twinning would occur and then distort the single crystal as it cools to room temperature. This provides another complication for single crystal growth for this material.
Figure 21. Temperature dependent XRD data of Li2OHCl acquired by Dr. Fei Wang in the Chiang
group. Due to the water sensitive nature of the ceramic, measurements were taken using a specialized XRD holder with a dome to seal the sample in an Ar gas environment. The volumetric thermal expansion coefficient calculated from this data is 1.47*10-4 K-1.
39 4.4 Optical Microscopy
Grain size measurement at high magnification was unsuccessful. Figure 22 shows an example of imaging that was able to be captured. Only surface texture was recovered from this method. Polarized light was not useful in attempting to identify differently oriented grains. Upon examination with the microscope light source, it was apparent that the small broken off pieces were translucent rather than clear. This is likely due to either the orthorhombic crystal symmetry of the solidified samples or twinning and fractures from the transformational strains introduced when the sample transitions from cubic to orthorhombic.
Figure 22. Captured image of Li2OHCl crystal piece at 50 times magnification. Blue coloring is
due to the diffraction of light through the plastic vial.
At low magnification, we were able to gain an idea of surface texture. Figure 23 shows images of the cross sectional crystal surface from the most successful crystal growth experiment
40
at PARADIM. Crystallites can easily be seen in these images. These indicate possible large domains.
Figure 23. (Top) 2.5 times magnification of the crystal surface (Bottom) 6 times magnification of the crystal surface. Examples of possible crystallites are circled in red.
4.5 Laue Diffraction
Laue diffraction of the first slow cooled sample showed that large grain growth was possible by just melting and slowly cooling Li2OHCl. Figure 24 is the best measurement of Laue
diffraction that was taken on this sample. From this diffraction pattern, we were able to predict that this simple crystal growth method was able to yield large grains due to the presence of distinct spots in the diffraction patterns. Distance from the X-ray source and the spot size of one mm for
41 this measurement allowed us to estimate that this domain was less than one mm in diameter. One issue with this method is that the Swagelok cell may not be airtight at high temperatures. The Swagelok cell is not designed to create a seal at high temperature. The thermal expansion of interlocking parts may not maintain a perfect seal when heated to 310 ⁰C. This may have caused water exposure and caused Li2OHCl to decompose.
Figure 24. Laue diffraction image of the first slow cooling crystal sample. One large domain was identified with this image due to the presence of Laue spots. A polycrystalline region would instead show no clear spots and symmetry.
Laue diffraction was also performed on the second Swagelok sample. This sample underwent slower cooling of 1 ⁰C per hour through the melting temperature and then quickly cooled at 12.25 ⁰C per hour from 280 ⁰C to room temperature. This measurement was taken at both the center of the crystal and the edge. In both of these, we did not find any spots, indicating that
42
the method was not successful for growing large grains. This could be due to contamination from the Swagelok cell or due to potential reactions with the alloy that it is constructed out of. An additional explanation for the lack of large grains is that the crystal was cooled down too quickly after it had solidified. As the material contracts more quickly, more strain is placed on the lattice, especially during the phase transformation from cubic to orthorhombic. This could increase the likelihood of twinning to occur in the crystal.
The third PARADIM crystal did clearly show large grains. To get a rough estimate of grain size, we compared Laue diffraction images from the edge of the crucible to the center. Laue spots were clearly identified in three of these images. With roughly one mm between each image, this would indicate that the grain is roughly two mm across. Relative to typical grain sizes, this is quite large, showing that it is possible to at least grow large domains using Bridgman crystal growth. Figure 25 shows one of the Laue images that were captured. This image is likely does not have as defined Laue spots due to the lack of meaningful orientation that was done on the sample. A lower orientation index would provide more symmetry in the Laue image. Additionally, the imaging was collected over a smaller region of the solidified sample in this case. These difference may explain the differences in Laue images between the two experiments. A single crystal of 2 mm would be large enough for some forms of characterization, proving that this method can be easily used for future research in this field.
43 Figure 25. Best Laue image that was captured while characterizing the cross section of the
PARADIM crystal. Laue spots are encircled.
4.6 Future Work
The prospect of future work in area of study is promising. One topic of particular interest is in identifying whether the DSC curves indicate an additional solid-solid phase transition or incongruent melting. This can be carried out by varying the composition of Li2OHCl in order to
develop a phase diagram for this material. Temperature dependent XRD up to the melting temperature of Li2OHCl can be completed to try to identify structural changes that occur.
Improvements can also be made to the crystal growth process. A smaller crucible design would make crystal growth more straightforward. Issues with the development of craters or holes in solidified sample will be decreased as less material will be necessary to fill the diameter of the crucible. Additionally, advancing the entire length of the crucible through the heat zone will take
44
less time if it is shorter. This will make very slow velocities through the heat zone reasonably possible. Quenching of the crucible and solidified sample inside can be used in future attempts to preserve the structure in the cubic form, possibly limiting the amount of twinning that would typically occur as the crystal cools to room temperature. This would also grant the possibility of characterization of a single crystal with cubic symmetry. Finally, if another antiperovskite that is capable of congruent melting and lacks phase transitions can be realized, single crystal growth will likely be successful for this material.
5 Conclusions
Bulk single crystal growth was attempted on an antiperovskite, Li2OHCl, through a simple
slow cooling method and the Bridgman crystal growth method. Characterization to identify the material’s capability for congruent melting was carried out through both XRD and DSC. Laue diffraction was utilized to explore the existence and size of domains within samples. XRD showed that Li2OHCl remained the only detectable crystalline phase after melting and solidifying. DSC
revealed either a solid-solid phase transition or incongruent melting. Further research to determine the correct interpretation of this data is necessary. Crystal growth experiments largely displayed that the growth of large domains is possible with Li2OHCl and that single crystal growth of an
antiperovskite can eventually be achieved. Slow cooling in a box furnace may present larger than normal grains but would require greater optimization in cooling through the cubic to orthorhombic structure transition in order to allow for larger domain size without the effects of twinning. The Bridgman method of crystal growth showed promise for being able to grow single crystals of antiperovskite. Disassembly of the crucible and visible inspection of a cross section of the crystal showed that the velocity that the crucible travels through the heat zone needs to be further
45 decreased to below 1.43 mm per hour. Additionally, optical microscopy allowed for the visual identification of crystallites in the sample that travelled through the heat zone at 1.43 mm per hour. With the Bridgman method, domains of two mm across were found with Laue diffraction.
References
[1] Dawson, J. A. et al. Atomic-Scale Influence of Grain Boundaries on Li-Ion Conduction in Solid Electrolytes for All-Solid-State Batteries. J. Am. Chem. Soc. (2018), 140, 362-368.
[2] Wang Y. et al. Structural manipulation approaches towards enhanced sodium ionic conductivity in Na-rich antiperovskites. J. Power Sources. (2015), 293, 735-740
[3] Stegmaier, S. et al. Li+ Defects in a Solid-State Li Ion Battery: Theorectical Insights with Li3OCl Electrolyte. Chem. Mater. (2017), 29, 4330-4340
[4] Mouta, R. et al. Concentration of Charge Carriers, Migration, and Stability in Li3ClO Solid
Electrolytes. Chem. Mater. (2014), 26, 7137−7144.
[5] Zhao, Y.; Daemen, L. L. Superionic Conductivity in Lithium-Rich Anti-Perovskites. J. Am.
Chem. Soc. (2012) 134, 15042−15047
[6] Steinrueck, H.G. et al. Understanding ion transport in polymeric electrolytes via X-ray photon correlation spectroscopy. APS March Meeting (2018)
[7] Lu, Z. et al. Defect chemistry and lithium transport in Li3OCl anti-perovskite superionic conductors. Phys. Chem. Chem. Phys. (2015) 17, 32547-32555.
[8] Howard, J. et al. Fundamental aspects of the structural and electrolyte properties of Li2OHCl
from simulations and experiment. Phys. Review Mater. (2017) 1, 075406.
[9] Frei, G. “Research: How are Crystals Grown?” University of Bern, Switzerland. Research
46
[10] Kuiper, P. “Laue Diffraction.” Linnaeus University.
http://homepage.lnu.se/staff/pkumsi/1FY805/Laue.html
[11] Andrews, S. J. et al. The Mosaic Spread of Very Small Crystals Deduced from Laue Diffractions Patterns. Acta Cryst. (1987). A43, 70-73.