Publisher’s version / Version de l'éditeur:
Vous avez des questions? Nous pouvons vous aider. Pour communiquer directement avec un auteur, consultez la
première page de la revue dans laquelle son article a été publié afin de trouver ses coordonnées. Si vous n’arrivez pas à les repérer, communiquez avec nous à PublicationsArchive-ArchivesPublications@nrc-cnrc.gc.ca.
Questions? Contact the NRC Publications Archive team at
PublicationsArchive-ArchivesPublications@nrc-cnrc.gc.ca. If you wish to email the authors directly, please see the first page of the publication for their contact information.
https://publications-cnrc.canada.ca/fra/droits
L’accès à ce site Web et l’utilisation de son contenu sont assujettis aux conditions présentées dans le site LISEZ CES CONDITIONS ATTENTIVEMENT AVANT D’UTILISER CE SITE WEB.
Roger J.E. Brown Memorial Volume. Proceedings Fourth Canadian Permafrost
Conference, pp. 387-393, 1982
READ THESE TERMS AND CONDITIONS CAREFULLY BEFORE USING THIS WEBSITE. https://nrc-publications.canada.ca/eng/copyright
NRC Publications Archive Record / Notice des Archives des publications du CNRC : https://nrc-publications.canada.ca/eng/view/object/?id=bf99f7b0-ee9d-4f39-ae6f-ccfddd9dcf75 https://publications-cnrc.canada.ca/fra/voir/objet/?id=bf99f7b0-ee9d-4f39-ae6f-ccfddd9dcf75
NRC Publications Archive
Archives des publications du CNRC
This publication could be one of several versions: author’s original, accepted manuscript or the publisher’s version. / La version de cette publication peut être l’une des suivantes : la version prépublication de l’auteur, la version acceptée du manuscrit ou la version de l’éditeur.
Access and use of this website and the material on it are subject to the Terms and Conditions set forth at
Confined and unconfined compression tests on frozen sands
Baker, T. H. W.; Jones, S. J.; Parameswaran, V. R.
National Research
Conseil national
-
I
$
Council Canada
de
recherches Canada
Sar
TH1
N21d
Ino.
1067
c .2
,
BLDG
,CONFINED AND UNCONFINED COMPRESSION TESTS ON FROZEN SANDS
by T.H.W. Baker, S.J. Jones, and-V.R. Parameswaran
Reprinted from
The Roger J.E. Brown Memorial Volume
Proceedings Fourth Canadian Permafrost Conference
Calgary, Alberta, March 2-6,1981 ---#
p. 387
-
393e:
, . --,-;
DBR Paper No. 1067
Division of Building Research
CONFINED AND UNCONFINED COMPRESSION TESTS ON FROZEN SANDS
T.H.W. BAKER, S.J. JONES, AND V.R. PARAMESWARAN
Reprinted from/Reimpression de
THE ROGER J.E. BROWN MEMORIAL VOLUME Proceedings Fourth Canadian Permafrost Conference
Comptes Rendus de la Quatritrne Confkrence Canadienne sur le Pergelisol Calgary, Alberta, March 2-6 mars 1981
National Research Council of Canada Conseil National de Recherches du Canada
Laboratory Testing of Frozen Soils 387
Confined and unconfined compression tests on frozen sands
T.H.W. BAKERDivision of Building Research, National Research Council of Canada, Ottawa, Ontario, Canada K I A OR6 S.J. JONES
Glaciology Division, Department of the Environment, Ottawa, Ontario, Canada KIA 0E7
AND
V .R. PARAMESWARAN
Division of Building Research, National Research Council of Canada, Ottawa, Ontario, Canada K I A OR6
The design of foundations in permafrost, excavation of frozen ground, and artificial freezing of ground to provide temporary support during construction of tunnels and other underground struc- tures require understanding of the mechanical properties of frozen soils. This paper describes the equipment and procedures developed by the authors to determine the compressive strength of artifi- cially frozen sands under confined and unconfined conditions at different temperatures and strain rates. A comparison of the results obtained under various conditions is made to assess the effects of testing conditions on the strength, strain at failure, and deformation behaviour of frozen sand. This comparison should assist in the standardization of laboratory testing procedures for the determination of the mechanical properties of frozen soils.
La conception des fondations dans le pergelisol, I'excavation dans le sol gele et la congelation arti- ficielle du sol pour fournir un appui temporaire pendant la construction de tunnels et autres structures souterraines nkcessitent une connaissance des proprietks mtcaniques des sols gelis. Cette communi- cation dCcrit 1'Cquipement et les methodes dheloppts par les auteurs pour determiner la resistance a la compression des sols neles artificiellement tant dans des conditions confinees clue sans confinement
-
lateral, a des temperatures et vitesses de deformation differentes. On compare les resultats obtenus dans diverses conditions afin de pouvoir Cvaluer les effets des conditions d'essai sur la resistance, la deformation a la rupture et le comportement de deformation du sable gele. Cette comparaison devrait aider a normaliser les mtthodes d'essai en laboratoire servant a determiner les proprietes mkcaniques des sols gel&.Proc. 4th Can. Permafrost Conf. (1982) Specimens and Testing Machines
Mechanical behaviour of frozen soils is greatly affected by such factors as specimen homogeneity, grain-size, total moisture content, ice content, dry density, strain rate, and the state of stress. In order to evaluate testing procedures and techniques, it was necessary to produce a large number of identical frozen specimens. Frozen saturated sand was chosen as the standard material in this present test series because the technique for controlling the aforemen- tioned factors was well established. Ottawa sand of specification ASTM C-109 was compacted, saturat- ed, and frozen unidirectionally following a procedure described by Baker (1976). The average moisture con- tent of the frozen specimens at the time of testing was about 19 to 20 per cent by dry weight and their dry density was about 1,670 kg/m3. All tests were carried out on floor model screw-driven universal testing machines of 250 kN capacity.
Unconfined Compression Tests (03 = 0 MPa) Unconfined compression tests were carried out on test specimens 50 and 75 mm in diameter having
length/diameter ratios greater than 2. Strain rates were varied between lo-' and 10-2/s. Some tests were performed with the specimens exposed to the ambient temperature in a cold room maintained at -6°C. For these specimens sublimation was pre- vented by a cellophane wrapper. The test set-up is shown in Figure 1. An extensometer consisting of three displacement transducers located on the speci- mens 120" apart around the circumference, measured the axial deformation and tilting of the specimen.
Figure 2 shows the low-temperature bath arrange- ment for unconfined compression tests at tempera-
tures between - 2 and - 15°C. Specimens were
immersed in kerosene during the tests to control the
temperature to
+
0.1 "C and to prevent sublimationof ice. No membrane was used to isolate the specimen from the kerosene. The bath temperature was main- tained with an immersed heat-exchange coil through which methanol was circulated from a Tenney low- temperature bath.
Results from unconfined compression tests at various temperatures, discussed in detail by Parames- waran (1980), are summarized in Figure 3. The peak stress (compressive strength) increases with increasing
Laboratory Testing of Frozen Soils 389 1 1 I I I I I I I O C a A L U M I N U M D I S K S 0
E N D
C A P S o o F L E X A N E A A 0 A- n 0-
-
0-
-
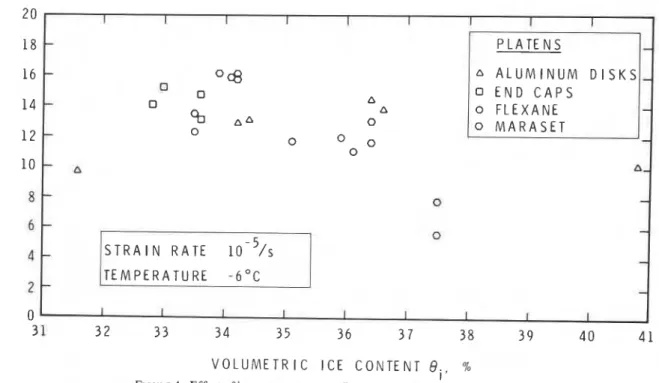
I 1 I I 1 I I 1 I .A V O L U M E T R l C I C E C O N T E N T O i , %FIGURE 4. Effect of ice content on unconfined compressive strength. compressive strength with vo1umetric ice content, Bi.
The volumetric ice content of the frozen sand speci- mens was found to vary between 31.5 to 41 -0 per cent with 83 per cent of the specimens in the 34.5
+
2 per cent range. The compressive strengths of these speci- mens varied between 5.6 and 16.2 MPa with 83 per cent of the specimen in the range 10.5 and 16 MPa. The compressive strengths obtained by different end conditions were within the same range. For this rea- son, one cannot separate the effect of end conditions on the compressive strength from the effect of ice content. A similar situation was found for the axial strain at the peak stress (Baker 1979). It was deter- mined that the type and configuration of the end con- dition affected the slope of the stress-strain curve and the axial strain at the peak stress when testing at low strain rates.Confined Compression Tests
/
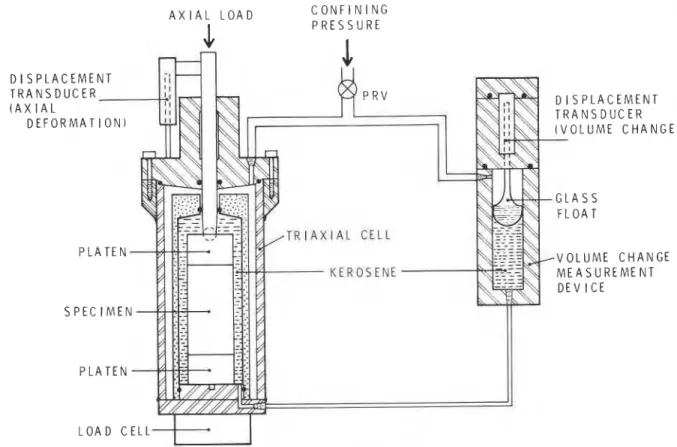
Low Confining Pressures (q = 0 to 0.35 MPa)A specially designed double-walled triaxial cell was
/
constructed to carry out tests under low confining pressures. A volume measurement device developed by Mitchell and Burn (1971) was modified to measure automatically the volume displacement of the triaxial cell fluid at low temperatures. This allowed measure- ment of the total volumetric deformation of the test specimen under load. The axial deformation was measured using a displacement transducer mountedbetween the piston and the cell. The apparatus used in these low-pressure tests is shown in Figure 5.
Tests were carried out at strain rates between and 10-4/s, at a temperature of
-
6°C. Figure 6shows typical stress-strain and volumetric strain
versus axial strain curves for specimens tested at a
confining pressure of 0.28 MPa.
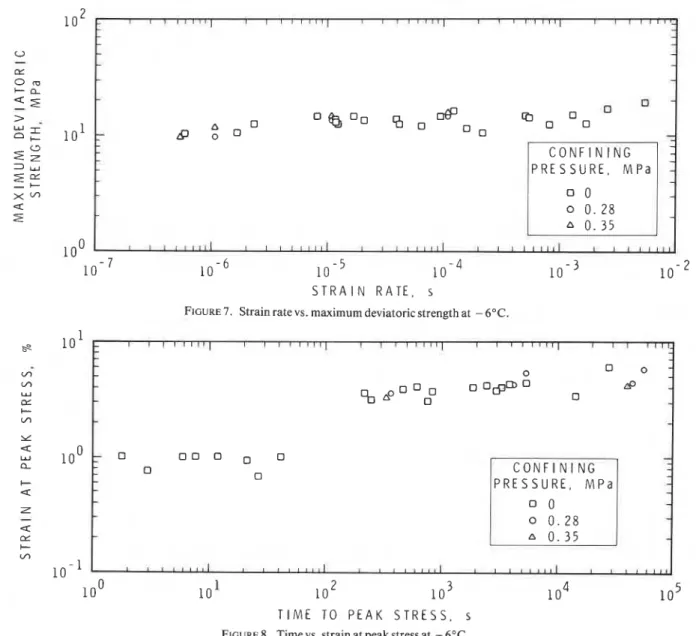
Figure 7 shows the variation of maximum devi- atoric stress (al
-
o ~with axial strain rate at ) ~ ~ ~-
6°C. Figure 8 shows the variation of the strain at peak stress with time to failure. Both figures, also show the results from unconfined compression tests. Figure 8 shows that specimens that attained peak stress in less than 102 s show an average strain of one per cent at peak stress and specimens that took longer than lo2 have average strains of about four per cent at peak stress. This would seem to indicate that there are two different modes of deformation associated with the unconfined compression tests in the range of strain rates used. The transition between these two modes of deformation occurred at approximately lo2 s corre- sponding to a strain rate of 3 x 10⁻⁴/s.These results show that confining pressures in the 0 to 0.35 MPa range had very little effect on the stress or axial strain at peak stress for these frozen sands. Effects of confining pressure are well within the scat- ter of the data. This range of hydrostatic pressure is within the approximate limit of most engineering con- siderations. Triaxial tests on unfrozen sands of the same density (Lau 1975) have shown that the stress
390 4TH CAN. PERMAFROST CONF. (1982) A X I A L L O A D C O N F I N I N G I P R E S S U R E D I S T R A ( A X D
FIGURE 5. Schematic diagram of triaxial apparatus for low-pressure tests.
0 1 I I I I I
1
0 1 2 3 4 5 6 1 8 0
A X I A L S T R A I N , %
A X I A L S T R A I N %
FIGURE 6. Stress-strain-volume curves at a confining pressure of 0.28 MPa at - 6°C.
and axial strain at peak stress are significantly affect- ed by confining pressures within this same range.
High Confining Pressures (a3 = 0 to 76 MPa) Triaxial tests at high confining pressures were car-
ried out in a high-pressure cell having a wall thickness
of 100 mm and internal dimensions of 100 mm dia- meter and 250 mm height. A schematic diagram of the cell is shown in Figure 9. The pressure vessel was surrounded by an environmental chamber main-
tained at
-
lo0 f 1 OC. Most of the tests were earridout at a strain rate of about 7.7 x 10-S/s. Dow Cor-
ning silicone fluid 200 was used as the pressuriziag medium. Tests were carried out in a closed system. An initial hydrostatic pressure was appked to the
specimen and as the pis to^ was foreed into the e l l the
hydrostatic pressure, 0 3 , was incmsed. No volume
change measurements were made. M a i l s of t%e test- ing procedure are to be published (Parameswaran and Jones 1981).
The stress-strain curves showed that for strains less than one per cent the stress increased linearly with strain. At low hydrostatic pressures a sharp yieM point and a yield drop were observed at the end s f
Laboratory Testing of Frozen Soils 391
1
oO
1 0 - 1 0 - ~ 1 0 -
*
S T R A I N R A T E , s
FIGURE 7 . Strain rate vs. maximum deviatoric strength at - 6'C.
-
0-
o B O oB
q&
0 A q q 0 B 0 0-
P R E S S U R E , M P a 0 0. 28 I 1 1 1 1 1 1 1 1 J 1 1 1 1 1 1 1 1 1 1 1 1 1 1 1 I 1 1 1 1 1 1 1 1 I I 1 1 11 1 1 1 , 1 1 1 1 1 1 1 , 1 I 1 1 1 3 1 1 1 I I I T I I I - 0 0 0 -q o # ' q &'%aoo;
0-
0 0 0 0 0 0 0 o P R E S S U R E , M P a o 0 . 2 8 1 1 1111111 I I 1 1 1 1 1 1 I t l l l l l I n , r J r L T I M E TO P E A K S T R E S S , sFIGURE 8. Time vs. strain at peak stress at - 6OC.
this linear region. As confining pressure increased,
the yield drop was suppressed and for Mh confining
pressures (> 2@ MPa), the transition from the linear
to the nonlinear region was smooth. Figure 10 shows some typical stress-strain curves obtained at various confining pressures. Yiefd and peak stresses are also indicated.
Figure 11 shows the rekionshdp h t w e m the my&rost&ic confining pressure and the deviatdc stress at yield and at peak stress. The yieM and peak stresses increased with increasing hydrostatic pressure
up to about 40 MPa, beyond which these stresses
dropped. The initial i n c r e e in strength with confin-
ing pressme is probably due to the ciowre of voids
and microcracks in the sample. Beymd 40 MPa,
pressure melting presumably increased the motrnt of unfrozen water in the sample and decreased the shear strength. Chamberlain (1973) observed a similar behaviour in high pressure tests, at 31.5 MPa, on fro- zen Ottawa sand and attributed it to the complete
suppression of dilatancy and a r e w l t W k c ~ e a s e in
porn pressure stimulating pressure melting of the ice p k e .
As pointed out by h r a m w a ~ a n and J m s
(1981), tests over a wide range of confining y a s w e s
are required to determine the lat ti on ship between the
m i m u m deviatmic stress (al -KT&,, anel cwfining
Wesswre 03, and to determi~e t k b b r Csulomb
strength parameters C (eohsion) and
4
(mgk of392 4TH CAN. PERMAFROST CONF. (1982) O - R I N G
fR
/ A
P I S T O N T E S T S P E C I M E N P O R T S F O R T H E R M O C O U P L L A N D P R E S S U R E G A U G EFIGURE 9. Schematic diagram of the high-pressure cell.
I I 1 I P E A K S T R E S S ( u l - a I- 3 m a x
-
-
-
Y I E L D S T R E S S-
-
,11.1 M P a-
I----
, l d MPa-
-
I
I I I I S T R A I N . %FIGURE 10. Stress-strain curves of frozen sand under high con-
fining pressures, 03.
0
20 4 0 6 0 S Oo
H Y D R O S T A T I C P R E S S U R E uj. MPa
FIGURE 1 1 . Variation of yield stress o y , and peak stress, omax =
( a , - 03)max, with hydrostatic confining pressure 0 3 .
Conclusions
Unconfined compressive strength of frozen sand at
- 2°C dropped at a much faster rate with decreasing strain rate below 10-5/s, than that observed at higher strain rates. At lower temperatures, such a change in slope of the stress versus strain rate curve was not observed. The behaviour at - 2°C could be attrib- uted to the mobility of unfrozen water.
Volumetric ice content had as much an effect on the compressive strength and axial strain at peak stress as platen configurations. The deformation mode at low strain rates did depend on the type of platen.
Low confining pressures (0 to 0.35 MPa), in the range of most engineering considerations, had very little effect on the compressive strength or axial strain at failure. Dilational (expansion) volumetric strains were observed at high strain rates, but were negligible at low strain rates.
A transition in the mode of deformation was ob- served at a strain rate of about 3 x 10⁻⁴/s. Specimens that required less than lo2 s for peak stress showed a strain of about one per cent at the peak stress, and those that required times longer than lo2 s had an axial strain of about four per cent.
Tests at high confining pressures (up to 76 MPa) showed an increase in yield and peak stresses up to about 40 MPa beyond which these stresses dropped. Below 40 MPa, the increasing strength was attributed
Laboratory Testing of Frozen Soils 393
to the closure of voids and microcracks. Beyond 40 MPa, the decreasing strength can be attributed to an increase in unfrozen water due to pressure melting.
Comments and Suggestions
Standardization of test methods for the laboratory testing of frozen soils has been suggested by Jess- berger (1 980) and Bragg and Andersland (1980). The International Association of Hydraulic Research (IAHR 1975, 1978) has a task committee that has rec- ommended several standards for testing the mechani- cal properties of ice. Based on the present results, the authors offer the following comments with respect to compression testing of frozen soils.
(1) Compliant platens offer the possibility of apply- ing uniform normal pressure to the ends of a conven- tional cylindrical test specimen without imposing significant radial stresses at the specimen-platen interface, either positive or negative.
Other practical advantages are:
(a) It is not necessary to make the speci- men end planes perfectly flat since the soft platen material can conform to the minor irregularities without creating adverse effects.
(b) It is possible to test relatively short cylinders as test specimens which is a useful economy when samples are obtained in the
I field by core drilling.
Some practical disadvantages are: (a) Use of compliant platens reduces the stiffness of the test system making it more difficult to control the strain rate, or dis- placement rate of the specimen in simple loading devices.
(b) Soft loading permits uncontrolled dis- placements (bursting) when the specimen yields and strain energy is released. This is only a problem at very fast loading rates. (2) It would be preferable to measure strain by using an extensometer mounted on the specimen.
(3) A method of measuring volume displacement of the cell fluid has been described in this paper. Volumetric strain measurements are required for a more complete understanding of the stress-strain behaviour and mode of failure of frozen soil specimens.
I
AcknowledgementReferences
BAKER, T.H.W. 1976. Preparation of artificially frozen sand speci- mens. Natl. Res. Counc. Can., Div. Build. Res., DBR Paper No. 682 (NRCC 15349), 16 p.
. 1979. Strain rate effect on the compressive strength of frozen sand. Eng. Geol. vo1. 13, no. 1-4, pp. 223-231. BRAGG, R.A. AND O.B. ANDERSLAND, 1980. Strain rate, tempera-
ture, and sample size effects on compression and tensile proper- ties of frozen sand. Proc. 2nd Int. Symp. Ground Freezing, Trondheim, Norway, pp. 34-47.
CHAMBERLAIN, E. 1973. Mechanical properties of frozen ground under high pressure. Proc. 2nd Int. Conf. Permafrost, Yakutsk, USSR, pp. 295-305.
IAHR. 1975. Report of task-committee on standardizing testing methods for ice. Proc. Int. Symp. on Ice Problems, Hanover, New Hampshire, pp. 607-617.
.
1978. Recommendations on testing methods of ice prop- erties. Proc. Int. Symp. on Ice Problems, Lulea, Sweden, 13 p. JESSBERGER, H.L. 1980. State-of-the-art report, Ground freezing: Mechanical properties, processes and design. Proc. 2nd Int. Symp. Ground Freezing, Trondheim, Norway, pp. 1-33. LAU, J.S. 1975. Repeated loading triaxial tests on sand. M. Sc.Thesis, Queen's University, Dep. Civil Eng., 124 p.
MITCHELL, R. J
.
AND K.N. BURN. 197 1. Electronic measurement of changes in the volume of pore water during testing of soil sam- ples. Can. Geotech. J., vol. 8, no. 2, pp. 341-345.PARAMESWARAN, V.R. 1980. Deformation behaviour and strength of frozen sand. Can. Geotech. J., vol. 17, no. 1, pp. 74-88. PARAMESWARAN, V.R. AND S.J. JONES. 1981. Triaxial testing of
frozen sands. J. Glacial., Vol. 26.20 p. (In press)
This paper is a contribution from the Division of Building Research, National Research Council of Canada, and is published with the approval of the Director of the Division.