REVIEW
Meta-analysis of metabolites involved
in bioenergetic pathways reveals
a pseudohypoxic state in Down syndrome
Laszlo Pecze, Elisa B. Randi and Csaba Szabo
*Abstract
Clinical observations and preclinical studies both suggest that Down syndrome (DS) may be associated with signifi-cant metabolic and bioenergetic alterations. However, the relevant scientific literature has not yet been systematically reviewed. The aim of the current study was to conduct a meta-analysis of metabolites involved in bioenergetics path-ways in DS to conclusively determine the difference between DS and control subjects. We discuss these findings and their potential relevance in the context of pathogenesis and experimental therapy of DS. Articles published before July 1, 2020, were identified by using the search terms “Down syndrome” and “metabolite name” or “trisomy 21” and “metabolite name”. Moreover, DS-related metabolomics studies and bioenergetics literature were also reviewed. 41 published reports and associated databases were identified, from which the descriptive information and the relevant metabolomic parameters were extracted and analyzed. Mixed effect model revealed the following changes in DS: significantly decreased ATP, CoQ10, homocysteine, serine, arginine and tyrosine; slightly decreased ADP; significantly increased uric acid, succinate, lactate and cysteine; slightly increased phosphate, pyruvate and citrate. However, the concentrations of AMP, 2,3-diphosphoglycerate, glucose, and glutamine were comparable in the DS vs. control populations. We conclude that cells of subjects with DS are in a pseudo-hypoxic state: the cellular metabolic and bio-energetic mechanisms exhibit pathophysiological alterations that resemble the cellular responses associated with hypoxia, even though the supply of the cells with oxygen is not disrupted. This fundamental alteration may be, at least in part, responsible for a variety of functional deficits associated with DS, including reduced exercise difference, impaired neurocognitive status and neurodegeneration.
Keywords: Hypoxia, Glycolysis, Krebs cycle, Oxidative phosphorylation, Meta-analysis
© The Author(s) 2020. Open Access This article is licensed under a Creative Commons Attribution 4.0 International License, which permits use, sharing, adaptation, distribution and reproduction in any medium or format, as long as you give appropriate credit to the original author(s) and the source, provide a link to the Creative Commons licence, and indicate if changes were made. The images or other third party material in this article are included in the article’s Creative Commons licence, unless indicated otherwise in a credit line to the material. If material is not included in the article’s Creative Commons licence and your intended use is not permitted by statutory regulation or exceeds the permitted use, you will need to obtain permission directly from the copyright holder. To view a copy of this licence, visit http://creat iveco mmons .org/licen ses/by/4.0/.
Down syndrome as a metabolic disease: an introduction
Down syndrome (DS; also known as Down’s syndrome or trisomy 21), is the most common genetic disorder known to date. It is caused by the presence of all or part of an additional (third) copy of chromosome 21. Its incidence is estimated to be approximately 1:700–1:1000 births worldwide. In the United States, approximately 6000
babies are born each year with DS (Bull 2020; Antonara-kis et al. 2020).
Three different types of DS can be distinguished. The most common form of DS (approx. 95% of cases) fea-tures a whole and separate extra copy of chromosome 21. Translocation represents a rare form of DS (approx. 3% of cases), where the extra chromosome 21 (or part of it) is attached to another chromosome. Approximately 1% of DS cases are “mosaic DS” where the subject con-tains a mixture of two types of cells, some containing 46 chromosomes and some containing 47 (which contain
Open Access
*Correspondence: csaba.szabo@unifr.ch
Chair of Pharmacology, Section of Medicine, University of Fribourg, Fribourg, Switzerland
the extra chromosome 21) (Bull 2020; Antonarakis et al. 2020).
The cause of the extra full or partial chromosome remains unknown, but increased maternal age is known to markedly increase the chance of DS. For instance, DS incidence increases from 1:1300 at age 25 years to 1:25 at age 49 years. Nevertheless, approximately 80% of chil-dren with DS are born to women who are younger than 35 years of age (Bull 2020; Antonarakis et al. 2020).
Subjects with DS can exhibit diverse pathophysiologi-cal alterations and deficits, ranging from mild to severe. Developmental alterations are common (phenotypically manifesting in physical growth delays and characteristic facial features, but also congenital heart disease and neu-rodevelopmental problems) and a progressive intellectual disability (Bull 2020; Antonarakis et al. 2020; Lagan et al. 2020). At later stage of life, DS produces an Alzheimer-syndrome-like state; this is so common that recent classi-fications consider DS as a congenital form of Alzheimer’s disease. A variety of additional conditions are also more common in DS, including airway, pulmonary and hear-ing disorders and hematological, oncological and autoim-mune diseases (Bull 2020; Antonarakis et al. 2020; Lagan et al. 2020).
The scientific literature related to DS pathogenesis is massive, with significant bodies of literature focusing on the molecular genetics of the condition as well as on the pathogenesis and the potential experimental therapy of the neurocognitive issues, which are generally con-sidered the most significant problems limiting the life of individuals with DS (Capone et al. 2006; Rachidi and Lopes 2010; Grieco et al. 2015; Malegiannaki et al. 2019; Lukowski et al. 2019; Martínez-Cué and Rueda 2020; Urbanus et al. 2020). However, there is also a significant body of clinical observations indicating that DS is asso-ciated with fundamental metabolic alterations, which, in turn, produce phenotypical changes, as well as increased propensities to various metabolic diseases.
For instance, DS individuals have less-than-normal muscle strength (muscle hypotonia) in their hands and lower extremities (Cioni et al. 1994; Croce et al. 1996; Carmeli et al. 2002; Hawli et al. 2009; Bala et al. 2018; Dupre and Weidman-Evans 2017; Coelho-Junior et al. 2019). They also exhibit significantly reduced aerobic exercise tolerance (Aguiar et al. 2008; Pastore et al. 2000). This has been commonly attributed to potential muscu-loskeletal developmental issues, neuromuscular junc-tional problems, as well as to the fact that DS individuals have decreased manual control, perform less physical activity and may have sarcopenia (Bala et al. 2018; Dupre and Weidman-Evans 2017; Coelho-Junior et al. 2019). While the above factors can certainly play a role, skeletal muscle functional analysis conducted in DS individuals
(Phillips et al. 2013; Cowley et al. 2012) and data obtained from murine DS models (Cowley et al. 2012, 2017; Cis-terna et al. 2014; Brault et al. 2015; Glass and Connor 2016; Bronks and Parker 1985) point to an intrinsic
bio-energetic and metabolic dysfunction in the DS skeletal
muscle. Importantly, a phosphorus magnetic resonance spectroscopy study in the quadriceps muscle of DS indi-viduals indicates that the post-exercise resynthesis kinet-ics of phosphocreatine is suppressed (Phillips et al. 2013), which (a) indicates that intrinsic biochemical/bioener-getic mechanisms are impaired in the skeletal muscle of DS individuals and (b) suggests that the skeletal mus-cle’s mitochondrial respiratory function is suppressed in DS. Moreover, comparison of the contractile properties of soleus muscle of wild-type control mice and DS mice (Ts65Dn model) indicate that (despite the fact that soleus mass, skeletal mass:body weight ratio and muscle fiber type distribution are not different between control and DS mice), skeletal muscle contractions are impaired in DS (Cowley et al. 2012). While twitch and tetanus con-tractile responses were not significantly impaired in DS, the skeletal muscle from DS mice developed a progres-sive fatigue in repeated activation/recovery protocols (Cowley et al. 2012). The contractile weakness in DS skel-etal muscle is associated with the dysregulation of multi-ple genes and gene products regulating various metabolic processes (including glucose uptake, lipid metabolism, oxidant/antioxidant balance), and has also been linked to mitochondrial dysfunction associated with DS (Hawli et al. 2009; Cowley et al. 2012, 2017; Cisterna et al. 2014; Brault et al. 2015; Glass and Connor 2016).
It is also well documented that many DS individuals present with an increased adiposity (Cowley et al. 2017; Bronks and Parker 1985; Rubin et al. 1998; Melville et al. 2005; Fonseca et al. 2005; González-Agüero et al. 2011; Soler Marín and Xandri Graupera 2011; Adelekan et al. 2012; Hill et al. 2013). This has been commonly attrib-uted to the fact that DS individuals perform less physi-cal activity and perhaps to different dietary habits (Hawli et al. 2009; Bala et al. 2018; Dupre and Weidman-Evans 2017; González-Agüero et al. 2011). Moreover, various lines of biochemical and endocrinology investigations, demonstrating increased adipokine production, altered lipid handling, subchronic inflammation, subclinical or manifest insulin resistance and/or metabolic syndrome (Magni et al. 2004; Corsi et al. 2009; de Asua et al. 2014a, b) and the development of fatty liver (Seeff et al. 1967; De Matteo and Vajro 2017) point to intrinsic biochemical
dif-ferences in the development of obesity in DS.
If a generalized metabolic and bioenergetic dysfunction is present in DS, this would not only have the potential to underlie some of the above-mentioned more ‘clas-sical’ metabolic alterations, but may also contribute to
organ developmental problems, or even to neurological dysfunction (the neurons being highly ATP-dependent cells), and potentially the process of neurodegeneration as well (since cellular bioenergetic deficit can cause prob-lems with protein processing) (see in more detail in “Potential mechanisms responsible for the development of pseudohypoxia in DS. Potentialtherapeutic interven-tions.” section). The fundamental role of metabolic and bioenergetic alterations in DS have been suspected for over 70 years and has periodically re-emerged as a work-ing hypothesis (Simon et al. 1954; Anon 1954; Breg 1977; Shapiro 1983; Blass et al. 1988; Lejeune 1990; Chango et al. 2002; Coppedè 2009; Izzo et al. 2018; Vacca et al. 2019; Antonaros et al. 2020). Jerome LeJeune, the French physician-scientist, who discovered the chromosome abnormality in humans that causes DS, constructed a “Lejeune Machine” (Lejeune 1990), to illustrate the bio-chemical and metabolic alterations associated with this condition. However, the relevant scientific literature has not yet been systematically reviewed and organized to delineate the various metabolic alterations associated with DS. Therefore, in the current article, we present the results of our meta-analysis of metabolites involved in bioenergetics pathways in DS. First, we overview the basic cellular bioenergetic metabolic pathways, focus-ing on the primary as well as alternative sources that can yield ATP, the “universal energetic currency” in mammalian cells. Next, we present the results of our meta-analysis. Finally, we discuss potential underlying pathomechanisms and implications and review possible experimental therapeutic approaches.
The principal bioenergetic pathways in mammalian cells: a brief overview
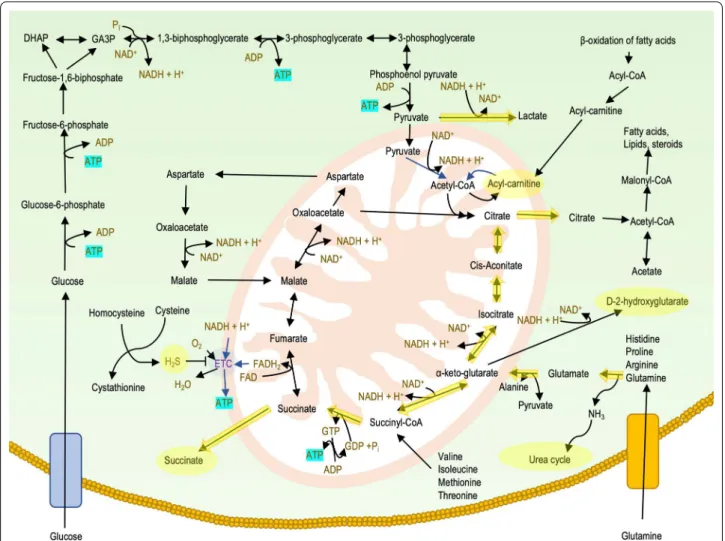
There are several metabolic pathways for the biotransfor-mation of the fuel molecules to high energy compounds such as adenosine-5′-triphosphate (ATP), guanosine-5′-triphosphate (GTP), reduced nicotinamide adenine dinu-cleotide (NADH), reduced flavin adenine dinudinu-cleotide (FADH2) and reduced nicotinamide adenine dinucleotide
phosphate (NADPH) (Dashty 2013). Glucose is the most important source of energy, but other monosaccharides, fatty acids, ketone bodies, amino acids, and nucleosides can also be used as an energetic source in a cell-specific manner (Berg et al. 2008).
Glycolysis
Glycolysis is an evolutionarily ancient process of releas-ing energy from sugar which is already present in prokar-yotes. In eukaryotic cells, glycolysis takes place in the cytosol. The essence of the process is that glucose is split into two molecules of pyruvate. Besides glucose, fruc-tose and galacfruc-tose can also enter the glycolytic pathway.
This multistep process yields two ATP molecules and two molecules of NADH per molecule of glucose. In aero-bic glycolysis, pyruvate is converted to acetyl-CoA so it can enter the mitochondria to be involved in the Krebs cycle (also known as “citric acid cycle” or “Szent-Györgyi-Krebs cycle”). However, in an anaerobic state, pyruvate remains within the cytoplasm and converts to lactate. The two molecules of NADH that are produced in glyco-lysis are oxidized to NAD+ by the reduction of pyruvate
to lactate. Hence, anaerobic glycolysis produces only two molecules of ATP. Unused glucose molecules are packed and stored in the form of glycogen serving as a fast energy resource in the liver and in the muscle (Melkonian and Schury 2019).
The pentose phosphate pathway
The pentose phosphate pathway is parallel to glycolysis. It occurs exclusively in the cytoplasm. The primary purpose of this alternative pathway is the generation of NADPH and the production of ribose-5-phosphate, to be used in the synthesis of nucleotides. However, this pathway is also involved in the catabolism of nucleosides, releas-ing energy from ribose molecules as pentose phosphate pathway is interconnected to the glycolysis through the shared used of glyceraldehyde-3-phosphate and fructose-6-phosphate (Aziz and Mohiuddin 2020).
The Krebs cycle
The acetyl-CoA molecule inside the mitochondria is fully oxidized to carbon-dioxide. The total yield of one cycle is one molecule of GTP, three molecules of NADH, and one molecule of FADH2. NADH and FADH2 are reduced
electron carriers, which donate electrons to the mito-chondrial electron transport chain, while GTP is readily converted to ATP by a nucleoside-diphosphate kinase enzyme (Haddad and Mohiuddin 2019).
Oxidative phosphorylation
The NADH and FADH2 donated-electrons reach the
mitochondrial electron transport chain in the inner mitochondrial membrane and generate an electron flow through the mitochondrial Complexes (I, II, III and IV) thus pumping protons into the inner membrane space from the mitochondrial matrix. The resulting proton gradient is then used by the ATP synthase (also known as Complex V) to generate ATP molecules from ADP and inorganic phosphate. Oxidative phosphorylation produces 24–28 ATP molecules per glucose equivalent, more ATP than any other part of the cellular respiration (Haddad and Mohiuddin 2019).
Beta oxidation of lipids
Fats provide an efficient means for storing energy for later use. Fats store more energy than glycogen and serve as a “slow energy resource”. Fatty acids are broken down into acetyl-CoA molecules through beta oxidation inside the mitochondria. Throughout each cycle of beta-oxi-dation, the fatty acid is reduced by two carbon lengths, producing one molecule of acetyl-CoA, and one mol-ecule each of NADH and FADH2. The acetyl-CoA
mol-ecule can be oxidized in the Krebs cycle, while reduced electron carriers transfer their high energy electron to the mitochondrial electron transport chain (see above). Moreover, acetyl-CoA can be converted to ketone bodies. Ketone bodies including acetoacetate, beta-hydroxybu-tyrate, and acetone are produced by the liver during peri-ods of glucose depletion. Ketone bodies are transported into organs requiring energy and converted back into acetyl-CoA, which then enters the Krebs cycle (Dunn and Grider 2020).
Amino acid catabolism
Amino acids can also be used as a source of energy espe-cially in times of starvation or high-protein content diet. The processing of amino acids results in the generation of intermediates of the citric acid cycle, including pyru-vate, acetyl CoA, oxaloacetate, and α-ketoglutarate. In human blood, glutamine is the most abundant free amino acid. Glutamine catabolism, as an energy source, plays an important role in cancer cell survival (Jiang et al. 2019) and in the survival of mutant cells that harbor oxida-tive phosphorylation defects (Chen et al. 2018). Amino acid catabolism results in ammonia, a toxic byproduct. Ammonia can be detoxified by conversion to urea via the urea cycle, which occurs mainly in the liver. Urea pro-duced by the liver is ultimately excreted by the kidney (Wu 2009).
Pseudohypoxia
This term “pseudohypoxia” was originally coined by Ron Tilton’s group (Williamson et al 1993), referring to hypoxia-like change in the metabolic phenotype of cells in diabetes. In general, pseudohypoxia refers to a state in which cells or tissues express hypoxia-related genes and proteins and use re-wired metabolic pathways even when there is enough oxygen present. Pseudohypoxic phenotypes have been observed in a number of patho-physiological conditions, including sepsis (Tannahill et al. 2013) and Alzheimer’s disease (Salminen et al. 2017); it is also considered a component of physiological aging (Ver-din 2015). More than a century ago Warburg (Warburg et al. 1927) observed similar phenomenon in various tumor cells; even when the cells are aerobic, they tend to mobilize glycolysis (often not as an alternative, but as a
supplementary process to the normal oxidative phospho-rylation) to maximize ATP generation that the cancer cells require for their fast division and multiplication. Gene expression, proteomic and metabolomic profiling of DS as it relates to cellular bioenergetics Understanding the alterations in molecules provides important information for determining the molecu-lar mechanisms of diseases. “Omics” technologies per-mit the universal detection of genes (genomics), mRNA (transcriptomics), proteins (proteomics) and metabolites (metabolomics) in biological samples (Ishihara and Akiba 2017). In DS, the genes encoded on chromosome 21 are exclusively up-regulated (and none of them are down-regulated), supporting the “gene dosage theory” of DS i.e. that the extra chromosome 21 results in the upregu-lation of its gene products, which, in turn, directly or indirectly changes development and affects various cel-lular functions. However, approximately 90% of the dif-ferentially expressed genes in DS (which include both upregulated and downregulated genes) are encoded on chromosomes other than chromosome 21, indicating dysregulated signaling cascades and/or compensatory gene regulation mechanisms (Letourneau et al. 2014; Araya et al. 2019; Bally et al. 2020). Integration of differ-ent “omics” datasets (for example transcriptomics and proteomics) may provide a tool to link different net-works, highlighting the cellular response to a perturba-tion (although, to our knowledge, in DS, several different types of omics approaches have not yet been systemati-cally integrated). Nevertheless, “omics” approaches have many limitations. For instance, mRNA expression level is not always a good indicator for protein expression level (e.g. due to post-transcriptional regulation of protein stability), and higher protein expression level does not necessarily mean a higher rate of an enzymatic reaction (for instance, because protein function is often regulated by post-transcriptional modifications, as well as by sub-strate and co-factor availability). In the following sec-tion, we will focus on the meta-analysis of metabolomic alterations, which represent the various products and substrates of enzymatic biochemical reactions; analysis of these metabolites may be a more direct indication of a metabolic pathway alteration than changes in mRNA or protein expression.
Analysis methods used
Data collection and identification of studies
Journal articles published before July 1, 2020, were identified by using the search terms “Down syndrome” and “metabolite name” or “trisomy 21” and “metabo-lite name”. We checked reference lists and published review articles for additional potentially relevant studies.
Moreover, metabolomics studies on human DS cells or individuals with DS were also collected.
Inclusion and exclusion criteria
The inclusion criteria for the present study were as fol-lows: (1) We only included studies that measured the amount of the selected metabolites. (2) Studies had to include both a sample from DS individuals and a con-trol comparison group (3) Studies had to provide means and standard deviations and information about sample sizes for both groups. Studies were also included, if they do not provide directly the means and standard devia-tions, but they can be estimated from the published data. (4) Studies providing data for the selected metabolites in different tissues or using different methods were all included. However, for measurements involving ATP or other high-energy phosphates, only direct measurements of total cellular high-energy phosphates were considered. (5) Only human samples were considered (data derived from animal models of DS were excluded). (6) Studies or experiments measuring metabolite levels after a treat-ment were excluded, similarly if the measuretreat-ment was performed on cell lines at high (> 7) passage number. (7) Only publicly available datasets were used. In total 41 published reports and associated databases (all of which used cross-sectional study design) were identified and subjected to analysis.
Variables included in data analysis
The following variables were collected: (1) The first author. (2) Year of publication. (3) The chemical name of the selected metabolite. (4) Mean of metabolite content in DS group. (5) Standard deviation of metabolite content in DS group. (6) Sample size in DS group. (7) Mean of metabolite content in control group. (8) Standard devia-tion of metabolite content in control group. (9) Sample size in the control group.
Meta‑analytic procedures
A meta-analysis was conducted with the meta R pack-age (Balduzzi et al. 2019). Raw data from metabolomics experiments often contain unwanted technical variations between samples and data are typically right-skewed within a sample. In order to meet normality assump-tions of several parametric tests, data are usually log2 transformed. Technical variations such as signal drifts or batch effects are frequently encountered in metabolic profiling thus removing these effects by normalization is now widely considered as an integral part of data pro-cessing (Li et al. 2017). Several methods are available, but still, sample normalization is sometimes ignored in metabolomics studies. We used log2 transformation if authors reported statistics on skewed data and variance
stabilizing normalization (Huber et al. 2002), if the authors did not normalize, but it would have been neces-sary. Further details can be found in the Supplementary Material. Adjustment for potential confounders, (e.g. age or sex) was not performed, and most of the cases these data were not available on individual levels.
The following studies give directly group means (M), standard deviations (SD) and sample sizes (N): Hel-guera et al. (2013), Bayer and McCoy (1974), Bartels (1971, Knull et al. (1978), Puukka et al. (1982), Kedziora et al. (1972), Nelson and Benson (1972), de Asua et al. (2014a,b), Lejeune et al. (1992), Nura et al. (2008), Infan-tino et al. (2011), Zitnanova et al. (2004), de Sousa et al. (2015); Howell et al. (1973); Kaufman and O’Brien (1967), Campos et al. (2010), Yates et al. (1990), Zaki et al. (2017), Coppus et al. (2007), Pogribna et al. (2001) and Miles et al. (2007).
If the standard error of the mean (SEM) is reported, standard deviations can be derived by using the formula: SD = SEM*sqrt(N). This conversion was performed on the following studies: Stocchi et al. 1985, Valenti et al. 2010, Rodríguez-Sureda et al. 2015, Izzo et al. 2017, Heg-garty et al. 1996, Watkins et al. 1989, Tiano et al. 2008, and Convertini et al. 2016.
In some studies, the values of data were plotted in graphs. In this situation, values were extracted using
digi-tize R package (Poisot 2011) or Adobe Acrobat Reader measurement tools.
Mircher reported age-segmented data (Mircher et al. 1997). In this case, age-segmented data were sequentially combined according to the Cochrane textbook (Hig-gins and Green 2008). Being N the number of individu-als in a given segment, M the mean and SD the standard deviation of segments 1 and 2, mean is calculated as (N1*M1 + N2*M2)/(N1 + N2). For SD, it is the square
root of: [(N1 − 1) SD12 + (N2 − 1) SD22 + ((N1*N2/
(N1 + N2)) (M12 + M22 − 2*M1*M2))]/(N1 + N2 − 1).
Similarly, age and gender groups were combined for the study of Pant and colleagues (Pant et al. 1968).
Chapman and Stern (1964) and Rosner et al. (1965) reported mean values and ranges. SD from ranges was calculated using the conversion factor provided by the study of Walter and Yao (2007).
Caracausi et al. (2018) and Antonaros et al. (2020) reported raw data values. M, SD, and N were calculated for each compound both in DS and in control groups, as well as in plasma and in urine samples while the fasting condition was not considered. More details can be found in Additional file 1.
Culp-Hill et al. (2017) reported untargeted and targeted metabolomics datasets. Data were filtered for the age: 12 ≤ Age ≤ 54, in line with the original study. Normaliza-tion and log2 transformaNormaliza-tion were performed on the raw
data. If the compound is present both in the targeted and the untargeted compound list, only the targeted values were considered. More details can be found in Additional file 1.
In the study of Powers et al. (2019) we used the adjusted_met_data dataset, to calculate M, SD and N for a given metabolite in DS and control plasma.
Orozco et al. (2019) reported regression coefficients from multiple linear regression performed for each metabolite to assess the association between neurodevel-opmental diagnosis (independent variables) and plasma metabolites (dependent variable). Typical development (control) children were used as a reference group. Adjust-ing for sex, race/ethnicity, age, year of blood collection, and parental homeownership was performed. From the published parameters i.e. betas, confidence intervals (95%CImax and 95%CImin), and sample sizes (NDS for
DS, and NC for control), we calculated the M and SD for meta-analysis as M (for DS) = beta, M (for control) = 0, SD (for both) = ((95%CImax − 95%CImin)/(2*t))/sqrt(1/
NDS + 1/NC), when t is the t-value for the given
probabil-ity (0.975) and degree of freedom. The degree of freedom for multiple regression is calculated as n − k − 1, where n = NDS + NC, and k refers to the number of regressors
not including the intercept.
Obeid et al. (2012) reported median, 10% quantile, and 90% quantile. In this case, the group mean was estimated as log2(median), while SD was estimated as [log2(90%quantile)-log2(10%quantile)]/(2*z0.9), where z0.9 = 1.28.
Fuller et al. (1962) and Mertz et al. (1963) reported indi-vidual data, from which M, SD and N were calculated.
A random-effects model (Borenstein et al. 2011) was used to determine the expected high degree of heteroge-neity across studies using Hedges’ g as the standardized mean difference (Hedges 1981). Besides that, the 95% confidence intervals (CI) were estimated. Positive and negative SMD values indicated higher and lower levels of metabolites in DS group, relative to the control group. Statistical significance was set at p < 0.05.
Forty-one studies met the inclusion criteria, were criti-cally reviewed, and are summarized in Table 1.
Alterations in high energy molecule pools in DS cells and tissues
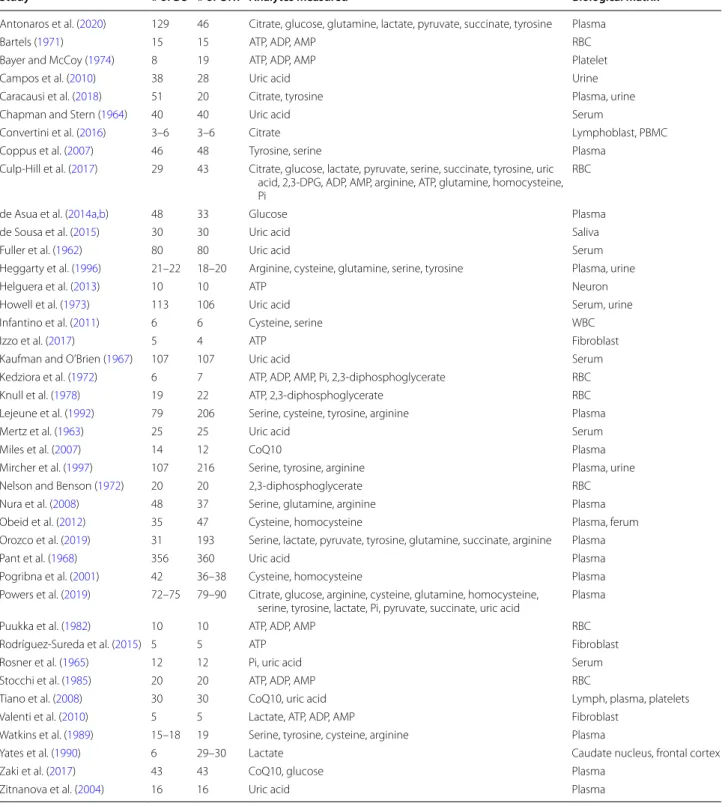
Within cells, energy is provided by oxidation of fuel mol-ecules such as carbohydrates, lipids, and proteins. The oxidation process results in free energy production that can be stored in high-energy bonds within molecules such as nucleoside triphosphate, phosphoenolpyruvate, carbamoyl phosphate, 2,3-bisphosphoglycerate, phos-phoarginine, or phosphocreatine (Bonora et al. 2012). Kedziora and his coworkers have reported decreased
levels of 2,3-diphosphoglyceric acid, and increased con-tent of AMP, GTP, NAD+, and NADP+ (Kedziora et al. 1972). Our meta-analysis performed on ATP, ADP and AMP levels revealed statistically significant changes. Importantly, we observed that cellular ATP content is significantly lower in DS individuals (Fig. 1a), while ADP is slightly reduced (Fig. 1b) and AMP is unchanged (Fig. 1c). In addition, in DS individuals, there was a ten-dency for an increase in inorganic phosphate (Pi) levels (Fig. 1d). Similar trends in the composition of energy molecule pool have been observed in hypoxic state. In hypoxia, there is a fall in [ATP] and an increase in [ADP], along with an increase in Pi (Taggart and Wray 1998). These alterations resulted in a lower energy charge of DS cells compared to controls (see: Additional file 1).
The molecule 2,3-diphosphoglyceric acid (2,3-DPG) is very important in regulating the affinity of hemoglobin for oxygen. If the concentration of 2,3-DPG in red blood cell is low, hemoglobin affinity for oxygen is increased and tissue hypoxia may occur (MacDonald 1977). Our meta-analysis revealed no significant difference in the con-tent of 2,3-DPG between DS and control red blood cells (Fig. 1e). This finding may indicate that oxygen delivery to DS tissues may not be impaired, but—based on the low ATP output, we hypothesize that—they may use less oxy-gen compared to healthy individuals (pseudo-hypoxia).
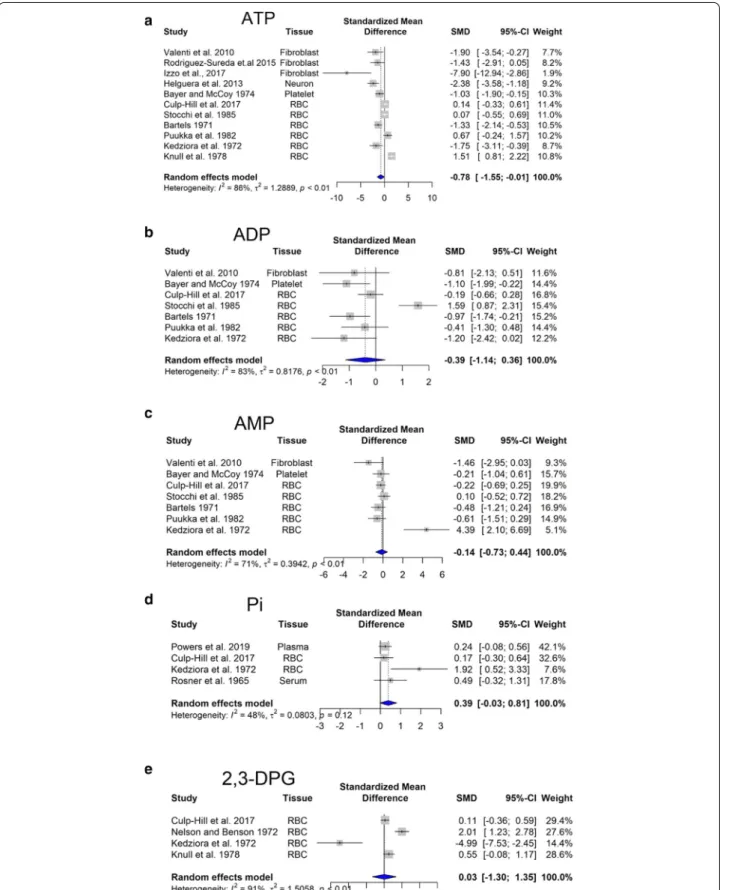
Uric acid (UA) is the end product of ATP and GTP catabolism and can reportedly act as an antioxidant. Several studies indicate elevated uric acid levels and increased prevalence of gout in DS (Igoe et al. 2017). In line with these findings, our meta-analysis showed that this elevation is statistically significant (p < 0.05) (Fig. 2). As higher urinary uric acid excretion is an indicator of severe hypoxia (Ozanturk et al. 2006), we can assume that a pseudo-hypoxic state develops in DS.
Further evidence for pseudohypoxia would be an increased NADH to NAD+ ratio (Gomes et al. 2013), but
we have not found a study addressing this question in DS. Stocchi and colleagues reported that the total levels of nicotinamide adenine dinucleotide (NADH and NAD+)
and nicotinamide adenine dinucleotide phosphate (NADPH and NADP+) were within normal ranges in DS
individuals (Stocchi et al. 1985).
Changes in mitochondrial electron transport/oxidative phosphorylation in DS
As already mentioned earlier, DS is characterized by an overexpression of genes on chromosome 21, in addi-tion to an overall dysregulaaddi-tion of an even larger set of genes located on the other chromosomes (Letourneau et al. 2014; Araya et al. 2019; Culp-Hill et al. 2017; Mao et al. 2005). Among these, there are genes involved in oxidative phosphorylation (OXPHOS), including all
five mitochondrial complex subunits, genes implicated in mitochondrial biogenesis, and more generally in the mitochondrial function. Microarray analyses of DS sam-ples showed a marked downregulation of genes encoding
mitochondrial proteins, called nuclear-encoded mito-chondrial genes (Conti et al. 2007; Chen et al. 2012; Sulli-van et al. 2016; Liu et al. 2017; Sobol et al. 2019; Lee et al. 2003) (Table 2).
Table 1 Studies selected for meta-analysis
Study # of DS # of CTR Analytes measured Biological matrix
Antonaros et al. (2020) 129 46 Citrate, glucose, glutamine, lactate, pyruvate, succinate, tyrosine Plasma
Bartels (1971) 15 15 ATP, ADP, AMP RBC
Bayer and McCoy (1974) 8 19 ATP, ADP, AMP Platelet
Campos et al. (2010) 38 28 Uric acid Urine
Caracausi et al. (2018) 51 20 Citrate, tyrosine Plasma, urine
Chapman and Stern (1964) 40 40 Uric acid Serum
Convertini et al. (2016) 3–6 3–6 Citrate Lymphoblast, PBMC
Coppus et al. (2007) 46 48 Tyrosine, serine Plasma
Culp-Hill et al. (2017) 29 43 Citrate, glucose, lactate, pyruvate, serine, succinate, tyrosine, uric acid, 2,3-DPG, ADP, AMP, arginine, ATP, glutamine, homocysteine, Pi
RBC
de Asua et al. (2014a,b) 48 33 Glucose Plasma
de Sousa et al. (2015) 30 30 Uric acid Saliva
Fuller et al. (1962) 80 80 Uric acid Serum
Heggarty et al. (1996) 21–22 18–20 Arginine, cysteine, glutamine, serine, tyrosine Plasma, urine
Helguera et al. (2013) 10 10 ATP Neuron
Howell et al. (1973) 113 106 Uric acid Serum, urine
Infantino et al. (2011) 6 6 Cysteine, serine WBC
Izzo et al. (2017) 5 4 ATP Fibroblast
Kaufman and O’Brien (1967) 107 107 Uric acid Serum
Kedziora et al. (1972) 6 7 ATP, ADP, AMP, Pi, 2,3-diphosphoglycerate RBC
Knull et al. (1978) 19 22 ATP, 2,3-diphosphoglycerate RBC
Lejeune et al. (1992) 79 206 Serine, cysteine, tyrosine, arginine Plasma
Mertz et al. (1963) 25 25 Uric acid Serum
Miles et al. (2007) 14 12 CoQ10 Plasma
Mircher et al. (1997) 107 216 Serine, tyrosine, arginine Plasma, urine
Nelson and Benson (1972) 20 20 2,3-diphosphoglycerate RBC
Nura et al. (2008) 48 37 Serine, glutamine, arginine Plasma
Obeid et al. (2012) 35 47 Cysteine, homocysteine Plasma, ferum
Orozco et al. (2019) 31 193 Serine, lactate, pyruvate, tyrosine, glutamine, succinate, arginine Plasma
Pant et al. (1968) 356 360 Uric acid Plasma
Pogribna et al. (2001) 42 36–38 Cysteine, homocysteine Plasma Powers et al. (2019) 72–75 79–90 Citrate, glucose, arginine, cysteine, glutamine, homocysteine,
serine, tyrosine, lactate, Pi, pyruvate, succinate, uric acid Plasma
Puukka et al. (1982) 10 10 ATP, ADP, AMP RBC
Rodríguez-Sureda et al. (2015) 5 5 ATP Fibroblast
Rosner et al. (1965) 12 12 Pi, uric acid Serum
Stocchi et al. (1985) 20 20 ATP, ADP, AMP RBC
Tiano et al. (2008) 30 30 CoQ10, uric acid Lymph, plasma, platelets
Valenti et al. (2010) 5 5 Lactate, ATP, ADP, AMP Fibroblast
Watkins et al. (1989) 15–18 19 Serine, tyrosine, cysteine, arginine Plasma
Yates et al. (1990) 6 29–30 Lactate Caudate nucleus, frontal cortex
Zaki et al. (2017) 43 43 CoQ10, glucose Plasma
Fig. 1 Changes in bioenergetics-related analytes in Down syndrome. Forest plot showing relative weights, standardized mean difference (Hedge’s
The first study suggesting a functional association between impaired mitochondria and DS was conducted in 1994. Prince and colleagues reported a decreased activity of mitochondrial enzymes in platelets from DS individuals compared to normal controls (Prince et al. 1994). Subsequent studies demonstrate a reduction in mitochondria energy production efficiency in DS fibro-blasts due to the impairment of complex I, V, ADP/ATP translocator and adenylate kinase activities (Schapira 1999; Piccoli et al. 2013). Additionally, the expression of several different mitochondrial electron transport enzyme subunits is decreased in the brain from DS indi-viduals (Kim et al. 2001). DS fibroblasts are character-ized by increased production of reactive oxygen species (ROS), higher intra-mitochondrial Ca2+ levels, and
bio-energetic deficit, with decreased basal ATP content and lower mitochondrial membrane potential (Schapira 1999; Piccoli et al. 2013; Kim et al. 2001; Panagaki et al. 2019, 2020).
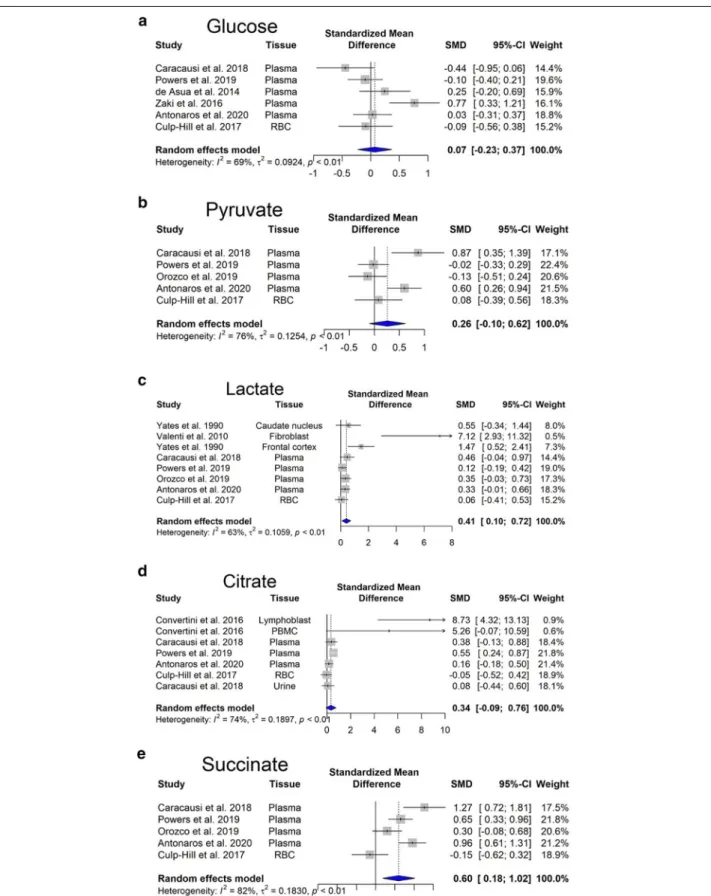
Coenzyme Q10 (CoQ10), a lipid molecule is an essen-tial component of the electron transfer chain and it is an endogenous cellular antioxidant. CoQ10 takes part in aerobic cellular respiration and generation of energy in the form of ATP. Our meta-analysis reveals that the levels of CoQ10 are significantly reduced in DS (Fig. 3).
Electron microscopy analysis of fetal DS hearts pro-vided a deeper understanding of mitochondrial abnor-malities in DS. Most of the DS mitochondria were characterized by morphological alterations, such as
increased fragmentation, bigger size, irregular shape, and cristae’s patterns (Schapira 1999; Piccoli et al. 2013; Kim et al. 2001; Panagaki et al. 2019, 2020). Similar changes have been reported in hypoxic conditions, namely increased ROS production, together with a decrease in the activity in mitochondrial complexes and mitochon-drial fragmentation (Lee et al. 2020a, b).
Glycolytic alterations in DS
If oxidative phosphorylation is impaired, NADH and FADH2 cannot be oxidized as rapidly in the electron
transport chain and ATP cannot be generated. To main-tain the energy supply of the cell, alternative pathways for producing energy are utilized.
Accordingly, there is an increased level of anaero-bic glycolysis in DS. The phosphorylation of fructose 6-phosphate is irreversible, and phosphofructokinase, the enzyme that catalyzes it, is the rate-limiting enzyme in glycolysis (Mor et al. 2011). Several early reports show that there is an increase in the activity of phosphofruc-tokinase enzyme in fibroblast and red blood cells derived from individuals with DS (Layzer and Epstein 1972; Bai-kie et al. 1965; Annerén et al. 1987; Conway and Layzer 1970). Nevertheless, the gene for the liver type subunit of phosphofructokinase is located on human chromosome 21 indicating a higher gene expression.
Overexpression of enzymes involved in glycolysis would predicts an increased glucose consumption of the DS cells. Our meta-analysis revealed no significant
Fig. 2 Changes in uric acid in Down syndrome. Forest plot showing relative weights, standardized mean difference (Hedges’ g) with confidence
changes in glucose steady-state concentrations (Fig. 4a). However, there is an increasing trend in pyruvate con-centration (Fig. 4b).
Glycolysis produces 2 ATP molecules and 2 NADH molecules. NADH generated during aerobic glycolysis
cannot reach the electron transport chain directly. The malate-aspartate shuttle mechanism serves to move the reduced NADH across the membrane in the form of other reduced molecules (Nelson et al. 2008). However, in DS, the electron transport chain is directly inhibited Table 2 Changes in genes and proteins involved in oxidative phosphorylation in DS
{as discussed later, recent data suggest that one of the reasons is that Complex IV activity is suppressed by the increased hydrogen sulfide [H2S] production, resulting
from increased cystathionine-beta-synthase [CBS] and 3-mercaptopyruvate sulfurtransferase [3-MST] expres-sion in DS cells (Panagaki et al. 2019, 2020)}. Hence, NADH molecules remain in the cytosol and oxidized in the process of lactic fermentation to regenerate NADH molecules produced in glycolysis. Our meta-analysis revealed that lactate production, i.e. anaerobic glycolysis is significantly elevated (p < 0.05) (Fig. 4c) in Tamarkina et al. (1978) and Baikie et al. (1965) showed that lactate dehydrogenase activity in DS samples was not elevated, indicating an upstream regulation, most probably at phosphofructokinase level (Tamarkina et al. 1978). Increased blood lactate concentration is traditionally attributed to anaerobic glycolysis due to inadequate oxy-gen delivery (James et al. 1999).
Changes in amino acid utilization in DS
Amino acids derived from the dietary proteins serve as an energy source as they can enter the citric acid cycle, while their ammonia moiety is eliminated through the urea cycle. Glutamine is the most abundant extracel-lular amino acid in the blood plasma, and it is quantita-tively the most important fuel among the amino acids. Nevertheless, there are no changes in its concentrations between DS and control subjects (Fig. 4a). It is immedi-ately metabolized to glutamate by glutaminase. Later, glutamate undergoes transamination with pyruvate gen-erating l-alanine and 2-oxoglutarate (also known as alpha-ketoglutarate). The latter metabolite is then oxi-dized in the Krebs cycle generating succinate (Nelson et al. 2008). Energy molecules, NADH and GTP, are gen-erated via this pathway. GTP can be easily converted to ATP in the cell (Conway and Layzer 1970). As in DS the
mitochondrial electron transport chain is inhibited, the produced NADH may be oxidized in another manner.
One possible way is the reduction of alpha-ketogluta-rate to 2-hydroxyglutaalpha-ketogluta-rate by using NADH. L-2-hydrox-yglutarate is found to be produced to high levels in low oxygen conditions, including cells of the immune system and cancer cells (Tyrakis et al. 2016). In DS plasma, Pow-ers and colleagues demonstrated an increase in the levels of 2-hydroxyglutarate (Powers et al. 2019).
Second, mitochondrial isocitrate dehydrogenase can catalyze the reverse reaction converting alpha-ketoglu-tarate to isocitrate and then citrate (reductive carboxy-lation). During this step, NADH is oxidized and the resulting citrate is then transported out of the mito-chondria, to the cytosol, where the enzyme citrate lyase converts citric acid to acetyl-CoA (Corbet and Feron 2015). This is the initial step of de novo lipid biogen-esis. Mitochondrial isocitrate dehydrogenase-mediated reductive carboxylation is observed when steady-state alpha-ketoglutarate levels are high, and that of citrate is low (Eales et al. 2016). In DS individuals, elevated levels of alpha-ketoglutarate have been found in plasma (Pow-ers et al. 2019) and in red blood cells (Caracausi et al. 2018). Moreover, our meta-analysis showed a significant increase in citrate levels (Fig. 4d). In hypoxia, there is also a significant increase in the levels of molecules involved in the citric acid cycle, such as citrate, succinate, fuma-rate (Bénit et al. 2014; Peng et al. 2019).
Succinate produced during the citric acid cycle, is transported across the inner mitochondrial membrane by the mitochondrial dicarboxylate carrier and acts as a mediator of mitochondrial dysfunction (Tretter et al. 2016). Our meta-analysis revealed that succinate accu-mulates in DS (Fig. 4e). It has been shown that succi-nate stabilizes hypoxia-inducible factor 1-α, leading to hypoxia-like metabolic phenotypes in the absence of hypoxia, also known as pseudohypoxia. Succinate also
Fig. 3 Changes in CoQ10 in Down syndrome. Forest plot showing relative weights, standardized mean difference (Hedges’ g) with confidence
Fig. 4 Changes in Krebs cycle-related analytes in Down syndrome. Forest plot showing relative weights, standardized mean difference (Hedges’ g)
inhibits histone and DNA demethylases changing the epigenetic profile (Tretter et al. 2016). Moreover, suc-cinate might be involved in ROS generation, through Complex I (Chouchani et al. 2014). The presence of increased ROS levels and oxidative stress in DS indi-viduals has been well established (Valenti et al. 2011).
Besides that, several alterations on amino acid con-centrations have been described in the blood of DS in comparison with control subjects (Fig. 5). The most consistent findings are the following: increased cysteine (Fig. 5b) and decreased serine (Fig. 5c) and homocyst-eine (Fig. 5d) levels (most probably due to a dosage effect of the gene for CBS), as well as decreased tyros-ine and argintyros-ine levels, perhaps due to the pseudo-hypoxic state of DS cells. In fact, it is known that
hypoxia inhibits the synthesis of arginine from citrul-line (Su and Block 1995).
Changes in lipid catabolism in DS
Fatty acid oxidation is the mitochondrial aerobic pro-cess of breaking down fatty acids into acetyl-CoA units. This process is influenced by the impaired mitochondrial oxidative phosphorylation in DS. The molecule carnitine transports long-chain fatty acids into mitochondria Car-nitine exists in humans as free (unesterified) carnitine, and esterified carnitine (acyl-carnitines). Free carnitine levels were reduced in young DS children (Seven et al. 2001). Similarly, free carnitine levels were lower in the hypoxic–ischemic neonates. (Çam et al. 2005). Moreover, hypoxic–ischemic neonates had significantly increased
Fig. 5 Changes in selected amino acids in Down syndrome. Forest plot showing relative weights, standardized mean difference (Hedges’ g) with
C4, C5, C5:1, C6, C6-OH, C8 levels and decreased long-chain acylcarnitine levels (López-Suárez et al. 2019). Powers and colleagues (Powers et al. 2019) also found that C5 and C5:1 levels were significantly increased in DS.
Potential mechanisms responsible
for the development of pseudohypoxia in DS. Potential therapeutic interventions
In order to conceive potential therapeutic interventions for the DS-associated pseudohypoxia, we need to under-stand (or at least have some reasonable working hypoth-eses for) the underlying pathobiochemical mechanisms. Although to identify the most relevant pathways in a system where over a thousand genes are dysregulated may seems like looking for the “needle in the haystack”, a number of potential contributing biochemical mecha-nisms have been identified over the last two decades. Antioxidant strategies
ROS accumulation promotes oxidative modification of important biomolecules, including lipids, proteins, nucleic acids and mtDNA, altering the function of several organs or the whole organism. Although chromosome 21 also encodes superoxide dismutase (SOD), which would predict that DS cells may have an improved antioxida-tive potential, paradoxically ROS-related processes have been suggested to play a significant role in the develop-ment of various DS pathologies (Lott et al. 2006). The most likely explanation for this paradox may be that the increased SOD cannot fully cope with the massively increased ROS formation in DS. ROS can be produced by various sources in the cell; for instance, if the mito-chondrial electron transport chain is blocked, electrons can back up and leak off from the mitochondria. Moreo-ver, hypoxic cells have a number of additional sources of ROS, such as NADPH oxidase or xanthine oxidase. ROS is not only a product of mitochondria, but also a causa-tive factor in mitochondrial dysfunction, which, in turn, further impairs the ability of the cell to perform oxidative phosphorylation and ATP generation (Vacca et al. 2019). Moreover, the accumulation of oxidative DNA damage in DS is considered as an early event promoting cell dys-function of various types (including neurodegeneration and Alzheimer-like dementia, a distinctive and severe hallmark of DS) (Contestabile et al. 2010).
Although ROS can serve both beneficial and detri-mental effects in various conditions, a generic thera-peutic approach to improve mitochondrial function and to boost cellular bioenergetics would be to scavenge/ neutralize excess ROS generation, with the expectation that such intervention may not only restore mitochon-drial function but also improve DNA integrity. One of
the practical limitations of antioxidant strategies is that the clinically available antioxidants have a relatively slow reaction rate with many oxidant species, and they are not catalytic (i.e. they are consumed in the reaction). This requires chronic administration, often at high doses. Sev-eral clinical trials based on antioxidant administration have been undertaken, although with poor or discordant outcomes. Administration of alpha-tocopherol, ascorbic acid, and alpha-lipoic acid over 2 years showed neither an improvement in cognitive functioning nor a stabilization of cognitive decline in over-50 years old DS individuals (Lott et al. 2011). A randomized study on 7 months old children, orally supplemented with a mixture of antioxi-dants (selenium, zinc, vitamin A, vitamin E and vitamin C) and/or folic acids for 18 months resulted in no change in oxidative stress nor in any improvement of psycho-motor and language development (Ellis et al. 2008). A possible explanation to the ineffective antioxidant sup-plementation is that differences between normal and DS fetuses are already present at 11 weeks gestation, which implies that and at birth, any ROS-dependent damage has already occurred (Reynolds 2008). Although some promising results on learning and memory were obtained in the DS mouse model Ts65Dn after administration of antioxidants, such as vitamin E, clinical trial in DS indi-viduals older than 50 displayed no significant efficacy of Vitamin E in slowing cognitive decline (Sano et al. 2016). Coenzyme Q10
Since DS individuals display a reduction in cellular coen-zyme CoQ10 content, another line of studies aimed to test the efficiency of CoQ10 supplementation. CoQ10 is a bioactive quinone synthetized by our organism, which is ubiquitously distributed in lipid environments, acting as a lipophilic antioxidant (Tiano and Busciglio 2011). In the bloodstream, CoQ10 is associated to lipopro-teins, while at cellular level it is a component of plasma and intracellular membranes (Tiano and Busciglio 2011). It is also involved in mitochondrial bioenergetics, and CoQ10 intra-mitochondrial concentration determine the efficiency of OXPHOS chain. Due to its double role in supporting mitochondrial OXPHOS and counter-acting oxidative DNA damage, several trials have been undertaken to test the efficiency of CoQ10 using the active form ubiquinol or the oxidized ubiquinone as anti-oxidant supplement for DS. To investigate the protective effect of ubiquinone on oxidation-dependent nucleic acid modifications, Tiano and colleagues conducted three experimental studies in DS children, testing the effect of 4 mg/kg/days for 6 month, 20 months and 4 years (Tiano et al. 2011, 2012; Larsen et al. 2018). Although some age-specific reduction of DNA oxidation was observed after 20 months (Tiano et al. 2012), no effect on DNA damage
was observed in the long-term treatment study (Larsen et al. 2018).
Taken together, the above studies indicate that anti-oxidant supplementation alone does not improve clinical outcomes in DS individuals. The reasons may be related to a combination of factors. First, it is possible that ROS generation does not play as big a role in DS as presumed. Second, it is possible that some of the biological roles of ROS are beneficial and others are detrimental, and the interventions counteract both. Third, it is possible that the antioxidants, at the doses used in the trials, do not reach sufficiently high concentrations or do not react quickly or efficiently enough with the relevant ROS spe-cies. Fourth (and this applies to all therapeutic interven-tions discussed in the current section), it is possible that the pathophysiological positive feedforward events have progressed beyond the point of reversibility by the time the clinical interventions were started.
The CBS/H2S pathway
Hydrogen sulfide (H2S) is now accepted an
endog-enously produced gaseous transmitter and biological regulator. Three principal enzymes, cystathionine--lyase (CSE), cystathionine-β-synthase (CBS) and 3-mercapto-pyruvate sulfurtransferase (3-MST) are responsible for mammalian H2S biogenesis (Szabo and
Papapetropou-los 2017; Zuhra et al. 2020). CBS (encoded on chromo-some 21) and 3-MST (encoded on chromochromo-some 1) are both upregulated in DS cells (Panagaki et al. 2019; Pana-gaki et al. 2020; reviewed in Szabo 2020); accordingly, DS cells produce high levels of CBS. Indeed, early clini-cal observations have demonstrated that DS individu-als have elevated plasma and urinary levels of H2S and
its metabolites (Belardinelli et al. 2001; Kamoun et al. 2003). As reviewed recently (Szabo 2020), when cel-lular H2S levels are increased beyond an optimal
con-centration, H2S produce inhibitory bioenergetic effects
(in principle, via inhibition of mitochondrial Complex IV, but also through other mechanisms) (Panagaki et al. 2019, 2020; Szabo 2020; Nicholls et al. 2013).1 Indeed,
pharmacological inhibition or genetic silencing of CBS can restore mitochondrial function and cellular pro-liferation in DS fibroblasts (Panagaki et al. 2019) and it can improve neurological function in DS mice (Marechal et al. 2019). Moreover, excess H2S in normal fibroblasts,
or overexpression of CBS in otherwise normal mice, can induce cellular bioenergetic deficits or neurological defi-cits, respectively (Panagaki et al. 2019; Marechal et al. 2019). As reviewed recently, there are several ways to pharmacologically counteract CBS activity or the excess H2S production, and some of these approaches
(repur-posable CBS inhibitors or H2S scavengers) are potentially
translatable into the clinical arena (Szabo 2020; Kamoun 2019), although truly ‘pharmaceutical grade’ CBS inhibi-tors remain to be discovered and translated into clinical testing (Zuhra et al. 2020).
DYRK1
Dual-specificity tyrosine-phosphorylation regulated kinase 1A (DYRK1A) is localized in the “DS critical region” of chromosome 21 (Kimura et al. 2007; Noll et al. 2009; Guo et al. 2010; Song et al. 2015). As DYRK1A is involved in tau and amyloid precursor protein phospho-rylation (Kimura et al. 2007), it is a strong candidate gene for learning defects associated with Alzheimer’s disease and DS. Among others, DYRK1A also phosphorylates enzymes related to energy pathways and the methylation cycle. DYRK1A-mediated phosphorylation at the Thr356
residue inhibits glycogen synthase kinase activity. Glyco-gen synthase kinase phosphorylates and inhibits glycoGlyco-gen synthase and leads to a decrease in glycogen synthesis in the liver and muscles, along with increased blood glucose (Song et al. 2015).
DYRK1A phosphorylates and activates SIRT1, an enzyme that deacetylates proteins. SIRT1 deacetylates and activates PGC-1α transcription factor leading to mitochondrial biogenesis (Guo et al. 2010). DYRK1A overexpression also reduces homocysteine levels inde-pendently of CBS expression. It increases the S-aden-osyl-l-homocysteine hydrolase activity in the reverse direction leading to a diminution of homocysteine (Nicholls et al. 2013). Further studies are needed to clar-ify whether these alterations are involved in learning defi-ciency observed in DS or other targets of DYRK1A are more critical. Nevertheless, it was found that pharma-cological inhibition of brain DYRK1A can correct rec-ognition memory deficits in three DS mouse models, all expressing an extra copy of Dyrk1a (Nguyen et al. 2018; Kim et al. 2016). Clinical trials in adults treated with epi-gallocatechin-3-gallate, a natural DYRK1a inhibitor from green tea, demonstrated a modest, but detectable gain of cognition in DS individuals (de la Torre et al. 2014, 2016; Xicota et al. 2020).
1 Technical footnote: with a few recent exceptions (Panagaki et al. 2019;
Pana-gaki et al. 2020), most of the studies investigating mitochondrial function, or specific function of various mitochondrial complexes in DS utilized isolated mitochondrial preparations (in many cases also using high saturating concen-trations of electron donors). These experiments would ‘miss’ the inhibitory effect of a gaseous mediator, such as H2S, which would no longer be present
in the mitochondria after subcellular isolation and in vitro processing. Moreo-ver, none of the studies focusing on the expression of mitochondrial electron complexes (e.g. Table 2) would “see” a H2S-mediated inhibition of Complex
IV, because this occurs on the enzymatic activity level, and not on the level of protein expression. And yet, such an inhibitory effect can markedly sup-press the activity of the entire mitochondrial electron transport, and, in our opinion, is therefore more functionally relevant than the expression (omics) type surveys.
Caloric restriction
The prevalence of obesity among individuals with DS is relatively high compared to the general population (Bronks and Parker 1985; Rubin et al. 1998; Melville et al. 2005; Fonseca et al. 2005; González-Agüero et al. 2011; Soler and Xandri 2011; Bertapelli et al. 2016). To explain is phenomenon, several hypotheses have been proposed, but the underlying mechanisms have not yet been elu-cidated. The following factors have been proposed to increase the risk of obesity in DS: (1) Leptin is a hormone secreted by adipocytes, acting in the hypothalamus to suppress appetite. (2) High leptin levels in obese subjects, generally thought to be the outcome of increased leptin resistance. (3) Children with DS had increased leptin for percent body fat than their unaffected siblings. This dif-ference may contribute to the increased risk of obesity in children with DS (Magge et al. 2008). Resting energy expenditure represents the amounts of calories required for a 24-h period by the body during a non-active period. Lower resting energy expenditure could partially explain the increased risk of obesity in youth with DS. Hill and colleagues found that children with DS had lower rest-ing energy expenditure compared to siblrest-ings without DS (Hill et al. 2013; Mendonca et al. 2010). Whether traditional dietary interventions (e.g. caloric restriction) have the potential to improve metabolic status (beyond improving BMI, for instance), remains to be seen.
Low sulfur diet
Generally, a low sulfur diet involves the reduction of meats, dairy products, eggs, onions, peas and cruciferous vegetables. The primary aim of a potential low sulfur diet would be to reduce the generation of H2S which is the
result of increased CBS and 3-MST activity (see above). Amino acids, methionine and cysteine are the primary sources of sulfur. A mathematical model (Orozco et al. 2019) suggests that a low-methionine diet might offer a perspective for reversing the metabolic imbalance in DS, but clinical investigations remain to be conducted to test this theory.
Vitamin supplementation (folate and cobalamine)
Folate is an important vitamin that contributes to cell division and growth. Studies on the effect of vitamin supplements on metabolic or clinical outcomes in DS showed limited, if any, evidence of improvement (Lumley et al. 2001; Blehaut et al. 2010).
Choline supplementation
Supplementing the maternal diet of Ts65Dn mice with choline during pregnancy and lactation substantially improved attention (Strupp et al. 2016). Therefore, cho-line metabolism might be an important target in DS.
However, there are no clinical studies on choline supple-mentation in DS.
Amino acid supplementation
Lejeune et al. has found differences in serine concentra-tions between control children and DS individuals and recommended a dietary supplementation (Lejeune et al. 1992). Many of the currently marketed food supplement formulas for DS include amino acids.
Zinc and selenium
Several studies have shown zinc and selenium serum lev-els are decreased in DS (Barañano and Hartman 2008). These trace elements are involved in the synthesis and regulation of the activity of proteins and enzymes that are necessary for our endogenous antioxidant response (Saghazadeh et al. 2017; Parisotto et al. 2015). It has been suggested that antioxidant therapies might have some benefit for DS individuals, although the clinical trials have not been particularly encouraging (see above). Ketogenic diet
The ketogenic diet contains high fat, moderate protein, and very low carbohydrate, which induce the hepatic production of ketone bodies. Ketone bodies cross the blood–brain barrier and are converted to acetyl coen-zyme A, enters the citric acid cycle to produce energy for the brain. The ketogenic diet traditionally has been used in cases of intractable epilepsy (Barañano and Hart-man 2008). As epilepsy is a common comorbidity in DS and it is also thought to contribute to cognitive dysfunc-tion for cognitive decline in DS, it was proposed that the ketogenic diet may be a therapeutic option for cognitive decline in DS (Kaneko et al. 2018).
Physical exercise
Lower physical activity due to overall weakness has been well documented in DS (Cioni et al. 1994; Croce et al. 1996; Carmeli et al. 2002; Hawli et al. 2009; Bala et al. 2018; Dupre and Weidman-Evans 2017; Coelho-Junior et al. 2019; Aguiar et al. 2008; Pastore et al. 2000; Phil-lips et al. 2013). Consumption of high carbohydrate and nutrient-poor food products is more frequent in DS children as these products are easy to chew. The increased expression and activity of CBS in children with DS results in an increased plasma level of cysteine (Pogribna et al. 2001). Plasma concentrations of cysteine correlate strongly with fat mass, but the mechanism of how increased cysteine levels induce fat accumulation is unclear (Elshorbagy et al. 2012). One can also postulate that beta-oxidation of fatty acids in DS is impaired as the mitochondrial electron transport chain is not function-ing properly, producfunction-ing increased acyl-carnitine levels.
Physical exercise may improve DS outcomes through effects on the mitochondria. It is known that electron transport chain activity i.e. mitochondrial function, and mitochondrial numbers can improve with exercise train-ing (Menshikova et al. 2006). Mitochondrial function is regulated by mitochondrial matrix free Ca2+
concentra-tion. Stimuli such as action potentials or hormone-recep-tor bindings can trigger a signal transduction process leading to Ca2+ oscillations between intracellular
orga-nelles (Pecze et al. 2015). This leads to the activation of mitochondrial dehydrogenases (Denton 2009). Moreo-ver, mitochondria undergo several structural changes in response to the energetic challenge. High energy demand induces mitochondrial fusion allowing efficient mixing of mitochondrial content within an extended mitochondrial network (Westermann 2012). Activation of the PGC-1α transcription factor, the “master regulator” of mitochon-drial biogenesis is also triggered by physical exercise (Drake et al. 2016). PGC-1α regulates the expression of nuclear genes encoding mitochondrial proteins, thereby regulating mitochondrial content and function (Hood et al. 2016). All of the abovementioned changes would be expected to exert beneficial effects in DS individuals. Functional fitness in DS can be meaningfully improved through physical exercise (Dodd and Shields 2005). For instance, a non-randomized controlled trial has found that the functional fitness of adults with DS improved with an aquatic training but was insufficient to improve balance and upper body strength (Boer and de Beer 2019).
Implications, conclusions and outlook
Since mitochondrial function is the crucial contribu-tor to ATP generation in mammalian cells, and ATP is essential to the maintenance of all fundamental cellular function in resting cells, (and even more so in dividing ones), one would expect that a significant impairment of cellular ATP synthesis would result in significant sup-pression of all fundamental cellular functions, including cellular division cell proliferation, maintenance of mem-brane potential, and—for neurons—cellular excitability ability to form synapses, release neurotransmitters and induce post-synaptic currents. Indeed, multiple stud-ies demonstrate that DS cells have an impairment in all of the above-mentioned processes, and there is evidence that various interventions aimed at restoring mitochon-drial activity can improve these functional parameters (Izzo et al. 2017; Panagaki et al. 2019; Park et al. 2000; Jablonska et al. 2006; Contestabile et al. 2007; Trazzi et al. 2011; Valenti et al. 2013; Weick et al. 2013; Bhattacharyya et al. 2009; Stern et al. 2015; Coskun et al. 2017; Huo et al. 2018; Mizuno et al. 2018; Mollo et al. 2019).
A generalized energetic deficit would also predict dis-ruptions in the cell cycle and impairment of nuclear and mitochondrial DNA repair (all extremely energetically demanding processes), contributing to genomic instabil-ity. Indeed, there is direct experimental evidence show-ing significant impairment of DNA repair and cell cycle in human DS cells and in animal models of DS (e.g. Con-testabile et al. 2007; Pincheira et al. 1994; Druzhyna et al. 1998; Maluf and Erdtmann 2001; Rosner et al. 2003; Nec-chi et al. 2015; Wang et al. 2016). While various com-pensatory bioenergetic processes (e.g. an upregulation of glycolysis) may be able to ‘make up for’ some of the ‘missing’ ATP), the consequences of the metabolic pseu-dohypoxia may be more severe when the cells experi-ence sudden increases in energetic demand. For instance, it is conceivable that such fundamental bioenergetic mechanisms may contribute to the well-documented impairment of exercise tolerance in DS individuals (see: Introduction). An impaired mitochondrial function in DS may also predict that DS tissues have a reduced O2
uti-lization; for example, measured as whole-body-O2
con-sumption, or as tissue O2 extraction (i.e. quantification
of arteriovenous oxygen difference). Such measurements are commonplace in the field of metabolic disease and in the field of sepsis (where, in many pathophysiological conditions, the tissues’ ability to extract O2 is impaired;
for instance, in sepsis, due to a metabolic ‘poisoning’ of the mitochondria) (Carré and Singer 2008); indeed, the available body of clinical data in DS indicates that a simi-lar reduced O2 utilization is characteristic of DS
individu-als (Seron and Greguol 2014; Mendonca et al. 2018). The same process (impaired mitochondrial function, and the resulting compensatory upregulation of glycolysis) would also produce increases in systemic lactate production (again, a common observation in septic shock, where, in fact, elevated lactate levels are excellent predictors of mortality); indeed, our meta-analysis has clearly demon-strated that DS cells produce increased levels of lactate (Fig. 4c) and clinical studies have also reported elevated plasma lactate levels in DS individuals (Caracausi et al. 2018; Gross et al. 2019).
It is plain to see how a generalized cellular bioener-getic deficit (pseudohypoxia) would predispose to vari-ous embryonic developmental problems and to varivari-ous fundamental functional disturbances in later life. These problems would be expected even on the background of a (otherwise unperturbed) organism (i.e. in the absence of any additional gene dysregulation); it is obvious that a globalized bioenergetic deficit would be even more del-eterious in cells where hundreds of genes and gene prod-ucts are dysregulated due to the gene dosage effect of chromosome 21, as well as the even larger number of per-turbances of genes encoded on all other chromosomes.
Let’s consider one single bioenergetic disturbance, the inhibition of mitochondrial Complex IV activity (which is reversibly inhibited by H2S and irreversibly inhibited
by cyanide). It is well documented in the environmental toxicology literature that even a partial inhibition of this enzyme (caused by H2S or cyanide administration) can
cause various developmental and neurodevelopmental defects in developing embryos (Singh 1981; Tewe and Maner 1981; Frakes et al. 1986; Hannah and Roth 1991; Skrajny et al. 1992; U.S. EPA 2010); Complex IV inhibi-tion also produces significant bioenergetic and funcinhibi-tional (including neurocognitive) defects in juvenile and adult organisms (Egekeze and Oehme 1980; Persson et al. 1985; Nicholson et al. 1998; Schneider et al. 1998; Nam et al. 2004; Fiedler et al. 2008; Reed et al. 2014; Tshala-Katum-bay et al. 2016). In conditions with insufficient energy production in the brain, convulsions also frequently occur (Folbergrovà et al. 1981; Nakanishi et al. 1991; Shukla et al. 1989). Indeed, there is a significant increase in the incidence of convulsive events in DS individuals (Bull et al. 2011; Barca et al. 2014).
A global pseudohypoxia, of course, would be also expected to be a proximate cause of neurological dys-function (since neurons are highly ATP-dependent cells, highly susceptible to disturbances in cellular bioener-getic processes) (Hoyer 1990; Zeiger et al. 2011; Funes et al. 2014; Nicholls et al. 2015; Hebert-Chatelain et al. 2016; Plotegher et al. 2020). We hypothesize that neu-ronal pseudohypoxia may also potentially contribute to the process of delayed neurodegeneration (Alzheimer-like symptoms) in DS. Indeed, DS cells exhibit significant problems with protein processing (Aivazidis et al. 2017), and it is well documented that cellular bioenergetic defi-cit, on its own, can directly causes problems with the processing of various cellular proteins, including amyloid beta (Hoyer 1993; Gabuzda et al. 1994; Meier-Ruge et al. 1994; Busciglio et al. 2002; Ferreira et al. 2010; Wilkins and Swerdlow 2017). It is conceivable that the chronic cellular bioenergetic deficit in DS contributes to dysfunc-tion amyloid processing, which, in turn, may culminate in an Alzheimer’s-like neurodegenerative process. This hypothesis, nevertheless, remain to be further investi-gated in future studies.
In the current analysis, we have primarily focused on studies utilizing human DS cells or on clinical studies on DS individuals (as opposed to animal studies). There are, in fact, multiple DS mouse models available (reviewed in Gupta et al. 2016; Herault et al. 2017; Muñiz Moreno et al. 2020), and these models do mimic some of the fea-tures of the human DS. However, in mice, the genes that are on human chromosome 21 are localized on 3 differ-ent chromosomes, and in most published studies utiliz-ing various DS mice strains use animal models that do
not overexpress all of the human-DS genes. Therefore, in some case these models are useful and potentially clini-cally translatable, while in others they may not be. For instance, one of the most commonly used mouse model (Ts65Dn) overexpresses DYRK1, and therefore it may be considered an adequate model of the human DS (at least as far as DYRK1-related processes are concerned). How-ever, the same mouse not overexpress the mouse-equiva-lent of the human cbs gene; given the emerging evidence for the potential role of CBS and H2S in DS, the utility
of this particular mouse strain to study H2S-related
processes is questionable. Clearly, future animal stud-ies of DS should utilize mice where the set of ‘gene dos-age’ closely approximates the human condition. While such animals (containing segments of all relevant 3 extra mouse chromosomes) have been created, they are frag-ile and have significant fertility problems, limiting their utility for experimentation (Yu et al. 2010). There are also mouse models overexpressing the human chromo-some 21, or part of it (O’Doherty et al. 2005; Miyamoto et al. 2014; Kazuki et al. 2020); while these animals have the ‘correct’ extra genes, these are human genes encod-ing human proteins: the interaction of these human proteins with the mouse proteins is likely to be different than human–human or mouse-mouse protein–protein interactions, which introduces a significant complicat-ing factor. Clearly, the field of DS research requires better animal tools, and undoubtedly, such tools will be forth-coming in the future.
The radical therapy of DS, i.e. complete switching off the extra chromosome in all somatic cells is, of course, the logical “definitive therapeutic solution”. (Although, even in this case, one would have to consider what would be the ideal timing of such intervention, perhaps intrau-terine, because by the time of birth, significant, perhaps irreversible developmental problems can occur). Such studies have been pursued by several laboratories and turning off chromosome 21 has been successful in cell-based models (Jiang et al. 2013; Mentis 2016; Chiang et al. 2018). However, it remains unclear if/when these technical advances (sometimes known as ‘chromosome therapy’) would be clinically translatable. In the mean-time, continuing experimental studies, both omics-based and hypothesis-driven, are expected to further elucidate already identified targets, identify potentially translatable pharmacological or nutritional tools to target them, and to identify novel targets for pharmacological interven-tions in DS.
The (generally) disappointing experience with clini-cal trials in DS, so far, can be attributed to many differ-ent factors (Gardiner 2014; Lee et al. 2020a, b), some of these issues relate to clinical trial design (duration, dos-age), while others may relate to the fact that possibly in
![[PDF] Cours complet pour Apprendre à programmer en Python | Formation informatique](data:image/gif;base64,R0lGODlhAQABAIAAAP///wAAACH5BAEAAAAALAAAAAABAAEAAAICRAEAOw==)