HAL Id: cea-01988827
https://hal-cea.archives-ouvertes.fr/cea-01988827
Submitted on 22 Jan 2019
HAL is a multi-disciplinary open access
archive for the deposit and dissemination of
sci-entific research documents, whether they are
pub-lished or not. The documents may come from
teaching and research institutions in France or
abroad, or from public or private research centers.
L’archive ouverte pluridisciplinaire HAL, est
destinée au dépôt et à la diffusion de documents
scientifiques de niveau recherche, publiés ou non,
émanant des établissements d’enseignement et de
recherche français ou étrangers, des laboratoires
publics ou privés.
Single-cell bacterium identification with a SOI optical
microcavity
M. Tardif, J.-B. Jager, P.R. Marcoux, K. Uchiyamada, E. Picard, E. Hadji, D.
Peyrade
To cite this version:
M. Tardif, J.-B. Jager, P.R. Marcoux, K. Uchiyamada, E. Picard, et al.. Single-cell bacterium
identi-fication with a SOI optical microcavity. Applied Physics Letters, American Institute of Physics, 2016,
109 (13), pp.133510. �10.1063/1.4963070�. �cea-01988827�
Single-cell bacterium identification with a SOI optical microcavity
M. Tardif 1,2, J-B Jager 2, P.R. Marcoux 3 , K. Uchiyamada4, E. Picard 2, E.Hadji2 , D. Peyrade 1
1Univ. Grenoble Alpes, CNRS, LTM - Micro & Nanotechnologies for Health, 38054 Grenoble Cedex 9, France
² CEA & Univ. Grenoble Alpes, INAC-SP2M-SINAPS, 38000 Grenoble, France 3 CEA, LETI-DTBS-SBSC-LCMI/LBAM, 38054 Grenoble Cedex 9, France
4Graduate School of Pure and Applied Sciences, University of Tsukuba, 1-1-1 Tennodai, Tsukuba, Ibaraki 305-8573, Japan
Photonic crystals and microcavities can act as on-chip nano-optical tweezers for identification or manipulation of biological objects. So far, virus and bacteria optical trapping has been achieved, their presence in the vicinity of the optical resonator being deduced from a shift of the resonant wavelength. Here we show that bacteria can not only be trapped but identified as well if the trapping time is long enough. A silicon on insulator microcavity with a properly tuned quality factor allows to achieve enhanced trapping times. By combining spatial and temporal observation of bacteria – cavity interaction, the optical identification of three different kinds of bacteria is demonstrated.
Biological objects are strategic components for medical and pharmaceutical development, faster clinical diagnosis and food processing control. The field of photonics has proven to be extremely suitable for the study of these objects. The first tool that allowed their trapping and handling is optical tweezers,1,2 based on the concentration
of a laser beam through a microscope objective. Unfortunately, this method is limited by the macroscopic scale of the implemented set-up and especially by the damage caused on cells3,4 and bacteria5–7 during optical
manipulation. On the contrary, the evanescent field of on-chip optical resonators offers a low light intensity energy that could minimize biological object damage. Therefore, they are more suitable for biomolecules,8–12 virus13,14 and
bacteria15,16 manipulation, at a microscopic scale. For the
past 20 years many designs of optical resonators have emerged. From the 1D17,18 and 2D19–21 photonic crystals to
toroid,22–24 ring,25 cylindrical26 and microspherical27,28
resonators, extremely narrow resonances and quality factors as high as 109 have been reached. With their
integration in optofluidic devices, these structures allow micro and nano objects manipulation29–35 and biological
object detection.37,38 More specifically, at the cell scale,
despite the low index contrast with liquid medium, it has been proven that bacteria trapping is achievable on H-L types PhCs microcavities.15 For these structures, the trap
stiffness was quantified and the confined Brownian motion of the bacteria has revealed power dependence to the light power excitation.15 In this direction, Lin et al.
have demonstrated that this optical trap do not affect
Escherichia coli viability by studying its photothermal
damage. Thus, according to the theory, designed lineic microcavities appear to be suitable tools to manipulate bacteria.
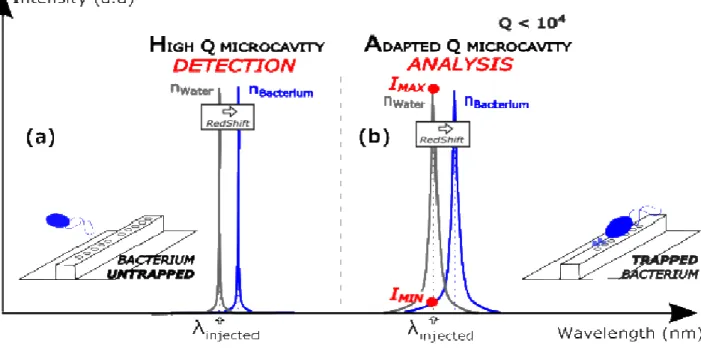
Most of literature work has been focused on detection where high quality factor structures are required to precisely detect the shift of the resonance wavelength due to refractive index variation near the resonator12,36,37
(Figure 1(a)). What we propose here is the use of a broader resonance, adapted for single bacterium analysis and label-free identification (Figure 1(b)). To achieve this condition, the resonance must be wide enough to have an overlap between the resonance without bacterium and the resonance when the bacterium interacts with the field in the cavity (redshift).
Starting from this statement, we investigate an optical method based on microcavities to perform single-cell characterization on bacteria. The analysis of the cell Brownian motion video in the trap combine with the optical structure transmission signal allow a fine characterization of the cell behavior. Moreover, by analysis the fluctuations of the transmitted signal over time during bacteria trapping, we expect to observe variations between bacteria phenotypes.
A 1D microcavity resonator is made on SOI substrate (250 nm / 2 µm / 700 µm) by combining electron beam lithography and reactive-ion etching. The two mirrors are designed for mode adaptation within the cavity38 (Figure
2(a)) in order to get a quality factor of 4000. In this study we used the same optical structure for all the experiments. By injecting the resonance wavelength in this structure (laser at λres = 1.5 µm, injected power Pinj = 10 mW, and
linewidth Lw = 10-3 pm), an intense and confined
electromagnetic field is built in the cavity. The evanescent part of this field above the cavity creates optical gradient forces able to trap and manipulate colloidal objects. Above the optical structures, a PDMS fluidic system leads swimming objects to the evanescent field. It consists of a
100µm thick PDMS film with molded µ-fluidic channel in which we place a drop of water/bacteria solution. Then it is covered by a 150 µm thick layer of glass. This optofluidic chip is shown in Figure 2(b). A polarization-maintaining fiber enables the optical coupling of the light from a tunable laser to the microcavity. Two microscope objectives are placed on-top/in-line with the chip and connected to detection devices, which allows spatial (images) and temporal (signal) characterization of the trapping. Images of the cavity are created by a microscope connected to a CCD camera, with a time resolution of 1/24s. To track bacterium trajectories we detect their position on every recorded image for a relevant duration (few seconds), using tracking macro of Fiji (image processing package of ImageJ).39 This analysis is shown
in Figure 2(b-SPATIAL).
The signal transmitted by the optical structure is detected by a photodiode, increased by a trans-impedance amplifier and displayed on an oscilloscope. The oscillations observed Figure 2(b-TEMPORAL) are due to the shift of the resonance wavelength of the optical structure in presence of bacterium above the cavity. Indeed, the resonance wavelength depends not only on the optical index of the cavity, but also on the index of the environment. When the bacterium interacts with the electromagnetic field in the cavity, the environmental index ranges from nwater = 1.33 (bacterium outside the
cavity, only water above it) to 1.368 < nbacterium < 1.413
(bacterium exactly above the cavity).40 This phenomenon
is shown in Figure 1: it induces a less than 1 nm shift of the resonance wavelength from the grey to the blue curve. As we keep injecting the same wavelength during all trapping experiments (resonance at nwater), the signal will
oscillate between the two intensity values IMIN and IMAX
while the bacterium oscillate between two positions: trapped above and untrapped around the cavity.
By this method, we are able to record the position of the trapped object and the fluctuation of the transmitted signal simultaneously.
The objects under study are the following bacteria, shown Figure 2(c): Staphylococcus epidermidis diplococcus,
Escherichia coli and Bacillus subtilis aggregate. They
were selected for their size, close to the previously studied polystyrene beads30,41,42 and the differences in
morphology and Gram-type between them (one Gram+ bacillus, one Gram- bacillus and one Gram+ coccus). An
E. coli cell and a diplococcus of S. epidermidis have
equivalent size and shape: oval shape and size of 1 µm x 2
µm, compared to a more elongated shape of 1 µm x 7 µm
for B. subtilis (aggregate). E. coli and B. subtilis have flagella, a molecular motor they use to propel themselves through an aqueous medium. Bacterial strains (E. coli ATCC 117775, S. epidermidis ATCC 14990, B. subtilis ATCC 11774) were obtained from KwikStik lyophilized reference strains (Microbiologics, St. Cloud, MN).
Starting from a culture on agar media (COS or TSA, bioMérieux) after 24h of incubation (37°C), a 0.5 McF suspension (Densimat, bioMérieux) was prepared in API Suspension medium (bioMérieux).
We present now the two analysis methods of bacteria trapping, leading to their characterization.
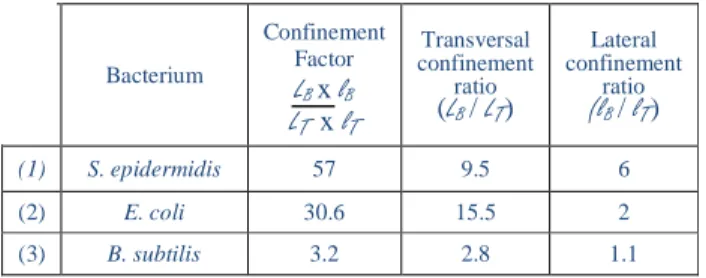
Bacterium Confinement Factor LB x lB LTx lT Transversal confinement ratio (LB/ LT) Lateral confinement ratio (lB/ lT) (1) S. epidermidis 57 9.5 6 (2) E. coli 30.6 15.5 2 (3) B. subtilis 3.2 2.8 1.1
Table 1. Numerical analysis of spatial behavior of trapped and
non-trapped bacteria. The transversal direction is parallel to the x axis and the lateral one is parallel to the y axis.
The Brownian motion of each type of studied bacterium and the effect of trapping on its trajectory is shown in Figure 3. We characterize the effect of the trap by a parameter that we call “confinement factor” which consists in the ratio of the rectangular area covered by bacteria position
(L
xl
) without and with trapping. The trapping is demonstrated by the reduction of the displacement area (confinement factor between 3.2 and 57) and its major effect is a transversal confinement (area reduced by a factor ranging from 2.8 to 15.5, in comparison to 1.1 to 6 for lateral confinement).In this microcavity, previous studies have evidenced that the evanescent field is spread over two maxima of electromagnetic field.42We observe in Figure 3(b) that S.
epidermidis and E. coli interact with one maximum of the
field at a time (S. epidermidis stays on one while E. coli keep switching from one maxima to another). This is allowed by their reduced size compared to the size order of the field maxima of the cavity. The flagella (E. coli and
B. subtilis) seem to induce a larger displacement in the
trap and the ability to interact with several maxima of the field. This behavior is consistent with the increased motility of the flagellated bacteria and with the shape of the electromagnetic field in the microcavity.
In Table 1, more details about confinement are shown. It highlights a stronger effect of the trap on S. epidermidis and E. coli, than on B. subtilis (confinement factor are 57, 30.6 and 3.2 respectively). This table also outlines a more effective confinement along transversal axis than along lateral one. For S. epidermidis lateral and transversal confinement are of the same order of magnitude, which can be linked to the spherical shape of the bacterium. On the other hand, for E. coli and B. subtilis the transversal confinement prevails. It is consistent with the behavior of the bacteria in the trap: they align on the structure, with their longer dimension parallel to the cavity. From this we can infer that the lateral and transversal contributions provide information on the shape of the object and its symmetry. The size and shape of B. subtilis induce only
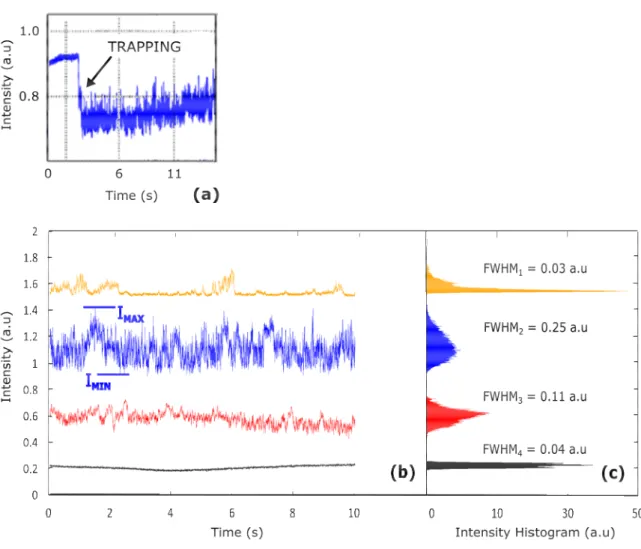
transversal confinement (lateral confinement of 1.1), which explains the low effectiveness of the trap on that bacterium (confinement factor of 3.2) in accordance with experimental results (trapping duration under 10 minutes against more than 1 hour for S. epidermidis and E. coli). Finally, each type of the three investigated bacteria species owns a very distinct spatial signature, which is linked to their size, shape (symmetry) and flagella. In parallel, monitoring the optical signal transmitted by the cavity (Figure 4) enables an accurate detection of the trapping effectiveness: high frequency oscillations and intensity drop of about 20% (Figure 4(a)).
On Figure 4(b) the temporal variation of the optical signal transmitted by the microcavity during the trapping of the three kinds of bacteria is shown. It is compared to the signal detected in the same conditions without trapping. Because the amplitude is the most relevant criteria to discriminate these curves, we calculate the histogram function of the transmitted signal (Figure 4(c)). Its characteristic elements are the full width at half maximum (FWHM) and the probability to have each intensity value.
E. coli is characterized by a FWHM at least twice larger
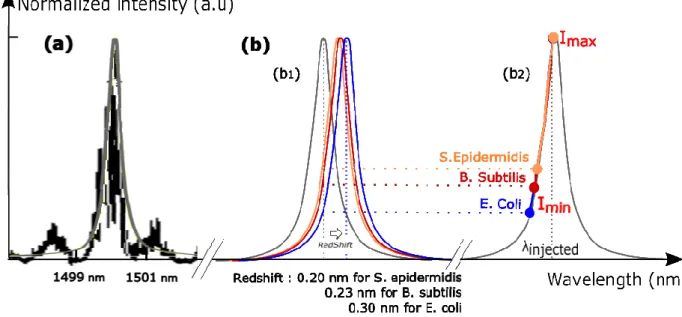
than the two other bacteria. It can be linked to its large lateral displacement in the trap (Figure 3(b,blue curve)). On the contrary, S. epidermidis trapping signal has a very low FWHM which highlights the unique position of equilibrium of the bacterium (high probability for one intensity value), matching with one field maximum. Finally, the optical signal transmitted by the adapted SOI microcavity is self-consistent for bacteria discrimination in this example. We highlighted here that amplitude is the most relevant criteria to differentiate the optical signal transmitted by the microcavity, in which the substantial part of the information is located below 15 Hz. It provides information on the maximum and minimum intensity values of the signal shown in Figure 1 and Figure 4. On Figure 5, these Imax and Imin values are represented on the resonance peak of the microcavity, at the injected wavelength.
If we consider that the quality factor remains constant during the trapping (low change of optical index when the microcavity environment is water or bacteria), it allows to calculate the redshift of the resonance wavelength between the two extreme positions of the bacteria in the trap (from the trap center (Imin) to its edge (Imax)). This redshift is characteristic of bacterium phenotype, as represented Figure 5(b1): its value ranges from 0.20 nm
for S. epidermidis to 0.30 nm for E. coli.
Each colored peak represents the resonant mode available according to the type of trapped bacterium. By projecting these curves on the resonance peak of the optical trapping structure we are able to assign to every type of bacterium a specific area of the peak (Figure 5(b2)) and discriminate
them.
Finally, the two methods of characterization (spatial and temporal) are consistent with each other: the displacement of E. coli on the two evanescent field maxima can be linked to the large amplitude of its trapping signal and the higher value of the FWHM of its histogram function. S.
epidermidis oscillates close to its balance position (one
field maximum), matching to one transmitted intensity value of highest probability.
In this paper we show that planktonic single cell bacterium can by trapped by the evanescent field of a properly tuned microcavity. Both spatial (Brownian and partially-trapped motions) and temporal (optical transmission measurement) methods are relevant to study finely the bacterium behavior within the trap.
The spatial signature demonstrates that morphological properties of bacteria (size, shape and presence of flagella) can be identified thanks to the so-called confinement factor parameter.
The temporal signature through the analysis of the fluctuations of the optical transmitted signal over time during bacteria trapping allows us to identify bacteria phenotypes.
Compared to the spatial characterization, the temporal method requires only cavity transmission measurements. Thus, this promising label-free technic that can be performed in a much more compact way, with a smaller footprint, in a device scheme might be suitable for a reduce cost fast analysis device.
In the future we plan to extend this study to a larger number of bacteria, with different shapes, sizes and overall properties.
Acknowledgement
The authors would like to express their gratitude to Pascal GENTILE and Christophe PIN for imaging and preparation of bacteria. A thank you is also extended to Julien CORDEIRO for his blender images and to Patricia LAURENT for the bacteria samples preparation. J.B. J. thanks the technical group of the “Plateforme Technologique Amont” of Grenoble for their help in nanofabrication.
Bibliography
1 A.Ashkin and J.M. Dziedzic, Science 235, 1517 (1987) 2 J. Enger, M. Goksör, K. Ramser, P. Hagberg, and D.
Hanstorp, Lab Chip 4, 196 (2004).
3 K. Konig, H. Liang, M.W. Berns, and B.J. Tromberg,
Opt. Lett. 21, 1090 (1996).
4 Y. Liu, G.J. Sonek, M.W. Berns, and B.J. Tromberg,
Biophys. J. 71, 2158 (1996).
5 K.C. Neuman, E.H. Chadd, G.F. Liou, K. Bergman, and
S.M. Block, Biophys. J. 77, 2856 (1999).
6 M. Ericsson, D. HANSTORP, P. HAGBERG, and J.
ENGER, J. Bacteriol. 182, 5551 (2000).
7 M.B. Rasmussen, L.B. Oddershede, and H. Siegumfeldt,
Appl. Environ. Microbiol. 74, 2441 (2008).
8 S. Mandal, J.M. Goddard, and D. Erickson, Lab Chip 9,
2924 (2009).
9 S. Lin and K.B. Crozier, ACS Nano 7, 1725 (2013). 10 M.R. Lee and P.M. Fauchet, Opt. Express 15, 4530
(2007).
11 S. Pal, P.M. Fauchet, and B.L. Miller, Anal. Chem. 84,
8900 (2012).
12 F. Vollmer, D. Braun, A. Libchaber, M. Khoshsima, I.
Teraoka, and S. Arnold, Appl. Phys. Lett. 80, 4057 (2002).
13 P. Kang, P. Schein, X. Serey, D. O’Dell, and D.
Erickson, Sci. Rep. 5, 12087 (2015).
14 F. Vollmer, S. Arnold, and D. Keng, Proc. Natl. Acad.
Sci. U. S. A. 105, 20701 (2008).
15 T. van Leest and J. Caro, Lab Chip 13, 4358 (2013). 16 S. Chan, S.R. Horner, P.M. Fauchet, and B.L. Miller, J.
Am. Chem. Soc. 123, 11797 (2001).
17 P.B. Deotare, M.W. McCutcheon, I.W. Frank, M.
Khan, and M. Lončar, Appl. Phys. Lett. 94, 1 (2009).
18 M.W. McCutcheon and M. Loncar, Opt. Express 16,
19136 (2008).
19 M. Notomi, E. Kuramochi, and H. Taniyama, Conf.
Proc. - Lasers Electro-Optics Soc. Annu. Meet. 16, 689 (2008).
20 Y. Akahane, T. Asano, B. Song, and S. Noda, Nature
425, 944 (2003).
21 Z. Zhang and M. Qiu, Opt. Express 12, 3988 (2004). 22 J.B. Jager, V. Calvo, E. Delamadeleine, E. Hadji, P.
Noé, T. Ricart, D. Bucci, and A. Morand, Appl. Phys. Lett. 99, 2014 (2011).
23 T.J. Kippenberg, S.M. Spillane, and K.J. Vahala, Appl.
Phys. Lett. 85, 6113 (2004).
24 D.K. Armani, T.J. Kippenberg, S.M. Spillane and
K.J.Vahala, 421, 925 (2003).
25 T. Baehr-Jones, M. Hochberg, C. Walker, and A.
Scherer, Appl. Phys. Lett. 85, 3346 (2004).
26 I. Grudinin, A. Savchenkov, A. Matsko, D. Strekalov,
V. Ilchenko, and L. Maleki, IQEC, Int. Quantum Electron. Conf. Proc. 2005, 380 (2005).
27 M.L. Gorodetsky and V.S. Ilchenko, J. Opt. Soc. Am. B
16, 147 (1999).
28 L. Collot, V. Lefèvre-Seguin, M. Brune, J.M. Raimond,
and S. Haroche, Europhys. Lett. 23, 327 (2007).
29 A. Rahmani and P.C. Chaumet, Opt. Express 14, 6353
(2006).
30 C. Pin, B. Cluzel, C. Renaut, D. Peyrade, E. Picard, E.
Hadji, and F. De Fornel, Appl. Phys. Lett. 105, 2012 (2014).
31 C. Renaut, B. Cluzel, J. Dellinger, L. Lalouat, E.
Picard, D. Peyrade, E. Hadji, and F. de Fornel, Sci. Rep. 3, 2290 (2013).
32 S. Mandal, X. Serey, and D. Erickson, Nano Lett. 10,
99 (2010).
33 N. Descharmes, U.P. Dharanipathy, Z. Diao, M. Tonin,
and R. Houdre, Lab Chip 13, 3268 (2013).
34 S. Lin, E. Schonbrun, and K. Crozier, Nano Lett. 10,
2408 (2010).
35 H. Cai and A.W. Poon, Opt. Lett. 35, 2855 (2010). 36 M.S. Luchansky and R.C. Bailey, Anal. Chem. 84, 793
(2012).
37 F. Vollmer, L. Yang, and S. Fainman, Nanophotonics 1,
267 (2012).
38 P. Velha, E. Picard, T. Charvolin, E. Hadji, J.C. Rodier,
P. Lalanne, and D. Peyrade, Opt. Express 15, 16090 (2007).
39 J. Schindelin, I. Arganda-Carreras, E. Frise, V. Kaynig,
M. Longair, T. Pietzsch, S. Preibisch, C. Rueden, S. Saalfeld, B. Schmid, J.-Y. Tinevez, D.J. White, V. Hartenstein, K. Eliceiri, P. Tomancak, and A. Cardona, Nat. Methods 9, 676 (2012).
40 J.B. Bateman, J. Wagman, and E.L. Carstensen,
Kolloid-Zeitschrift Zeitschrift F??r Polym. 208, 44 (1966).
41 C. Renaut, J. Dellinger, B. Cluzel, T. Honegger, D.
Peyrade, E. Picard, F. De Fornel, and E. Hadji, Appl. Phys. Lett. 100, 1 (2012).
42 C. Pin, B. Cluzel, C. Renaut, E. Picard, D. Peyrade, E.
FIG. 1. Redshift of the microcavity resonance wavelength in presence of a bacterium above it.
(a) High quality factor structure, ideal for detection of the target object, no trapping of bacteria.
(b) Intermediate quality factor structure, ideal for bacteria trapping and analysis.
FIG. 2. (a) SEM image of the single microcavity used for all the experiments. (b) Trapping Set-up:
fluidic system on a 1D PhC, light injected in the optical structure with a polarized fiber and recorded
on structure output (TEMPORAL). Second
trapping analysis way by microscopy column above the
cavity (SPATIAL). The measurements related to E. coli are shown in blue and those associated with
S. epidermidis are shown in orange, (c) SEM images of the under study bacteria: (1) diplococcus of
Staphylococcus epidermidis, (2) Escherichia coli and (3) aggregate of Bacillus subtilis.
(c2) (c3)