Yan Sun, Oliver Bossdorf, Ramon Diaz Grados, ZhiYong Liao, Heinz Müller-Schärer. 2020. Rapid genomic and phenotypic change in response to climate warming in a widespread plant invader. Global Change Biology.
Appendix: Supplementary table and figures.
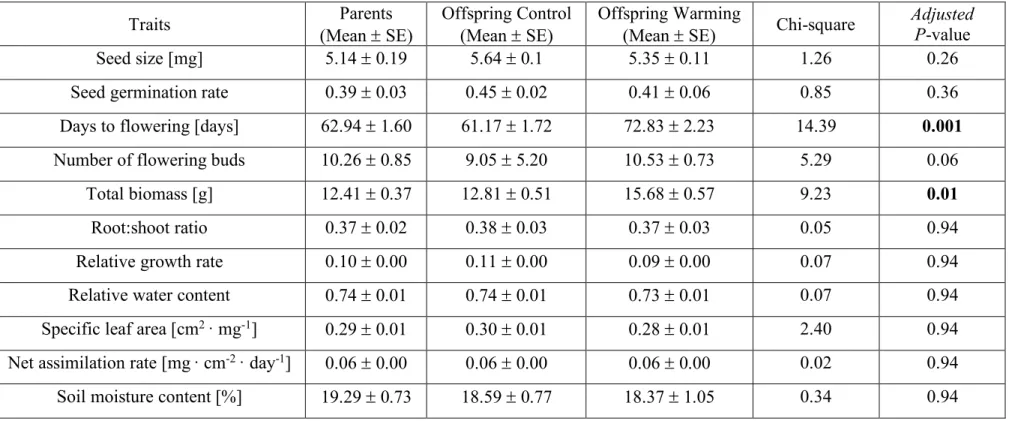
Table S1. Statistical comparisons of phenotypic trait of Ambrosia artemisiifolia among parent, control offspring and warming offspring.
Traits (Mean ± SE) Parents Offspring Control (Mean ± SE) Offspring Warming (Mean ± SE) Chi-square Adjusted P-value
Seed size [mg] 5.14 ± 0.19 5.64 ± 0.1 5.35 ± 0.11 1.26 0.26
Seed germination rate 0.39 ± 0.03 0.45 ± 0.02 0.41 ± 0.06 0.85 0.36
Days to flowering [days] 62.94 ± 1.60 61.17 ± 1.72 72.83 ± 2.23 14.39 0.001
Number of flowering buds 10.26 ± 0.85 9.05 ± 5.20 10.53 ± 0.73 5.29 0.06
Total biomass [g] 12.41 ± 0.37 12.81 ± 0.51 15.68 ± 0.57 9.23 0.01
Root:shoot ratio 0.37 ± 0.02 0.38 ± 0.03 0.37 ± 0.03 0.05 0.94
Relative growth rate 0.10 ± 0.00 0.11 ± 0.00 0.09 ± 0.00 0.07 0.94
Relative water content 0.74 ± 0.01 0.74 ± 0.01 0.73 ± 0.01 0.07 0.94
Specific leaf area [cm2 · mg-1] 0.29 ± 0.01 0.30 ± 0.01 0.28 ± 0.01 2.40 0.94 Net assimilation rate [mg· cm-2 · day-1] 0.06 ± 0.00 0.06 ± 0.00 0.06 ± 0.00 0.02 0.94
3 Fig. S2. Phenotypic variation among Ambrosia artemisiifolia maternal families used in our experiment; parental generation plants were assessed under controlled environmental conditions; error bars represent ± SE.
Note: to explore the initial genetic variation across all families within parental-generation-only, we used the linear model and generalized linear models with the lm/glm function, for normal and Poisson destruction data, respectively.
5 Fig. S4. Estimated phenotypic differentiation (PST) among experimental Ambrosia artemisiifolia populations under control versus warming conditions, tested for a range of c/h2 ratios (c = strength
of additive genetic effects, h2 = heritability) in nine quantitative traits. Error bars are 99% bootstrap
Yan Sun, Oliver Bossdorf, Ramon Diaz Grados, ZhiYong Liao, Heinz Müller-Schärer. 2020. Rapid genomic and phenotypic change in response to climate warming in a widespread plant invader. Global Change Biology.
Appendix S1: Supplementary methods.
A. Warming treatment and statistical analyses
In the field experimental evolutionary study, Plexiglas sheets (1m tall and slightly inclined towards the centre of the cages) were installed in the five warming cages at the time ragweed was transplanted (April 2016). Temperature data loggers (HOBO® Pendant UA-001-64, Onset Computer Corporation, Pocasset, MA) were placed in the centre of 10 cages, and set to record temperature every 15 minutes during growing season of ragweed (April to October). Daily maximum (Tmax) and minimum temperature (Tmin) were measured. We then calculated daily mean temperature (Tmean) and diurnal temperature range (DTR; by subtracting the Tmin with the Tmax) for control and warming cages. To verify the temperature conditions in our cages, we compared the above measurements to the climate data in the predicted current and future ragweed distribution areas (based on Sun et al. 2017), using monthly temperature difference, warmest quarter mean temperature and monthly maximum temperature. Both current and future climatic data were downloaded from worldclim dataset at 5° (http://worldclim.org/). For the future climate date, we used the average of four typical models HadGEM2-AO/rcp85, HadGEM2-AO/rcp26, IPSL-CM5A-LR/rcp85 and IPSL-CM5A-LR/rcp26) (Sun et al., 2017).
Field temperature measurements, i.e., DTR, daily Tmean, daily Tmax and daily Tmin, were analysed with pairwise t-test to compare the daily temperature records from control and warming
2
B. DNA extraction and genome sequencing
DNA samples were prepared from frozen leaves that were powdered in TissueLyser (Qiagen, Hilden, Germany). Each sample was divided into four sub-samples due to the large amount of the pooled tissue, and genomic DNA extracted with 750 µl CTAB buffer (2% CTAB, 1.4 M NaCl, 20 mM EDTA, 100mM Tris-HCl, pH 8.0) for one hour at 65ºC. The DNA was purified by addition of 1x volume 1:1 phenol: [24:1 chloroform:isoamyl alcohol] and centrifuged for 20 min at full speed. Then we mixed 1x volume isopropanol (i.e. 2-propanol) by inversion for 20 min on ice and centrifuged for 30 min at full speed. The resulting pellet was washed with freshly-prepared 80% ethanol, dried in the hood and resuspend in 300 µl AE buffer (10 mM Tris-HCl, 0.5 mM EDTA, pH 9.0). The DNA was further purified by magnetic bead precipitation, followed by introducing RNase A (Qiagen, Hilden) at 37ºC for 30 min. DNA quality was checked on 1.5% agarose gels stained with GelRed (Biotium) on a UV-Vis Spectormeter (NanoDrop 8000, Thermo Scientific). DNA was quantified using a Qubit™ 3.0 Fluorometer with dsDNA HS Assay kit (Thermo Fisher Scientific, Invitrogen, Waltham, USA). The four sub-sampled DNA extractions were pooled back together as a final DNA sample of each population. Genomic DNA samples were indexed and libraries prepared for 350 bp insert and 150 bp paired-end reads using the Illumina TruSeq DNA PCR-free LT kit (Illumina, Inc., San Diego, CA, USA). The DNA fragment sizing and quantification of the individual library was assessed by Agilent 2100 Bioanalyzer (Agilent Technologies, Santa Clara, CA, USA).
C. Illumina read processing, mapping and SNP calling
Forward and reverse reads were screened for tags and adaptors with ‘CUTADAPT’ (Martin, 2011). Paired-end reads from the DNA-Seq data were trimmed using ‘PoPoolation’ (Kofler, Orozco-terWengel, et al., 2011), with quality threshold 20. Reads were then aligned to an available Ambrosia artemisiifolia draft reference genome (van Boheemen et al., 2019; Bieker et al., 2020). Mapped reads of each population were sorted and duplicates removed with ‘PICARD’ (http://picard.sourceforge.net/). Low-quality sequences were removed by using ‘SAMTOOLS v1.3.1’ (Li et al., 2009). Single nucleotide polymorphisms were called with ‘SAMTOOLS’ (mpileup), synchronizing and filtering for base quality (Q20) using the script ‘mpileup2sync.pl’ of ‘POPOOLATION2’ (Kofler, Pandey, et al., 2011). The minimum count of the minor allele was set to two and minimum coverage of 20 and maximum coverage of 120 per populations were used as thresholds for SNP identification to accurately estimate allele frequencies and corrected for potential errors from repeated sequences (Fischer et al., 2013). In addition, we extracted monomorphic sites from every combination of 39 out of 40 bam files (here, we used all sequencing data from 20 pooled samples over two generations) using “findmonomorphicsite” function in POOLSTAT (https://bitbucket.org/phaentu/poolstat.git) with minimum quality 20, maximum quality 120, minimum depth 10 represented in at least 5 populations. Of these selected sites, we then only included the ones that were monomorphic in all sequence data. To further restrict the number of monomorphic sites, we then only included the ones that were monomorphic in all sequence data. The extracted monomorphic sites were then recalibrated with the left bam file to estimate machine errors with “recalBAM” function in ATLAS (Link et al., 2017), which is a method for base quality score
4
D. Phenotypic assays in the growth chamber
All seeds were transported to the University of Tübingen and stored at 4˚C for stratification over eight weeks to break dormancy (Willemsen, 1975). In mid-December 2016, 10 seeds of each of the 60 original parents and 100 randomly selected stratified seeds from each of the 10 offspring populations were placed into Petri dishes containing two filter papers wetted with distilled water in a growth chamber for germination, supplemented by metal halide bulbs, following a 12/12h day/night at 20/10˚C cycle (Leiblein-Wild et al., 2013). Seeds were watered with distilled water if necessary. Germinated seeds were transplanted into seedling trays with 150 (10 × 15) cell plugs of 15 ml volume filled with commercial potting soil for initial growth for two weeks. In January 2017, all seedlings were transplanted into plastic pots (9 × 9 × 9.5 cm) filled with a mixed substrate of 30% sand and 70% commercial potting soil. After transplanting, plants were exposed to natural light conditions supplemented by metal halide bulbs, following an 18/6h day/night cycle at a temperature 21/17˚C cycle in the growth chamber, thus mimicking the field control conditions (Appendix: Fig. S3).
We assessed the relative growth rate (RGR) of each plant species by calculating RGR = (lnb1 – lnb0)/days, where ‘b1’ is the above-ground biomass of the plant at harvest, ‘b0’ is the initial biomass at the beginning of the experiment and ‘days’ refer to the days to harvesting. Three leaves per plant were detached in low (1/5 of height), middle (1/2 of height) and high (4/5 of height) position to determine RWC, SLA and NAR. After cutting, the leaves were immediately scanned and weighted (fresh weight: FW), then immersed in distilled water in a closed petri dish and maintained at 4˚C in darkness (to minimize respiration losses) until they reached a constant weight (turgid weight: TW, the weight at full turgor measured with hydrate fully). Full turgor was typically reached after 12 hours. Dry weight (DW) was then measured at 60˚C after 72 hours. The RWC of each plant individual was calculated as mean value of three leaves per plant, according to Barrs and Weatherley (1962) as follows: RWC =[(𝐹𝑊 − 𝐷𝑊) (𝑇𝑊 − 𝐷𝑊)))))))))))))))))))))))))))))))))))]×100(%). Leaf area (LA) was obtained from the scans ⁄ using ImageJ software. SLA and NAR were calculated as the mean value of three leaves per plant as follows: SLA (cm2 · mg-1) = 𝐿𝐴 𝐷𝑊)))))))))) and NAR (mg⁄ · cm-2 · day-1) = 𝐿𝐴 (𝐷𝑊 × 𝑑𝑎𝑦𝑠))))))))))))))))))))))))); respectively. ⁄
The total biomass was calculated as the sum of aboveground and root biomass together of the three leaves used above.
References
Barrs, H., & Weatherley, P. (1962). A re-examination of the relative turgidity technique for
estimating water deficits in leaves. Australian Journal of Biological Sciences, 15(3), 413-428. Bieker, V. C., Barreiro, F. S., Rasmussen, J. A., Brunier, M., Wales, N., & Martin, M. D. (2020).
Metagenomic analysis of historical herbarium specimens reveals a postmortem microbial community. Molecular Ecology Resources.
Fischer, M. C., Rellstab, C., Tedder, A., Zoller, S., Gugerli, F., Shimizu, K. K., . . . Widmer, A. (2013). Population genomic footprints of selection and associations with climate in natural populations of Arabidopsis halleri from the Alps. Molecular Ecology, 22(22), 5594-5607. Kofler, R., Orozco-terWengel, P., De Maio, N., Pandey, R. V., Nolte, V., Futschik, A., . . . Schlötterer,
C. (2011). PoPoolation: a toolbox for population genetic analysis of next generation sequencing data from pooled individuals. PLoS ONE, 6(1), e15925.
doi:10.1371/journal.pone.0015925
Kofler, R., Pandey, R. V., & Schlötterer, C. (2011). PoPoolation2: identifying differentiation
between populations using sequencing of pooled DNA samples (Pool-Seq). Bioinformatics, 27(24), 3435-3436. doi:10.1093/bioinformatics/btr589
Leiblein-Wild, M. C., Kaviani, R., & Tackenberg, O. (2013). Germination and seedling frost tolerance differ between the native and invasive range in common ragweed. Oecologia, 174, 1-12. Li, H., Handsaker, B., Wysoker, A., Fennell, T., Ruan, J., Homer, N., . . . Durbin, R. (2009). The
sequence alignment/map format and SAMtools. Bioinformatics, 25(16), 2078-2079. Martin, M. (2011). Cutadapt removes adapter sequences from high-throughput sequencing reads.
EMBnet. journal, 17(1), pp. 10-12.
Sun, Y., Brönnimann, O., Roderick, G. K., Poltavsky, A., Lommen, S. T., & Müller-Schärer, H. (2017). Climatic suitability ranking of biological control candidates: a biogeographic approach for ragweed management in Europe. Ecosphere, 8(4), e01731. doi:10.1002/ecs2.1731
van Boheemen, L. A., Atwater, D. Z., & Hodgins, K. A. (2019). Rapid and repeated local adaptation to climate in an invasive plant. New Phytologist, 222(1), 614-627. doi:10.1111/nph.15564 Willemsen, R. W. (1975). Effect of stratification temperature and germination temperature on
germination and the induction of secondary dormancy in common ragweed seeds. American Journal of Botany, 1-5.