Development of a Gear Shift Test Setup for Hybrid
Transmission Vehicles
by
Katelyn Sweeney
Submitted to the Department of Mechanical Engineering in partial fulfillment of the requirements for the degree of
Bachelor of Science in Mechanical Engineering at the
MASSACHUSETTS INSTITUTE OF TECHNOLOGY June 2018
@
Massachusetts Institute of Technology 2018.A uthor ... ..
All rights reserved.
Signature redacted
Department of Mechanical Engineering May 11, 2018
Certified by...Signature
redacted
Amos er Asso ci Irofessor Thesis Supervisor
Signature redacted
A ccep ted b y ... Rohit Karnik Professor of Mechanical Engineering, Undergraduate OfficerMASSACHUSETS INSTITUTE OF TECHNOLOGY
SEP
13 2018
LIBRARIES
Development of a Gear Shift Test Setup for Hybrid
Transmission Vehicles
by
Katelyn Sweeney
Submitted to the Department of Mechanical Engineering on May 11, 2018, in partial fulfillment of the
requirements for the degree of
Bachelor of Science in Mechanical Engineering
Abstract
As fuel and efficiency regulations tighten, precise and highly efficient transmission sys-tems are becoming necessities. Previous studies at the MIT Global Engineering and Research (GEAR) Laboratory demonstrated mathematically the ability to improve the shift event via Hall Effect sensing; this study sought to implement those results in practice. To accomplish this, measurements of the physical gearsets, motors, and actuators were implemented into Computer Aided Design (CAD) software in order to design mounts and fixtures. Those mounts and fixtures were then manufactured and implemented into the real setup. In addition, brushless DC motors were utilized and tailored to drive the transmission. The end result was both CAD and physical assemblies that are simple, easy to assemble, and precise to the specifications of the experiment. From this study a proof-of-concept was built, showing that it is indeed possible spatially and physically to build an effective test setup that can support the theoretical needs of the experiment.
Thesis Supervisor: Amos Winter Title: Associate Professor
Acknowledgments
I would like to thank Professor Amos Winter for his advisement and support during
the thesis process. In addition, thank you to Dan Dorsch for helping me learn so much about transmission system and for always being available and willing to answer my questions, review my work, and support my pursuit of this thesis. I would also like to thank Jane Kokernak, Amy Carleton, and the Writing Center for helping me translate Engineering into English. Thank you to Daniel Gonzalez for helping me debug my electrical setup. Thank you to Daniel Rigobon for helping me with the controls systems of these experiments, aiding my writing of this paper, and for his continued moral support throughout this process. Finally, a huge thank you to my family. Without their continued love and support I would not have made it to this point in my academic and professional career.
Contents
1 Introduction 1.1 O bjective . . . . 2 Background 2.1 Existing Regulations 2.2 Vehicle Transmission2.3 Hall Effect Sensing 2.4 Previous Research .
3 Experimental Setup
3.1 Electrical Setup . . . .
3.1.1 Motors and Controllers . . . .
3.2 Mechanical Setup . . . . 3.2.1 G ears . . . .
3.2.2 Linear Actuator . . . .
3.2.3 Computer Aided Design Preparation 4 The Assembly
4.1 G ears . . . .
4.2 Motors and Couplings . . . . 4.3 M ounts . . . . 4.4 Linear Guides . . . . 4.5 Interfacing Components . . . . 4 10 11 12 12 12 13 14 16 16 16 19 20 21 21 24 25 27 27 29 29
5 Building the Setup 31 5.1 Pilot Iteration . . . . . 32 5.2 N ext Steps . . . . 33
6 Conclusions 34
A Analog Control 35
A.1 Analog Without Independent Joysticks . . . . 35 A.2 Analog Using Independent Joysticks . . . . 37
List of Figures
2-1 Hall Effect sensors in motor applications take the target input (in the case of these experiments, velocity) and interact with the sensor input. From there the electromagnetic signal is processed and output digitally. 14
3-1 The wiring diagram for the Brushless DC motor (BLK32S-48V-3000
from Anaheim Automation). The motor's three phase setup are con-nected via the red, black, and yellow wires to the phase control ports
U, V, and W on the motor controller. The wiring from each port is
specific such that the motor shaft will rotate in the proper direction. . 17 3-2 Using two motors instead of one results in a similar setup. Leads from
the motor's phases were connected to their respective U, V, and W ports. Thanks to Roboteq's structure, the motors can be attached to the same Hall breakout board, simplifying the wiring. . . . . 18 3-3 The mechanical setup of the gear shift test mechanisms . . . . 19
3-4 The gearing used in this setup. The synchronous gear (c) was attached on to the single gear shaft (a) and interfaced with the gear shaft shown in (b) in order to define the output speed. . . . . 20
3-5 The system 's shift fork. . . . . 21
3-6 The critical measurements for the gearbox setup. Mating components (flexible couplings) and support components (bearing mounts and lin-ear guides) were selected based upon these critical values. Measure-ment descriptions and values are found in Table 3.1. . . . . 22
6
3-7 An exploded view of the spider-hub gearing system. One hub is built
with a larger bore to match the gearshaft to which it mates; the other is matched to the motor shaft. The spider unit in the middle serves to add flexibility, backlash prevention, and resilience to vibrational effects in the setup, all while transmitting the torque between shafts. .... 23
4-1 The full CAD Assembly of the motor setup, including the critical di-mensions and couplings. For simplicity, the gears were modeled only for their critical cylindrical dimensions, as exact placement of the teeth was irrelevant. Each labeled component is discussed in this chapter and can be found via Table 4.1 . . . . 24 4-2 The gearset CAD. Since the complex helical teeth only needed to
in-terface with each other, the cylindrical approximation shown here was all that was needed to create a valid setup. . . . . 26 4-3 One of the pillowblock bearings used to support the gear shafts. . . . 26
4-4 The spider-hub coupling. Subfigure (a) shows an isometric view of the
CAD model, while Subfigure (b) gives a more holistic view of the inner
workings of the coupling via an exploded view. . . . . 27
4-5 The face mounting system for the BLK32S motors. The mount at-tached to the face of the motor via four 1/4"-20 bolts then was inde-pendently fastened to the optical board. . . . . 28
4-6 The bearing mount support system. The support itself had three through holes to fit 1/4"-20 bolts- one tapped hole to interface with the bearing itself and two through holes to interface with the optical board. Subfigure (a) shows an isometric view of the support itself, Subfigure
(b) shows an isometric view of the whole bearing mount subassembly,
and Subfigure (c) shows a top view of the subassembly. . . . . 28
4-7 The linear guide and oilite bearing. . . . . 29
4-8 The previous design iteration included an 80/20 aluminum box with all of the components mounted to the frame. While this was a simple design, it was not safe for vibrational and rotational use cases, and it is much more difficult to assemble. . . . . 30 5-1 The pilot iteration of the test bench setup. . . . . 33 A-1 The 25-pin pinout diagram for Roboteq's controllers. . . . . 36 A-2 The Roborun+ script that runs analog control on Motor 2 while runnig
M otor 1 at a fixed speed. . . . . 37
List of Tables
3.1 The critical measurements used to port the physical gearset into CAD 23
4.1 The parts in the CAD diagram in 4-1. . . . . 25 5.1 The materials and manufacturing processes for each of the custom parts
in F igure 4.1. . . . . 32
Chapter 1
Introduction
Since the first car hit the market in 1808, the automotive industry has grown and evolved into its current form, now dominating the transportation industry
[1].
Now there are over 253 million vehicles on the road, ranging from commuter cars to large cargo transport[2].
The majority of modern passenger vehicles are propelled by Inter-nal Combustion Engines (ICEs)[3].
While a minority of models are either hybridized with Electric Motors (EMs) or entirely electric, it is difficult to beat the infrastruc-ture and price benefits associated with ICE systems. Despite the benefits that ICEs provide in terms of power and market dominance, they present a clear threat to the environment, producing about 27% of all annual recordable greenhouse gas emissions [4]. As human impact on the security of our planet becomes clearer, fuel and energy efficient vehicle development is imperative.A core component in improving efficiency is improving the transmission. Vehicle
transmissions connect the ICE/EV power source to the speed output. Different gear ratios allow for varying speed and acceleration in the vehicle and define the transmis-sion's feel for the operator. Understanding the proper time to shift is a key facet of conserving energy and part integrity in these systems; we need to know the velocity of the teeth of the gears to understand when to initiate the shift. The use of Hall Effect Sensors (described in greater detail in Chapter 2 Section 3) can bring precision to the shift event. The success of this model has already been demonstrated mathematically and the time has come to implement this in the physical realm.
1.1
Objective
The purpose of this study is to design a test setup that supports the physical needs of the experiment in order to prove the previous model. Once built, this will allow for assessment of whether or not the existing mathematical model lines up with what occurs in actuality and to assess any characteristics of the system that may not be represented by modeling alone. The setup system consists of an optical board mounting base, bearings and mounts to support the motors and gear setups, and shaft couplings to transmit torque throughout the transmission setup.
Chapter 2
Background
2.1
Existing Regulations
The Corporate Average Fuel Economy (CAFE) was established in 1975 by congress to regulate vehicle efficiency and cut emissions
[5,
6]. By 2021 CAFE regulations dictatethat consumer vehicles and light trucks must reach 40.3 mpg; by the Environmental Protection Agency's (EPA) standards for greenhouse gas emissions, vehicles of the same classes must reach 54.5 mpg and less than 163 g/mile C02 emissions by 2025
[6, 7]. These regulations force the need for stark changes to automobile design if the
industry is to meet these standards. Currently passenger vehicles run on an average of 23.4 mpg, which is far below the requirements that will come into play in 3 years [8].
2.2
Vehicle Transmission
While the popularity of manual transmissions (colloquially known as "stick shift") is declining in the US, manual vehicles remain the leading transmission type worldwide, whether for look, feel, control, or cost-effectiveness [9, 101. There currently exist two main types of manual transmissions: synchronous and non-synchronous. Non-synchronous transmissions were the first modern form of manual transmission and gears are typically engaged by sliding them along the shaft. This type of transmission
is known as a "sliding mesh transmission". They are sometimes referred to as "crash boxes" due to how difficult it is to properly shift and align gears and the loud noises that result. To resolve this, newer transmissions have constant mesh transmissions where the gears are properly aligned at all times
[11,
12]. Synchronous transmissions are the most common consumer vehicle transmission in manual automobiles [11]. In synchronous systems, the gears are always aligned while rotating and a dog collar slides along the shaft to bridge gears and control output speeds. The system used in this experiment consists of gears from a synchronous manual transmission, as can be found in many modern sports cars.2.3
Hall Effect Sensing
The ability to sense the velocity of the gears is at the crux of understanding the proper time to shift [6]. In the motors for this test setup, Hall Effect sensors track and relay that data. The Hall Effect is a long-understood recently-leveraged electromagnetic principle that states that an electric field will be produced when a solid material carries an electric current and is placed in a magnetic field
[13].
Hall Encoders utilize this physical law by utilizing an input interface that intakes the desired property. The sensor then utilizes internal logic to interpret the electromagnetic signal to output interpretation of the data it received (Figure 2-1)[14].
Sensor Target Input S o n Interface Hall Element and Snr ensor Output Interface Signal Generated
Figure 2-1: Hall Effect sensors in motor applications take the target input (in the case of these experiments, velocity) and interact with the sensor input. From there the electromagnetic signal is processed and output digitally.
2.4
Previous Research
The overall goal of implementing velocity control sensing into gear transmissions is to increase the accuracy of changing gears, thus decreasing the risk of inefficiencies in the shift event. In redesigning the system, elimination of the clutch was deemed the optimal method of reducing the vehicle's effective inertia and viscous losses incurred while shifting [6].
Typically the clutch in a vehicle serves to disconnect the source of the torque to the transmission (the EM in this case) in order to change gears. Previous research showed that the optimal method of increasing efficiency while removing the clutch was to draw inspiration from dual-clutch transmission (DCT) systems, using two electric motors and a pneumatic actuator to shift gears
16].
This system, developed in the GEAR Lab, provides high acceleration rates, torque engagement to minimize jerk on the system, and speed matching between gears during the shift event.14
RMWIT-MI.F.
ml
PIR I T " - 11 .1 , , -1-1."M"Tr t W, W1
-Building on this research, this test setup intends to implement the new theoretical models into a physical test setup in order to prove their beneficial effects on previous developments.
Chapter 3
Experimental Setup
The goal of the test setup design was to mimic the physical conditions of manual transmissions. To accomplish this the setup must be both mechanically and electri-cally robust and well-toleranced.
3.1
Electrical Setup
3.1.1
Motors and Controllers
For the required torque the Anaheim Automation BLK32S-48V-3000 Motor series was utilized. Selection was based upon the torque output range required to drive the gear setup and interface shaft size; at 378 oz-in (or 2.7 N-m) of torque and a 3/4 in (or 19mm) shaft diameter, the BLK32S series matches the requirements of the test setup [15].
The BLK32S motor is an 8-pole 3-phase motor, allowing it to operate at very high torque values. An 8-pole (or "star connected") motor has 8 motor windings, each 450
apart. While more poles means that it takes more power cycles to complete a full revolution, there are more electromagnets working to supply a larger torque. Thus, it stands to reason that more poles will proportionally increase the specific torque of a motor.
The motor system was controlled by a Roboteq controller. The motor leads were
El
each specifically coordinated to a port on the controller to ensure that power was provided to each of the three phases such that the motor rotated in the proper di-rection. The controller also processed the motor's Hall sensor data and converted it into velocity data (which would be later utilized to control the gear shift event). The output was then processed and isolated through a USB isolator and fed to Roboteq's
PC motor software, Roborun. Initially the motor was tested with a single-channel
MBL1660A controller (Figure 3-1).
Contro V U V
-i
Red
Black Motor Yellow
Hall Sense Power Supply ller + GND MOT PWR CTRL " i Hall Breakout Board
Figure 3-1: The wiring diagram for the Brushless DC motor (BLK32S-48V-3000 from Anaheim Automation). The motor's three phase setup are connected via the red, black, and yellow wires to the phase control ports U, V, and W on the motor controller. The wiring from each port is specific such that the motor shaft will rotate in the proper direction.
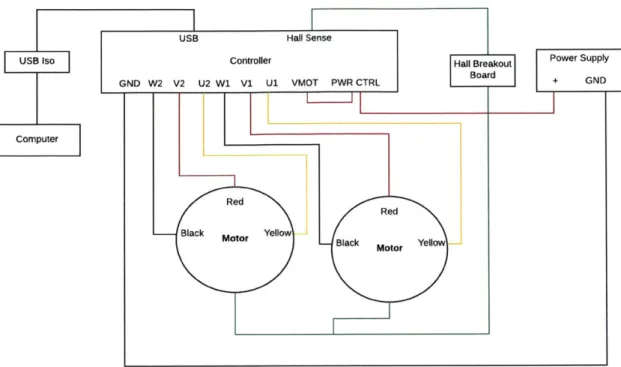
For this specific set of tests, there were two motors, meaning the setup required either two single-channel controllers or one dual-channel controller. Out of simplicity a dual-channel solution, the Roboteq FBL1660A was chosen. While the wiring was similar, there were now two motor ports, requiring additional routing, as represented in Figure 3-2. 17 USB Iso USB Computer GND W
I I
USB Hall Sense USB Iso Controller
GND W2 V2 U2 W1 V1 U1 VMOT PWR CTRL
Computer
Blac
Red
Red
k Motor Yellow Black Motor Yellow
dl Breakout Power Supply Board + GND
I GND
Figure 3-2: Using two motors instead of one results in a similar setup. Leads from the motor's phases were connected to their respective U, V, and W ports. Thanks to Roboteq's structure, the motors can be attached to the same Hall breakout board, simplifying the wiring.
18
3.2
Mechanical Setup
Shift Fork Flexible Shaft Coupling IMotor Motor Mount Bearing Mount Linear Guides Gearing Two-Speed GearsetI
U
Pneumatic Actuator Mount Bearing Mount Motor Motor Mount Gearing Flexible Shaft CouplingFigure 3-3: The mechanical setup of the gear shift test mechanisms.
The mechanical setup was largely reliant on motor selection. High power, high torque, and high resiliency under these loading conditions are necessary in order to safely and effectively drive the gears. One motor operated at constant speed while the other was variable speed in order to test the various shift methods.
To prevent the motors from overloading, each gearshaft was constrained by two bearing mounts which restricted gear motion to a single degree of freedom. The bearing mounts ensured that any separation forces incurred by the gears were not taken on by the motor's bearings. In addition, flexible shaft couplings connected the shaft to the gearing in order to provide resilience to axial misalignments and provide constant torque transmission throughout the setup. Since there were two axes in play- one defined by the motors' bearings, and one defined by the shafts' bearings-they would never be perfectly aligned; the flexible couplings ensured that the two axes did not cause wear on each other and provided some dimensional flexibility when the gears were running (Figure 3-3).
3.2.1
Gears
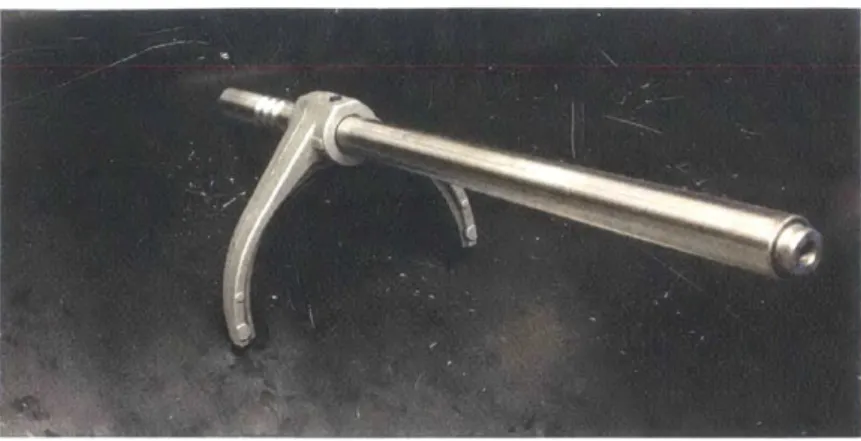
The test setup consisted of two main rotating gear shafts and one synchronous gear used to shift (Figure 3-4). The shift event was driven by the shift fork (Figure 3-5) which was actuated by a Bimba Position Feedback Cylinder.
(a)
(b)
(c)
Figure 3-4: The gearing used in this setup. The synchronous gear (c) was attached on to the single gear shaft (a) and interfaced with the gear shaft shown in (b) in order to define the output speed.
20
Figure 3-5: The system's shift fork.
3.2.2
Linear Actuator
The shift event inherently relied on the ability to actually shift gears and was driven
by a pneumatic cylinder coupled to the system's shift fork (Figure 3-5). The linear
actuator is a pneumatic Bimba Position Feedback Cylinder. This actuator is a much more simply controlled system than the motors, requiring a pneumatic solenoid valve to move the piston and shift the gears.
3.2.3
Computer Aided Design Preparation
Computer Aided Design (CAD) allows for complex mechanical models to be simulated geometrically and spatially prior to building. In order to implement the system into
CAD, the critical dimensions of the gears and the interfaces with other parts were
collected via hand measurement (Figure 3-6). These measurements are detailed in Table 3.1.
Once the dimensions were gathered, the gearsets were modeled by their cylindrical dimensions in Solidworks and implemented into the virtual setup. They were then mated with CAD models of the BLK32S-48V-3000 Motors. Using the differences between the motor shaft and the gearset diameters, flexible shaft couplings were pieced together using Lovejoy hub-spider parts sized to the gear and motor shaft diameters (Figure 3-7).
GH L
F
J
K
Figure 3-6: The critical measurements for the gearbox setup. Mating components (flexible couplings) and support components (bearing mounts and linear guides) were selected based upon these critical values. Measurement descriptions and values are found in Table 3.1.
Table 3.1: The critical measurements used to port the physical gearset into CAD
Key Dimension Measurement
A Motor face area 8.1 cm x 8.1 cm B Motor base length 158 mm
C Motor shaft diameter 19.0 mm D Gear shaft 1 diameter at motor 40.0 mm
E Gear shaft 1 diameter at end 35.0 mm
F Gear shaft 2 diameter 25 mm G Gear shaft 1 gear diameter 27.3 mm
Gear shaft 1 gear height 10.8 cm
H Two-speed gear diameter (1) 8.9 cm Two-speed gear height (1) 25.7 mm
Two-speed gear diameter (2) 7.6 cm
Two-speed gear height (2) 21.3 mm
Gear shaft 2 gear diameter (1) 10.2 cm Gear shaft 2 gear height (1) 21.2 mm K Gear shaft 2 gear diameter (2) 11.43 cm
Gear shaft 2 gear height (2) 24.2 mm
L Shift fork bore size 16mm
Figure 3-7: An exploded view of the spider-hub gearing system. One hub is built with a larger bore to match the gearshaft to which it mates; the other is matched to the motor shaft. The spider unit in the middle serves to add flexibility, backlash prevention, and resilience to vibrational effects in the setup, all while transmitting the torque between shafts.
Chapter 4
The Assembly
Figure 4-1: The full CAD Assembly of the motor setup, including the critical dimen-sions and couplings. For simplicity, the gears were modeled only for their critical cylindrical dimensions, as exact placement of the teeth was irrelevant. Each labeled component is discussed in this chapter and can be found via Table 4.1.
Table 4.1: The parts in the CAD diagram in 4-1.
Key Component Section
A Dual Gear Shaft 4.1 B Single Gear Shaft 4.1
C Two-Speed Gear 4.1
D Pillowblock Mounts 4.1.1
E Pillowblock Supports 4.3 F BLK32 Series Motors 4.2
G Shift Rod and Shift Fork 4.4 H Linear Guide/Oilite Bearing 4.4
I Pneumatic Actuator 4.3
J Flexible Couplings 4.2
K Motor Mounts 4.3
With all of the associated dimensions and design requirements in hand, the full
CAD assembly can be created (Figure 4-1). The CAD design allows for an accurate
representation of how the system will look and perform in space. For more information on the design choices made for each component, see Section 3.2.2: Computer Aided Design Preparation and Figure 3-6.
4.1
Gears
While the most complex physically, the gears were actually the easiest to model virtually. In actuality, each gear was helical (which on its own is difficult to model due to the spiral tooth trace) with hundreds of teeth (Figure 3-4). For the purposes of the model, the only important dimensions were the major diameters of the gears and the length and diameter of the shaft, as the gears would only interact with each other at their teeth. Using the measurements found in Section 3.2.2, the gear shafts were modeled cylindrically (Figure 4-2)
Gear Support
Each gear shaft was paired with two pillowblock bearings sized to their specific shaft diameters (Figure 4-3). Two bearing supports were required in order to limit the degrees of freedom for the shaft motion; a single bearing or total lack thereof would not
Figure 4-2: The gearset CAD. Since the complex helical teeth only needed to interface with each other, the cylindrical approximation shown here was all that was needed to create a valid setup.
constrain the shaft to a single degree of freedom, allowing for movement in undesired directions [16]. Even with two bearings, two degrees of freedom may still have been possible if the bearings were not selected properly to constrain axial sliding motion and rotation.
Figure 4-3: One of the pillowblock bearings used to support the gear shafts.
Placement within the CAD assembly was chosen based upon the structural goal to support the load evenly and the need to avoid interference between parts. Since the longer gear shaft had a smaller diameter, those bearings were mounted upon
machined supports in order to keep the system level (See Section 4.5: Interfacing Everything).
4.2
Motors and Couplings
The motors CAD was added into the assembly using pre-prepared files provided
by Anaheim Automation. The next step was to import the CAD for the
spider-hub couplings and interface them with their respective motors and gearshafts. This required matching the bore size of each hub to its attachment point (Figure 4-4).
(a)
(b)
Figure 4-4: The spider-hub coupling. Subfigure (a) shows an isometric view of the
CAD model, while Subfigure (b) gives a more holistic view of the inner workings of
the coupling via an exploded view.
4.3
Mounts
Anaheim Automation motors can be face mounted with four 1/4"-20 bolts, allowing for very simple mount design (Figure 4-5).
Figure 4-5: The face mounting system for the BLK32S motors. The mount attached to the face of the motor via four 1/4"-20 bolts then was independently fastened to the optical board.
In order to make sure that the two gearshafts sat level with each other, custom mounts were designed to interface the board and supports over a larger distance (Figure 4-6).
Q
(a) (b) (c)
Figure 4-6: The bearing mount support system. The support itself had three through holes to fit 1/4"-20 bolts- one tapped hole to interface with the bearing itself and two through holes to interface with the optical board. Subfigure (a) shows an isometric view of the support itself, Subfigure (b) shows an isometric view of the whole bearing mount subassembly, and Subfigure (c) shows a top view of the subassembly.
4.4
Linear Guides
In order to ensure the pneumatic actuator only drives the shift fork in one degree of freedom, two linear guides were located on each side of the fork. Each guide was designed to be easily machined and to interface with a cylindrical oilite bearing (Figure 4-7).
Figure 4-7: The linear guide and oilite bearing.
4.5
Interfacing Components
The test setup relies on connecting everything to a rigid structure. Initially, the design featured an 80/20 Aluminum box, as featured in the previous iterations of the test setup (Figure 4-8). However, this setup had a number of issues that made it suboptimal.
With multiple mounting components, lining everything up became much more difficult in an aluminum frame setup due to tolerance stackup. In order to improve the system, the whole setup was migrated onto 18"x 36" optical board. The optical board has evenly spaced 1/4"-20 tapped holes (each 1" apart) making design for assembly much simpler.
Figure 4-8: The previous design iteration included an 80/20 aluminum box with all of the components mounted to the frame. While this was a simple design, it was not safe for vibrational and rotational use cases, and it is much more difficult to assemble.
Chapter 5
Building the Setup
The natural next step was to actually build the test setup. For reference, Figure 4.1 is reproduced below alongside Table 5.1, which outlines the manufacturing processes and materials for each component.
F K D C B 4 G
jr
/PH /9 E A 314"f
4i
Table 5.1: The materials and manufacturing processes for each of the custom parts in Figure 4.1.
Key Component Material Manufacturing Process(es)
D Pillowblock Mounts Steel Milled, waterjet 1 E Pillowblock Support Aluminum Milled
H Linear Guides Aluminum Waterjetted, milled, then press-fitted with oilite bearings . FPurchased at close size then bores J Flexible Shaft Couplings Aluminum fietopcseiz
filed to precise size
K Motor Mounts Aluminum Milled
Each component was specifically designed with manufacturability in mind and could be produced via waterjetting and milling; some could also be purchased from third-party vendors to further simplify the system. The CAD model also ensured that each manufactured part was already properly dimensioned and ready to be machined to precise fits with the rest of the assembly.
5.1
Pilot Iteration
The pilot iteration of this test bench setup was constructed and run in May 2018 (Figure 5-1). Due to tight time constraints and the low initial test speeds of the gears, the bearing mounts and linear guides were 3D printed instead of machined. 3D printing at a high resolution allowed for the components to be modeled quickly in physical space at a low cost prior to spending extensive time machining complex parts.
Due to higher loading conditions and the cantilevered mounting of the motors, the motor mounts were machined out of aluminum stock. Furthermore, the motors must maintain proper alignment while running tests. As such, a brittle 3D printed mount would have been insufficient.
'Part is specified such that it can also be purchased from a third-party vendor
M
Figure 5-1: The pilot iteration of the test bench setup.
5.2
Next Steps
The pilot iteration of the setup ran the gears at the lowest possible speeds (around 60-80rpm). In future tests to accurately reproduce the automotive system, the motors need to run the gears at several thousand rpm. Plastic printed mounts would not be sufficiently durable to the loading conditions incurred at such high speeds. As such, all components would need to be manufactured out of aluminum or steel.
After manufacturing, the system was ready for tests. The setup of the motors and controllers allowed for independently-controlled speed and acceleration settings in order to test different shift events. The system and materials were designed and selected for longevity in high-rpm environments, allowing them to be used for many different experiments for a prolonged period of time.
33
Chapter 6
Conclusions
CAD provides a powerful tool to represent complex physical systems in space without
the need to actually build them, helping circumvent and ameliorate errors down the line. In the case of this automatic transmission setup, complex gear alignments, multiple moving parts, and the need for mechanically sound bearings and mounts meant that this system absolutely needed a CAD counterpart prior to assembly.
There were several main design requirements that would lead to a successful model. Taking into account the needs for vibrational resistance, precise dimensions, and ease of assembly, the final optical breadboard-based system was designed (see Figure
4-1 in Chapter 4). Using the optical board made CAD and design for precision and
manufacturability much easier, as its physical implementation provided much more structural support than the alternative of using an extruded 80/20 aluminum box.
In addition, the proposed test setup allowed for parts to be easily moved and remounted thanks to the universality of the optical board's attachment points. With hundreds of evenly-spaced 1/4"-20 tapped holes, each component can be positioned to align properly as required for our benchtop setup.
In future iterations, these same components would be manufactured out of stronger materials and made to withstand different test cases. Regardless, the actual design and placement of the components within the setup is scalable, making design and implementation of future setups far easier.
Appendix A
Analog Control
Analog control allows robotic systems to determine their output based upon a voltage input from the power supply rather than passing through a computational interface. While the Roboteq controllers are robust in application, the specific documentation regarding setup of analog control is limited. Below are detailed instructions regarding the setup of analog control for the Roboteq FBL1660A dual-channel controller used in these experiments.
A.1
Analog Without Independent Joysticks
For analog control using only a power supply, solder the 25-pin board with the ground at pin 13 and the voltage input at pin 15, corresponding to Analog Input 1 in Roboteq's logic (Figure A-1). This will provide the best results, however Roboteq's 25-pin boards are configured such that practically any pin can be used for any pur-pose.
1. Open Roborun+ and connect the controller.
(a) Note that the FBL1660A controller only runs above 12V and to a maximum of 60V. When initiating the analog control, start the controller between
12V and 14V.
2. In the "Configuration" tab, select the "Command Priority" dropdown menu.
15 16 17 18 19 20 21 22 23 24
DINI *DN2 0N4 -DIN5 DING
FR1 RC2 RC4 Fr5. FCS RC
ANA1 ANA2 ANA4 ANA5 ANA6 ANA7
ASIN2
DOUT1 DOUT3
Erx2A Enc2B EnIcA
@0000@800008690
_____________) OGNO5OD
2 Ogd hi n hi Arm hI iO a Ohi Fn~e~ -C-m 3 4 6 7 9 li eDIN9 DIN10 I DINODa 1 IR3 i I I I C8 I _I _ AKAI __ __ IM4M ASIN1 DOUT2 DOUT4 ACWS1 ACWS2 -
-i-3. Set Priority 2 to "Analog." RS232 represents the Serial command and should
stay as the priority in case there is a need for a user override.
4. Under the Analog Inputs dropdown menu, drop down the "Ani" menu. This corresponds to Analog Input 1, which was configured via soldered connections to the breakout board.
(a) For "Conversion Type" select "Absolute."
(b) For "Input Use" select "Motor Command" and check the
sponding to Motor 1, Motor 2, or both depending on which to control.
5. Use the "Calibrate" tool to control the ranges for the minimum
voltages between 0 and 5V.
box(es) corre-you would like
and maximum
6. In order to run one motor at fixed speed and control the other via analog voltage
control, Roborun requires a simple script reproduced below (Figure A-2). This script can be modified to fit the specific parameters of the experiment.
36
Pin
Am hI
Snuieu h
Cam
TxD1a JRxData AL- RS4858
1 = 0 'To-i :an be used as a starting point later to run the d for a ret amount of time
2 hile a < 30 'This can be changed later to pick the time limit
3 esrpmli - 30 '-t d-esird rpm of motor I'
4 esrpm2 - -30 'ze: .eoired rpm of motor 2. THIS MUST BE OPPOSITE SIGN OF desrpmi
5 SetCozmand{_G,1,desrpml) 'Run motor 1 at desired rpm
6 olts - GetValue(_DI,1) '-t instantaneous voltage from analoo control pinot
7 if Volts >0 : a is later for more aranuI&la sI
8 SetCcmmand(_G,2,desrpm2) 9 else 10 SetComnmand(_G,2,0) 11 nd if 12 'n ' d-z-13 ' -14 end while
Figure A-2: The Roborun+ script that runs analog control on Motor 2 while runnig Motor 1 at a fixed speed.
A.2
Analog Using Independent Joysticks
It can be beneficial to have more granular control between the two motors when using analog control. Joysticks can be used to manage two analog control motors at once. In addition, use of joysticks allows control to be managed without use of script in Roborun+.
For dual joystick analog control, make sure that one 5V joystick is soldered with its ground to pin 13 and voltage to pin 15 as in Section A.1. The second joystick should be soldered to the same ground and should have its voltage supply connected to pin 16.
1. Open Roborun+ and connect the controller.
(a) Note that the FBL1660A controller only runs above 12V and to a maximum of 60V. When initiating the analog control, start the controller between 12V and 14V.
2. In the "Configuration" tab, select the "Command Priority" dropdown menu.
3. Set Priority 2 to "Analog." RS232 represents the Serial command and should
stay as the priority in case there is a need for a user override.
4. Under the Analog Inputs dropdown menu, drop down the "Ani" menu. This corresponds to Analog Input 1, which was configured via soldered connections
to the breakout board.
(a) For "Conversion Type" select "Absolute."
(b) For "Input Use" select "Motor Command" and check the box for Motor 1. 5. Use the "Calibrate" tool to control the ranges for the minimum and maximum
voltages between 0 and 5V.
6. Repeat Steps 4 and 5 selecting for "An2", this time selecting the Motor 2
checkbox.
Bibliography
[1] "Automobile History," History.com, 2010. [Online].
[2] J. Hirsch, "253 Million Cars and Trucks on US Roads; Average Age is 11.4 Years,"
LA Times, June 2014.
[3] A. Emadi and F. Berthold, Advanced Electric Drive Vehicles, vol. 2 of The Art
of Computer Programming. Boca Raton, FL: Taylor Francis Group, first ed.,
2014.
[4] "Sources of Greenhouse Gas Emissions," tech. rep., United States Environmental Protection Agency [Online], 2015.
[5] CAFE, "Light-Duty Vehicle Greenhouse Gas Emission Standards and
Corpo-rate Average Fuel Economy Standards; Final Rule," tech. rep., Federal Register [Online], 2010.
[6] S. Shah, V. Prost, Z. Eubanks, et al., "Feasibility of a Clutchless Dual-Shaft
Hy-brid Transmission System for Performance Applications," in 18th International
Conference on Advanced Vehicle Technologies, ASME, (Charlotte, NC), p. 12,
Aug. 2016.
[7] EPA, "Final Rule for Model Year 2017 and Later Light-Duty Vehicle Greenhouse
Gas Emissions and Corporate Average Fuel Economy Standards," tech. rep., United States Environmental Protection Agency [Online], 2016.
[8]
"Maps and Data." Alternative Fuels Data Center [Online].[9]
"Transmission Type Market Share, Global Car Production 2017." Statista [On-line].[101 E. Evarts, "Why are Manual Transmissions Disappearing," tech. rep., US News
[Online], Sept. 2016.
[11] M. Brian and C. Threewit, "How Manual Transmissions Work." How Stuff Works
[Online].
[12] "Manual Transmissions." Learn Engineering [Online], Aug. 2015.
[13] "Hall Effect." Encyclopedia Britannica.
[14] Hall Effect Sensing and Applications. MICRO SWITCH Sensing and Control, Honeywell.
[15] Roboteq Advanced Brushed and Brushless Digital Motor Controllers User
Man-ual. Roboteq Inc, 2017.
[16] P. Childs, Mechanical Design Engineering Handbook. Elsevier, 2014.