COLOR CENTERS IN CALCITE
by
WILLIAM FREDERICK KOLBE
SUBMITTED IN PARTIAL FULFILLMENT OF THE REQUIREMENTS FOR THE DEGREE OF
BACHELOR OF SClENCE
at the
MASSACHUSETTS INSTITUTE OF TECHNOLOGY June 1961
Signature of Author . • • • • • • • •
Signature redacted
_,.
.
.
.
. .
.
Department of Physics, May 22, 1961Signature redacted
Certified by . • • • • • • • • • • • • • • • • • o • .1, • • • .- • • • • •--... ~Thesis Supervisor
Signatu
r
e redacted
Accepted by
.
.
.
. .
.
.
.
. .
. .
.
.
.
.
.
.
.
. .
.
.
.
.
. .
.
.
.
.
Chairman, Departmental Committee on ThesesCOLOR CENTERS IN CALCITE
by
WILIAM F. EDLBE
ABSTRACT
Coloration of pure crystals of calcite produces absorption bands at 290 and 350 mp. The band at 290 mq which is anisotropic,
absorbing only for the ordinary ray, has been attributed to color centers located in the carbonate groups, while the isotropic band at 350 mp has been attributed to calcium color centers. To ex-plain the fact that both bands bleach identically, and that an equal number of centers is associated with each band, it is pro-posed that the centers are produced in pairs by transferring an electron from a carbonate group to a calcium lattice position. In addition to these two bonds, further coloration which may be due to a third band, is produced in the neighborhood of the funda-mental absorption edge.
The author would like to express his appreciation to Professor A. Smakula for his supervision of this work and for
many helpful discussions and suggestions. Grateful thanks are
also due to Dr. K. A. Wright for irradiating the samples and
Table of Contents .age Introduction ... ...
1
Experimental Procedure . .. ... 4.4
Properties of Calcite ... ... ... 5 Experimental Results... 7 Discussion... 11 Appendices... 15 Illustrations Structure of Calcite ... . ... 6a Infrared Absorption of Calcite... 6bAbsorption Spectrum of Irradiated Calcite- Unpolarized
Light ... 8a
Dependency of Absorption on Degree of Irradiation... 8b
Irradiation Dependency of Absorption for Isolated Bands.... 8c
Thermal Bleaching of Absorption Peaks ... 10a
Luminescence Band and Decay at Room Temperature... 10b
Comparison of Luminscence and Center Decay Rate ... 14a Relative Ionization Produced by Electron Irradiation... 17a Separation of Absorption Band in Calcite ... 17a
Due to their inherent structural simplicity and relatively easy
pre-paration alkali halide crystals have been the subject of most color center
research . Although considerable work has been done with these substances,
the detailed nature of color centers is not well understood. More recently
in an effort to gain further information, some of the more complicated
structures have been investigated. Among these are the divalent halides
such as CaF2(2) and several of the non cubic systems including quartz(3,4)
(5)
and corundum
Using samples of natural and synthetic quartz irradiated with x-rays, Cohen (4)found an anisotropic absorption band centered at 460 m. With
po-larized light a peak shift to 485 m was observed for the ordinary ray
(electric vector vibrating perpendicular to the c-axis). When the
extra-ordinary ray (electric vector parallel to the c-axis) was used the peak was
found at 460 mp. A second smaller peak present only for the extraordinary
ray was also reported. These centers are believed (4,6) to be associated
with Al impurities replacing Si in the lattice. These band peaks were
(1) See F. Seitz, "Color Centers in Alkali Halide Crystals II,
Rev. od. Phys. 26, 7, (1954)
(2) A. Smakula, Phys. Rev. 77, 408 (1950);
j9,
1570 (1953)A. Smakula, Z. Physik 138, 276 (1954)
W. Scouler and A. Smakula, Phys. Rev. 120, 1154 (1960)
D. Messner and A. Smakula, Phys. Rev. 120, 1162 (1960)
(3) A. Smakula, J. Opt. Soc. Am. 40, 266 (1950)
(4) A. F. Cohen, J. Chem. Phys. 25, 908 (1956)
- 2
-found(4) to saturate with absorption coefficients between 3.5 and 11 cm 1 depending upon the amount of Al present.
In a later series of experiments Cohen(6) irradiated with x-rays
samples of quartz containing Ge impurities as well as Al. He found an ad-ditional anisotropic band at 275 m with maximum absorption for the extra-ordinary ray.
Batrak measured the luminescence band of x-irradiated quartz and found a peak at 445 m . In order to explain this effect he proposed that the Al impurities substituting for Si in the lattice actually act as acti-vators playing a role similar to such impurities in ordinary phosphors.
Uncontaminated samples of quartz are very difficult to obtain, and there seems to be no mention in the literature about color centers in che-mically pure quartz.
X-ray coloration of corundum (Al203) single crystals produces(5)
absorp-tion bands at 400, 230 and 650 mp. The coloraabsorp-tion due to these centers is relatively stable at room temperature for moderate periods of time, i.e. weeks, but is found to saturate after a very short exposure. An absorption coefficient of only 0.4 cm is reported for the 400 m band.
Levy and Dienes(89) irradiated corundum with gamma rays and with neutrons. Using gamma rays they obtained essentially the same results as described above.
(6) M. C. M. O'Brien, Proc. Roy. Soc. A231, 404-14 (1955)
(7) E. N. Batrak, Sov. Phys. Crystallog.3, 633-4 (1958) (English translation)
(8) P. W. Levy and G. J. Dienes "Report of the Bristol Conference on Defects
in Crystalline Solids", The Physical Society, London (1955), pp. 256-260
(9) G. J. Dienes and G. W. Vineyard "Radiation Effects in Solids",
However, neutron irradiation was found to produce additional bands at 204,
260, and 165 m. During irradiation the latter bands increased in intensity
linearly at first, then more slowly at high levels of coloration. Levy and Dienes attributed the gamma coloration to ionizing effects, and the
addi-tional coloration produced by neutron bombardment to color centers resulting from displaced atoms. There seems to be no information available in the li-terature about the anisotropy of color centers in corundum.
Prigsheim(10) found that absorption bands in NaNO3 irradiated with x. rays resulted from two different effects. He was able to show that one band at 345 mL was produced by the conversion of the somewhat unstable
NO-3 ions into NO ions. An additional band at 335 mp which was easily bleached
by ultraviolet light, he attributed to color centers. Although these color
centers were easily bleached, he was able to find no photoconductivity as-sociated with them. He concluded therefore that in the back reaction each trapped electron must move only through a very short distance in returning to its ground state. As in the case of corundum, no study of the anisotropy of these absorption bands was made.
As can be seen from the preceeding, past investigations of color centers in non-cubic crystals have been for the most part complicated by the presence of chemical impurities, resistance to coloration, or chemical instability. In this study calcite was selected because large natural crystals of high purity and perfection were available. In addition, calcite is known to be
highly anisotropic.
- 4
-EXPERIMENTAL PROCEDURE
Since calcite is readily cleaved into rhombohedrons the preliminary investigations were done on cleaved samples. After cleaving, the samples
were ground and polished with "Linde A" to minimize surface scattering in
the ultraviolet region.
To obtain samples oriented parallel to the c-axis, the following
tech-nique was used. Since the cleavage rhombohedron bears a definite
relation-ship to the crystal lattice itself, it was possible to locate a plane con.-taining the c-axis simply by bisecting one of the obtuse cleavage face angles, and cutting the crystal along this line perpendicular to the bisected surface.
Samples produced in this manner were then ground and polished. To locate the
actual c-axis direction in the now exposed plane a petrographic polarizing
microscope was used. The procedure is described in standard textbooks on
optical mineralogy . In order to check the results obtained by this
me-thod, Laue x-ray photographs of the samples were used.
To color the calcite samples the M.I.T. Van de Graaf accelerator was used to produce 3 Mev electrons. Using electrons for irradiation has the
6 (12)
advantage that reasonably large (as much as 5x10 rads(12) accurately
con-trolled doses can be administered in a relatively short time. Usually only a few seconds are required as opposed to as much as several hours for
conven-tional x-ray doses of similar magnitude. This is a distinct advantage
espe-if the centers produced are thermally unstable. The effects of 3 Nov electrons
on atomic displacement production will be discussed later.
(11) see for example Rogers and Kerr "Optical Mineralogy", McGraw Hill Co. (12) The rad is defined as an energy dose of 100 ergs per gram of material.
Optical absorption measurements were made with a Beckman model DK-l spectrophotometer using an incandescent light source for the visible and long wave regions and a hydrogen lamp for the ultraviolet region. To ob-tain polarized light for anisotropy measurements a calcite air-gap prism was used.
In order to irradiate and measure the absorption of samples at -190°C a cryostat was used. This consisted of a vacuum chamber in which the sample was mounted and a container for liquid nitrogen to provide a low
temperature. To insure opacity at all wavelengths the cryostat was pro-vided with quartz windows.
PROPERTIES OF CALCITE
Calcite is a crystalline form of CaC3 belonging to the rhombohedral
(13) 6
class , group D (R 3 c). According to this classification it has
3d
atoms at the following positions:
Ca: 1, , 1; 3/4, 3/4, 3/4
C : 0, 0,0;
§,i
,0 : u, a, 0; , 0 , u; 0, u,; -u,u+,-#;
U+i, ,1 -U;? if U -U +2-.
where for a unit cell a - 6.361 A, a - 46*6' and u = 0.243 A. It consists
of planar C03 groups in which the carbon atoms are at the centers of
6
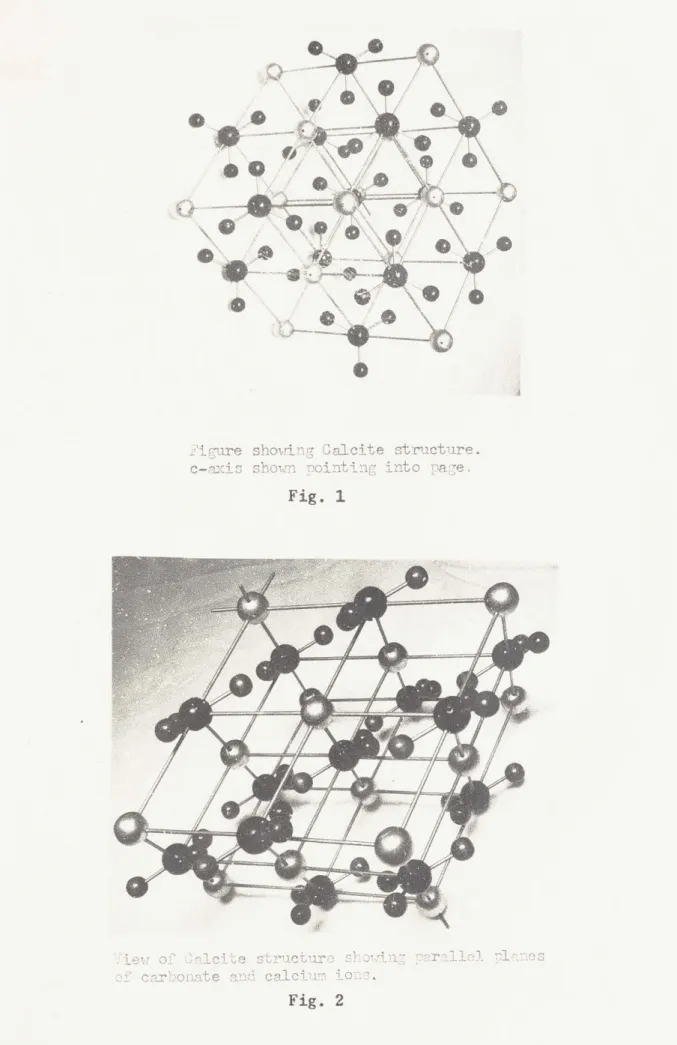
-lateral triangles of oxygen atoms. The C-0 distance is 1.25 A. The crystallography of calcite may also be described in terms of a hexagonal lattice in which the calcium and carbonate groups form alternating planes of atoms each perpendicular to the hexagonal c-axis. The structure of
calcite is illustrated in figs. 1 and 2.
Pure calcite is transparent from the ultraviolet absorption edge which lies at approximately 210 mp. to the first infrared absorption band found
at 1875 m . Those absorption bands which are located within the range of the Beckman instrument are shown in fig. 3. It was found that all these bands were anisotropic absorbing only light polarized perpendicular to the
c-axis.
Optically calcite is highly birefringent with indices of refraction for the sodium D line of o a 1.65849 and E 1.48625. At various wave-. lengths the indices of refraction are:
Wave Length Ordinary Ray Extraordinary Ray
198 m - 1.578
340 1.701 1.506
589 1.658 1.486
760 1.650 1.483
1229 1.639 1.479
Calcite is found in nature colored yellow, red, violet and pale blue as well as colorless. It has been found that these colored forms can be bleached by heating, exhibiting thermoluminescence, and when exposed to
ra-diation regain their colors. The chemical composition of yellow calcite
*i
Figure showing Calcite structure.
c-axis shown nointing nto pa -e Fig. 1
iewof Calcite structure showing prlle plans
of carbonate and calcium o
Fig. 3
INFRARED ABSORPTION OF CALCITE MEASURED AT -190 C
0.6-
-I
|
|
I
I
0 so» ~ t ~ *ososo.5'e 0.4o.44
was determined by Headden(15) who found traces of many rare earth ions as well as thorium and cesium. Przibram reported an absorption peak at
375 m in a sample of naturally colorless calcite irradiated by radium
radiation. He questioned whether this coloration was due to rare earth ions or due to centers in the basic material. The absorption spectrum of pure colored calcite has not been reported in the literature.
Calcite can be obtained in very pure form. Clevins and Straumanis(16) report finding samples of transparent calcite with less than 0.02% foreign material. The calcite samples selected for these experiments were highly
perfect as indicated by a uniformly low absorption coefficient in the trans-parent portion and a very sharp absorption edge at 210 mp.
EXPERI.MENTAL RESULTS
Preliminary experiments on cleaved samples irradiated with electrons at 3 Nev showed that it is possible to color calcite with moderate dosages
(10 - 105 rads). For comparison this was done at room temperature and at
liquid nitrogen temperature using the cryostat described above. To prevent any possible bleaching by light the samples were irradiated in light tight chambers in this and all subsequent trials. The results obtained were es-sentially the same at both temperatures although better resolution was ob-tained at -190°C. Although the bands produced were quite stable at -190°C
(15) H. Przibram and J. E. Caffyn, "Irradiation Colours and Luminescence"
Pergamon Press, London (1956),.pg. 236-8.
- 8
-there was some evidence of thermal bleaching during measurements made at room temperature. This will be discussed in greater detail later. As can be seen from fig. 4 there are at least two absorption bands present, one at 290 mi (4.28 ev.) and the other at about 350 mL (3.54 ev.).
To determine if any of the bands present were anisotropic, oriented calcite samples were prepared as described above. It was found that the
band at 350 mi was isotropic whereas the band at 290 ML was anisotropic
ab-sorbing only when excited by light polarized perpendicular to the c-axis. This anisotropy can be seen in figs. 5 and 6. Identical absorption spectra were obtained for samples irradiated and measured at room temperature and at liquid nitrogen temperature.
To determine the effect of increasingly larger doses on coloration, an oriented sample of calcite was subjected to repeated irradiations. To prevent thermal bleaching between trials the temperature of the samples was kept at -190°C. The results are shown in figs. 5 and 6. It can be seen
that no apparent shift of the absorption maxima for either band results from increasing the dosage. Also the half widths of the bands (isolated as
explained in appendix 3) are approximately constant independent of dosage. This result is expected if the statistical behavior of the centers produced is constant independent of the total number present. From Smakula's
formu-la(17) it follows that the total number of centers present is proportional
to the absorption coefficient of the band peaks.
The absorption peaks for the two bands are plotted in fig. 7. The color-ation is rapid at first, then increases more slowly as saturcolor-ation is approached.
a0- ABSORPTION OF CALCITE COLORED AT -190 C
Ol
04 --- v.0
4-.S4 3.S
3
ENERGY (electron volts)
- 8b -2.4 26 -- -z L 16-hi 14--z I a. ct T- S- 6-200 240 290 320 360 +00 4+0 480 520 560 600 WAVELENGTH my Fig. 5
2S-DEPMDENCE OF ABSORPTION SPEOTRU ON IRRADIATION DOSAGE
24- FOR EXTRAORDINARY RAY
1. uncolored 22 - 2. 105 ads 3. 2x10 rads 4. 5405 rads 20 5. 10 rade 18 -(5) (3) 6-4 (2) a- 4O o 320 360 400 44 +8 WA V 0L 52.0 CELENtAGTH0 "1& Fig. 6
PENDENCE OF ABSORPTION SPECTR
ON IRRADIATION DOSA
FOR ORDINARY RAY
1. uncolored 2. 105 rads 3. 2x10⁵ rads 4. 5x05 rads 5. 10 rads (5) (4) (3) (2) V AL hir 0. go q M OF OALCITE 1
1.
60 UM OF CALCITE Gm 560El GRAPH OF MAXIMA OF ISOLATED BANDS
-'01~~ VERSUS IRRADIATION DOSAGE
- (1) Isotropio band (2) Anisotropio band Ho -06 H 0. o...6 .... 0 .. .... insI DOSE (rads)
-9-In these experiments complete saturation of the centers was not obtained. Using Smakula's formula (see appendix 3) the approximate number of centers produced was computed. These results are tabulated below. Note that the number of centers associated with each band is equal at all inten-sities. Further implications of these results will be discussed later.
Number of Centers Produced by Electron Irradiation
Irradiation Isotropic Band Anisotropic Band Dose Peak Max. No. of Centers Peak Max. No. of Centers
(rads) (cm~ ) (nf) (cm-1) (n 0f)
1 x 10⁵ 2.7 8.4 x 10¹⁵ 2.0 8.3 x 10¹⁶
2 x 10⁵ 4.0 1.1 x 10¹⁶ 3.0 1.2 x 10¹⁶
5 x 10⁵ 7.0 2.5 x 10¹⁶ 5.3 2.4 x 10¹⁶
1 x 10⁶ 9.3 3.5 x 10¹⁶ 7.6 3.2 x 10¹⁶
Preliminary experiments on recoloration of previously colored samples bleached by heating at 400°C for an hour (calcite is stable at temperatures
up to 500°C) indicated that there is no permanent change in the defect
structure caused by irradiation at least at low levels. However this should be investigated further.
In order to determine the effect of light on the absorption bands in calcite, colored samples were exposed to illumination at various wavelengths. Using the Beckman spectrophotometer as a light source (with a slit width of
1 mm) an irradiated crystal was exposed for an hour first to light at 290 m
polarized perpendicular to the c-axis, and then to light at 350 mp polarized parallel to the c-axis. Finally the sample was exposed for 20 minutes to
unpolarized light from an incandescent source (using ordinary glass). No noticeable bleaching effects resulted from any of these trials. Similar experiments are known to produce bleaching of color centers in most com-pounds.
Although the color centers are quite stable at -190°C they bleach readily at room temperature. A measurement of the absorption peaks at 290 and 360 m showed that (1) both bands bleach at almost the same rate and
(2) coloration at room temperature and coloration at -190°C followed by room temperature bleaching result in identical bleaching rates. The results obtained are shown in fig. 8. It was found that weak bands identical to those described above were present in the calcite samples before irradiation, These bands are probably related to the previous history of the sample and may indicate that the centers are quite stable at low concentration.
Associated with the decay of the color centers is an orange luminescence which is quite intense imediately after irradiation and is still visible
after eight hours. This luminescence was measured using a Cary model 11 spectrophotometer with a luminescence attachment. The luminescence band ob-tained as shown in fig. 9 had a peak at about 590 m (2.10 ev.). It can be seen that the band is assymmetrical with greater intensity on the long wave-length side. The luminescence band was found to be isotropic.
In order to determine the decay rate of the luminescence a photocell and amplifier were used. Due to the limited sensitivity of this equipment
it was possible to obtain data only for the first 120 minutes of the decay process. The results of these measurements plotted logarithmically are given in fig. 10. The decay appears to be approximately exponential in nature.
Fig. 8
THERMAL DECAY OF ABSORPTION PEAKS IN CALCITE
MEASURED AT ROOM TEMPERATURE
(1) 90mp band, colored at 20 C ( m bAnd rlorm At - Qu n (3) 350 mp band, colored at 20 C (4) 350 my band, colored at -190 C U H14 (2) 0 0 S100 30 4 50 60 10 ?o 9o t00 TIME IN MINUTES El 6 H 110
I
I
I
I
6 LUlIMMCNCZ SPECTRUM OF OALCITE
IRRADIATED AIM EASURD AT WC
C -Ln w i 5o 6s0 0 700 g50 0s to WAVELENGTH Mp Fig. 9
4.-LUICECE DECAY OF CALCITE
IRADIAED AND MEAUREDAT 80C
tzlo co I-g F- 6 z z -4 20 t0 60 s0 100 20
MINUTES AFTER IRRADIATION
-
i
-In order to determine if the luminscent decay was associated with an increase of conductivity of the crystal a cleaved sample of calcite was irradiated and then coated with silver paint on two opposite faces. Wires were fastened to the silver coatings and connected in series with a 300 volt source and a sensitive ammeter. The resulting current was measured and found to be less than 5 x 10-12 amps. This is equivalent to a
resis-13
tance greater than 6 x 10 ohms or a resistivity for the sample greater than about 3 x 10¹⁴ ohms-cm. Apparently therefore no noticeable increase in conductivity is produced during the luminescent decay process. Hence electron migration, if present, is local in nature.
DISCUSSION
Two principal absorption bands have been found in calcite irradiated with electrons. One at 290 m is excited only by light vibrating perpendi-cular to the c-axis of the crystal; the other at 350 i is isotropic. This result suggests that the 290 m band is associated with the carbonate group and that the 350 m band is associated with calcium, since the former is intrinsically anisotropic in the crystallographic direction indicated above, and the calcium lattice position is intrinsically isotropic. It appears that an additional isotropic band adjacent to the fundamental absorption edge is also produced. Whether this increased absorption in the neighbor-hood of the absorption edge is due to the formation of a specific color
center, or simply results from a breakdown of the edge structure due to crystal damage, is not known.
Several of the experimental results indicate a close connection bet-ween the two principal bands. As described above, calculations have shown
that the number of centers associated with each of these bands is approxi-mately equal at all coloration levels. Coloration of both bands proceeds linearly at first, then more slowly as saturation is approached. Thermal bleaching measurements show that both bands bleach at the same rate. On
the other hand, optical bleaching studies have indicated that both bands are stable during moderate optical excitation.
As a possible mechanism to explain these results the following is proposed. CaC03 can be considered as an ionic crystal composed of Ca
and COS" ions. When the crystal is formed, the two extra Ca electrons are transferred to the CO3 group forming an ionic bond. It is proposed that during irradiation some of these extra electrons are transferred
back from the CO3 groups to the Ca ions, thereby producing additional energy levels in both structures. It is these additional levels that produce the observed absorption bands.
It is doubtful that such a process would be stable at all even at
-.190C if it took place in a perfectly regular lattice. Pekar asserts
that excited states in a perfect crystal are always a result of excitation of the crystal as a whole and never result from an excitation in localized regions. Hence it is almost certain that the CO3 electron is either trans-ferred to a Ca ion through a defect in the lattice so that the two ions are effectively separated by a gap in the crystal, or that the extra electron is transferred to a calcium vacancy where it is trapped.
(17) S. I. Pekar "Untersuchungen ber die Elektronentheorie der Kristalle" pg. 111, Akademie-Verlag, Berlin (1954)
- 13
-In these cases the possible number of centers which can be produced is limited by the number of vacancies present. Although complete satur-ation was not obtained, experiments at high colorsatur-ation indicate an appro-ximate saturation density of about 5 x 10¹⁶ centers/cm3 for each band.
The number of Ca ions in calcite is easily calculated and found to be 1.6
X 1022 ions/cm3. This is equivalent to
a defect concentration of approxi-mately 5 x 10 %. This concentration is somewhat larger (by about a factor
of 10) than that found in pure alkali halides, and probably results from
additional defects produced by irradiation.
The average energy required to produce each center can easily be com-puted. It can readily be shown(18) that for an irradiation dose of 1 rad
8 3
at 3 Nev. the number of incident electrons is 1.5 x 10 per cm of material.
Noting that each incoming electron has an energy of 3 MAy., the following energy values per center are obtained:
Irradiation Dose Number of Centers Average Energy Required per Center (rads) (centers/cm3) (ev/center)
5 x10 6.9 x10¹⁵ 3.2 x10²
2 x 10⁵ 1.2 x 10¹⁶ 7.1 x 10³
106 3.2 x 10¹⁶ 1.4 x 10⁴
These calculations show that the efficiency of the color center pro-duction decreases rapidly as saturation is approached. At low levels of coloration, e.g. at 5 x 10⁹ rads the energy value is about the same as that
reported for color center formation in other substances(19)
(18) see appendix I.
At room temperature the absorption bands are unstable and decay ther-mally. According to the model proposed above, this should occur when elec-trons trapped at the Ca sites are thermally released and return to the CO3
ions. Since this final configuration is more stable and hence has a lower energy than before, and since the direction of return of the electrons is random, an isotropic luminescence band should be produced. Such a band is actually observed at 590 mg.
If the luminescence is related to the destruction of Ca centers in a simple way its intensity should be proportional to the rate of change of the number of centers in this band. Using the experimentally observed
fact that the half width of the band is constant at all levels of coloration it follows from Smakula's formula that the same proportionality should exist between time derivative of the absorption maximn for this band and the lu-minescence intensity. The results of such a comparison are plotted in fig. II. As can be seen from the graph, there is close agreement between the shapes of the two curves only after about 40 minutes of decay. At first the luminescence decays much'more rapidly than the absorption band. This seems
to indicate that the luminescence reaction is not as simple as might be thought. This aspect of the problem should be investigated further.
Finally the fact that the absorption spectrum is the same regardless of whether the crystal is colored at room temperature or at -190°C indicates that identical centers are produced at both temperatures. It should be noted however (see fig. 8) that slight differences in the thermal decay rates are found for the two cases, with coloration at -190°C producing an initially faster decay rate. This is probably due to the formation of a
COMPARISON OF LUMINESCENCE INTENSITY AND COLOR CENTER DECAY RATE
(1) Luminesoenoe intensity 0) Color oenter deoay rate
(f~ H
z
D so 40 C 30 Uf z LLJz
2.0 Li (-) Z to C) 0 10 -j H >0 t o o TIME IN MINUTES 0.1 Fig. 11 o. 4--dOtaio dt c0.3 (1 ) zo 40 60 I2.o i0 0,11-small proportion of weakly bound color centers at the low temperature. (20)
Similar results have often been reported for alkali halides
APPENDIX I Effects of Electron Irradiation on Calcite
In order to displace an atom from its lattice position a certain amount of energy is required. Seitz(21) estimated the magnitude of this
energy E dfor interactions with fast particles as about 4 E where E is
dc c
the energy of sublimation of atoms from the substance. For most compounds this energy is approximately Ed - 25 ev. Other researchers have placed
this value as high as 40 ev. depending upon the orientation of the crystal lattice during irradiation. Using the value 25 ev. as the necessary dis-placement energy, it is possible to compute the incident energy of bombard-ing particles necessary to produce lattice transformations. With electrons a relativistic equation giving the energy transfer must be used. For hea-vier particles a non-relativistic equation is sufficient. The following equations are used for direct (forward) collisions.
E 2E (E + 2 mc2) M 2
m 2c
E - 4 M E / (M + M)2
m 12 1 2
where E is the maximum energy transferred by a moving particle of mass M,
m
and energy E to a stationary atom of mass M. m is the electronic mass and 2
c is the velocity of light.
(21) see G. D. Dienes and G. H. Vineyard "Radiation Effects in Solids" Interscience Publishers New York (1957), pg. 56-58
- 16
-(22)
One finds for various atomic weights of the stationary atoms the following energies:
atomic weight 10 50 100 200
neutrons, protons 76 325 638 1263 (ev) electrons, x-rays 0.10 0.41 0.68 1.10 (Mev)
This would indicate that in the case of calcite some lattice defects should be produced by electrons of the energy (3 Rev) used.
In order to determine the efficiency of the coloration process, it is advantageous to compute the number of electrons incident on a gram of calcite during irradiation. This can be done as follows. Since one rad is equal to 100 ergs/gram and 1 ev equals 1.6 x 10' ergs we have
1 erg - 12 ev. •
6Mev.
1.6 1.6
Therefore 1 rad 108 Mev./g.
1.6
3
If d, the density equals the naer of grams/cm we have for the total energy absorbed by one cubic centimeter of material upon exposure to 1 rad,
108 d My =NE 1.6 "CU~
where N is the number of electrons absorbed/cm3 and E is the energy per electron.
8
Therefore N 10 d Me , l.6E a7
or if E equals 3 Rev. and d equals 2.711 g/cm3,
(22) G. D. Dienes and G. H. Vineyard "Radiation Effects in Solids" Interscience Publishers New York (1957), pg. 56-58
7
N - 5.65 x 10 electrons/g/rad.
- 1.53 x 10⁸ electrons/cm3/rad.
APPENDIX II Dosage and Range of Electrons in Calcite
(23)
Using aluminum as a typical absorber, Trump et al determined the relative ionization produced by a beam of 3 Nev. electrons at various points inside the material. The results of this experiment are shown in fig. 12. Although the data obtained in the experiment utilized an absorber
(23)
of aluminum, it has been shown that if the absorber thickness, r is expressed in terms of a new variable R - rp, where d is the density of the absorber, the results are valid for any material. This follows from the fact that the absorption of energy by the material through ionization is very nearly proportional to the density of material used.
Using these results one can calculate the approximate dosage adminis-tered to the sample in terms of the voltage and current used in the particle accelerator. The following formula is found to apply.
P = E I / (D/2)2 K K watts/g.1 2
where D is the diameter of a circular absorber, K is the fraction of the total power absorbed in the range R and K2, approximately equal to 1,
ac-counts for backscatter. In the above diagram K, is equal to the shaded area (where R is the thickness of the absorber) divided by the total area under
0
the curve).
Using the results of this equation, irradiation time for any desired
- 17a
-1o00
SEPARATION OF THE ABSORPTION BANDS IN CALCITE
l) Absorption spectrum for ordinary ra
0) Absorption spectrum for extraordina
) isotropic band associated with the
(1) fundamental absorption edge
(4) Principal isitropic band
(5) Principal anisotropio band
(2) to ( 200 a40o 0 +4 WAVE LEWGT T V y ry ray Fig. 13 N t r LI-U1 0 F 0 U)
RELATIVE IONIZATION PRODUCED IN MATERIALS
IRRADIATED WITH ELECTRONS AT 3ev
.4 0 4 o-8 0. o- r 1.4 6 ABSOSER Tocastss (8/.) R Fig. 12 70 60 So 20
dose can readily be computed. For the Van de Graaf instrument used these irradiation times were of the order of a few seconds.
From the above figure it can easily be seen that the penetration of electrons into the absorber is about 1.5 g/cm2 at 3 Nev. For calcite
hav-inga density of 2.41 g/cm3 this is equivalent to a thickness of 5.5 mm. Actually the greater part of the ionization is constrained to about 1.0 g/
2
cm or 3.7 m, and for consistent results a sample thickness greater than
this should not be used. Most of the samples used in these experiments ere less than 3 mm thick.
APPENDIX III Computation of the Number of Color Centers
Using Smakula's formula(24) it is possible to compute the density of color centers present in a colored crystal if the absorption peak amplitude
and the band width can be measured. The following equation is used:
9 k nmJ - AV1/2 (27 +,A1)1/2)
nof a FM F
It (n + 2)26 2 (V F + Z1/2)
2
where n is the density of color centers, isthe frequency of the center of the band, f is the oscillator strength of the transition, k is the
ma-ximum absorption and l'1/2 is the band half-width. Using Beer's law and making the approximation that1?/F -)>V' 1/2, the following result is obtained.
n f •1.29 x 10¹⁷ n a W
nf = 9x2 + 2)2 m
with n the index of refraction of the material, a athe absorption coefficient
- 19
-and W the b-and width expressed in electron volts. In rough calculations such as given here f is usually considered to be unity.
To use this formula in the present situation it is necessary to se-parate the two principal absorption bands. This was done in all cases by first drawing in the approximate absorption produced by the additional band which is apparently centered near the fundamental absorption edge. This band was then subtracted from the absorption spectrum for the extraordinary ray to isolate the isotropic band. To isolate the anisotropic band the absorption spectrum for the extraordinary ray was subtracted from the ab-sorption spectrum for the ordinary ray. The technique is illustratedin fig. 13 for a sample irradiated at -190°C with a dose of 106 rads.
Although this procedure is valid to a first approximation, it has se-veral limitations. It assumes first of all that the anisotropic band is completely anisotropic, i.e. that it absorbs no light polarized parallel to the c-axis. That this is actually the case seems probable from fig. 13 since there is no evidence of a second peak for the extraordinary ray. More important, however, as described above, a third absorption band cen-tered near the fundamental absorption edge of calcite is almost certainly present. At high levels of coloration, as in the case illustrated, the overlap of this band and the principal isotropic absorption band is consi-derable. Hence any errors in estimating the former will have a significant effect on the isotropic band. The results obtained for small irradiation dosages are more reliable since they do not suffer from this limitation.