HAL Id: hal-02865578
https://hal.univ-lorraine.fr/hal-02865578
Submitted on 15 Sep 2020
HAL is a multi-disciplinary open access
archive for the deposit and dissemination of sci-entific research documents, whether they are pub-lished or not. The documents may come from teaching and research institutions in France or
L’archive ouverte pluridisciplinaire HAL, est destinée au dépôt et à la diffusion de documents scientifiques de niveau recherche, publiés ou non, émanant des établissements d’enseignement et de recherche français ou étrangers, des laboratoires
Impact of Uric Acid on Hypertension Occurrence and
Target Organ Damage: Insights From the STANISLAS
Cohort With a 20-Year Follow-up
Mehmet Kanbay, Nicolas Girerd, Jean-Loup Machu, Erwan Bozec, Kévin
Duarte, Jean-Marc Boivin, Sandra Wagner, Joao Pedro Ferreira, Faiez
Zannad, Patrick Rossignol
To cite this version:
Mehmet Kanbay, Nicolas Girerd, Jean-Loup Machu, Erwan Bozec, Kévin Duarte, et al.. Impact of Uric Acid on Hypertension Occurrence and Target Organ Damage: Insights From the STANISLAS Cohort With a 20-Year Follow-up. American Journal of Hypertension, Oxford University Press (OUP), 2020, 33 (9), pp.869-878. �10.1093/ajh/hpaa030�. �hal-02865578�
Word count: 3194. Abstract: 255 Number of references: 42 Number of tables: 3 Number of figures: 1 Number of supplementary tables: 2 Number of supplementary figure: 1 Impact of Uric Acid on Hypertension Occurrence and Target Organ Damage: Insights
from the STANISLAS Cohort with a 20-YEAR Follow-up
Mehmet Kanbay(1), Nicolas Girerd(2), Jean-Loup Machu(2), Erwan Bozec(2), Kevin Duarte(2), Jean-Marc Boivin(2), Sandra Wagner(2), João Pedro Ferreira(2), Faiez Zannad(2), Patrick Rossignol(2)
(1) Department of Medicine, Division of Nephrology, Koc University School of Medicine, Istanbul, Turkey
(2) Université de Lorraine, INSERM CIC-P 1433, CHRU de Nancy, INSERM U1116, FCRIN INI-CRCT (Cardiovascular and Renal Clinical Trialists), Nancy, France.
Running title: Uric acid and hypertension
Corresponding author:
Pr Patrick Rossignol
Centre d’Investigations Cliniques-INSERM CHRU de Nancy
Institut lorrain du Cœur et des Vaisseaux Louis Mathieu
4 rue du Morvan
54500 Vandoeuvre Lès Nancy, France
Key words: uric acid, hypertension, pulse wave velocity, left ventricular hypertrophy, albuminuria, chronic kidney disease
Abstract:
Background: Recent studies have shown that hyperuricemia may be associated with incident hypertension (HTN). We examined whether serum uric acid (SUA) is a predictor of hypertension and target organ damage 20 years later in initially healthy middle-aged individuals.
Methods: Participants from the STANISLAS a single-center familial longitudinal cohort study (961 initially healthy adults and 570 children) underwent clinical and laboratory measurements at baseline and after approximately 20 years. Blood pressure (BP: using ambulatory BP measurements), urine albumin-to-creatinine ratio (uACR), estimated glomerular filtration rate (eGFR), left ventricular hypertrophy (LVH), diastolic dysfunction and carotid-femoral pulse wave velocity (cfPWV) were measured at the end of follow-up. Results: In the parent population, higher baseline or last SUA levels and higher change in SUA (ΔUA) were significantly associated with an increased risk of HTN development, even after adjusting for known HTN risk factors (all p<0.01). Higher baseline SUA was marginally associated with an increased risk of having high cfPWV (p=0.05). The association of SUA with BP increase was BMI-dependent (the increase in BP being greater in leaner subjects; interactionp<0.05), and the association of SUA with eGFR decline was age-dependent (the
decline in eGFR being greater in older subjects; interactionp<0.05). There was no significant
association between SUA and diastolic dysfunction or LVH. In the whole population (i.e. including children), a significant association between SUA at baseline and the risk of HTN and higher cfPWV was also found (both p< 0.02).
Conclusion: Increased SUA is associated with the development of HTN and vascular/renal target organ damage in initially healthy midlife subjects.
Introduction:
A number of studies indicate that the pathogenesis underlying the development of target organ damage (TOD) in hypertension (HTN) is associated with increased mitochondrial dysfunction, oxidative stress and renin angiotensin aldosterone system activation, all of which also occur in a hyperuricemic milieu (1, 2).
Recent studies have revealed the role of hyperuricemia in the pathogenesis of cardiovascular and renal diseases, HTN, metabolic syndrome and diabetes (3, 4). Hyperuricemia prevalence also displays an increasing parallel tendency similar to that of non-communicable diseases. The increase in hyperuricemia is believed to originate from diet changes and high fructose consumption in both low-income and developed countries (5-7). Mazzali et al. demonstrated a direct relationship between serum uric acid level (SUA) and HTN originating from decreased nitric oxide (NO) availability, endothelial dysfunction and renin-angiotensin-aldosterone system impairment leading to vasoconstriction (8, 9). In addition, a study conducted in rats indicated that increased SUA level is associated with inflammation, tubulointerstitial injury and fibrosis. Furthermore, hyperuricemia leads to a down-regulation of nitric oxide synthase 1 (NOS1) expression by the macula densa resulting in vasoconstriction (8, 10).
In spite of the above investigated studies, the presence of a direct relationship between HTN and hyperuricemia remains controversial (11). More comprehensive studies are thus required to elucidate this complex issue, including more well-designed population-based cohort studies to investigate exposure-outcome relationships. Furthermore, testing the hypothesis that increased SUA still carried increased risk for development of HTN and TOD in “metabolically healthy” subjects, defined in the absence of diabetes and kidney disease, a longitudinal study design also including children without any confounding risk factors is still
warranted. The STANISLAS cohort is a longitudinal familial cohort of initially healthy individuals enabling to investigate factors associated with HTN and TOD onset (12). With this background in mind, we aimed to investigate the relationship between SUA levels and the development of HTN and TOD while taking into account confounding factors.
Materials and Methods:
Study Design:
The STANISLAS cohort is a single-center familial longitudinal cohort comprised of 1006 families (4295 subjects) composed of at least two parents and two children > 6 years old from the Nancy region recruited in 1993-1995 at the Center for Preventive Medicine. The cohort was established with the primary objective of investigating gene and gene-environment interactions in the field of cardiovascular diseases. The families were deemed healthy, free of declared acute and/or chronic illness, in order to assess the effect of genetics on the variability of intermediate phenotypes on the transition toward disease. The term “Baseline” refers to visit (V1) in this report. The second (V2) and third (V3) visits were respectively conducted approximately 5 and 10 years later. The second visits were held between October 1998 and November 2000 resulting in the collection of serum and plasma samples of 756 families (2952 participants). The third visits were conducted in October 2003 recruiting 399 families (1330 subjects). Finally, the fourth (V4) visits were conducted from 2011 to 2016 involving 1705 subjects (12). Questionnaires were completed by the participants: a food frequency questionnaire and the international physical activity questionnaire (13). The IPAQ guidelines were followed to clean the data and calculate the weekly energy expenditure expressed in metabolic equivalent task minutes per week
(www.IPAQ.ki.se).
V4 additionally comprised vascular assessment tests including pulse wave velocity (PWV), 24-hr ambulatory blood pressure monitoring (ABPM) as well as transthoracic echocardiography tests for assessing left ventricular hypertrophy (LVH) and diastolic function. Blood and urine samples were collected in all four visits for analysis of lipid profile, SUA, creatinine and urine albumin/creatinine ratio (urine ACR). The CKD-EPI formula was used for calculation of estimated glomerular filtration rate (eGFR).
Study Subjects:
The main analyses were conducted in the parents of the cohort, thereby ensuring a higher homogeneity in patient characteristics. In addition, the whole cohort (i.e. including both parents and children) was also studied as a supplementary analysis.
Only participants who attended the fourth visit and had available SUA measurements were selected for the present analysis. Of the 2012 parents initially recruited in the STANISLAS cohort at baseline, 1003 attended both V1 and V4, 961 of whom had SUA measurements.
Definition of HTN, diabetes mellitus, diastolic dysfunction, LVH and PWV:
Office BP was measured 3 times in all participants, at 1-minute intervals, using an automatic brachial sphygmomanometer. The latter consisted of upper arm blood pressure measurement and passed validation after the participant had rested for at least 10 minutes. Office systolic and diastolic BP was calculated as the mean of the 3 measurements.
At the fourth visit, all participants underwent a 24-hour ABPM using the Spacelabs 90207 ambulatory BP monitor (Spacelabs Medical). The monitoring cuff was placed around the participant’s nondominant arm. The BP system was programmed to measure every 15
minutes from 6 AM to 10 PM and every 30 minutes from 10 PM to 6 AM. Central reading of the recordings was performed by a trained technician blinded to the participant's clinical features. A subject was considered as hypertensive if he or she had high blood pressure, confirmed by an elevated mean 24h ABPM with SBP ≥ 130 mmHg and/or DBP ≥ 80 mmHg in accordance with European recommendations (14), and/or at least one prescribed antihypertensive drug.
Diabetes at V1 was determined based on an evidence of high blood glucose level (>1.26 g/L for fasting blood glucose, >2 g/L otherwise) and/or the intake of at least one antidiabetic drug as per the American Diabetes Association guidelines (15). Diabetes at V4 was diagnosed based on medical records and/or previous parameters used in V1.
Presence of diastolic dysfunction was established according to the recommendations of the American Society of Echocardiography 2009 with subjects having at least two of the following three criteria,: septal e’ < 8 cm/s, lateral e’ < 10 cm/s, left atrial volume index > 34 ml/m² (16).
LVH was defined as having a left ventricular mass (LVM) ≥ 89g/m2
for women and 103 g/m² for men according to the recommendations of the American Society of Echocardiography 2015 (17).
Carotid-to-femoralPWV measurement was performed with Complior (Alam Medical,
France) and SphygmoCor CVMS (AtCor, Australia) devices using the recommendations of the European Network for Noninvasive Investigation of Large Arteries by trained operators (18), as previously reported (19).
In the present study, the association of SUA levels on the risk of developing HTN and related TOD from V1 to V4 was evaluated. Three parameters were considered as main exposure factors: SUA level at baseline (V1), SUA level at V4, Δuric acid (change from V1
(baseline) to V4).
A total of 10 outcomes measured at V4, either dichotomous or continuous, were studied: daytime systolic BP, daytime diastolic BP, urine ACR and urine ACR≥ 3 mg/mmol, eGFR, true PWV and PWV > 10m/s as continuous outcomes and LVH, HTN, diastolic dysfunction as dichotomous outcomes. Statistical models were adjusted for baseline characteristics (when SUA was analyzed with baseline value or as the change from baseline to V4) or for characteristics at V4 (when SUA was analyzed with the value at V4) (Supplementary Table 1).
Adjustment variables at baseline were office systolic BP, age, gender, current smoking status, body mass index (BMI), total cholesterol. Adjustment variables at V4 were 24-hr systolic BP, age, gender, current smoking status, BMI, total cholesterol, fasting blood glucose level, gout treatment, antihypertensive treatment. Gout treatment and antihypertensive treatment were not taken into account at V1 given that few patients were under these treatments (n=2 and n=10 respectively). Furthermore, due to the low number of subjects with a known status of fasting blood glucose level at V1, the latter was not used as an adjustment factor in order to avoid missing data issues. The selection of relevant adjustment variables was performed according to the studied outcome: when analyzing daytime systolic BP/diastolic BP outcomes, adjustment for systolic BP was not performed; when analyzing HTN outcome, adjustment for systolic BP and antihypertensive treatment was not performed. In addition, given the low number of urine ACR outcomes, forward selection procedures were performed: urine ACR models were adjusted for age, current smoking status, BMI in all
models and a supplementary adjustment for fasting blood glucose level and antihypertensive treatment was used when analyzing SUA at V4. We also performed sensitivity analyses with additional adjustments on BMI change between V1 and V4 (except for analysis with V4 uric acid), physical activity and diet (alcohol intake and meat and fish intake, known to be purin-rich food) (20).
Interactions of age, gender, BMI and antihypertensive treatment with SUA were also investigated. These interactions were tested in adjusted models and considered significant when p<0.05. Results of significant interactions are presented according to classes for categorical variables while arbitrarily chosen as the 10th, 50th and 90th percentiles for continuous variables.
Non-normally distributed continuous outcomes were log-transformed (true PWV). This transformation necessarily modified the interpretation of the association. Consequently, results are presented as beta estimate (β) and its 95% confidence interval (CI) for untransformed continuous outcomes and exponential of β (exp(β)) and its 95% CI for log-transformed outcomes.
To avoid adjusting for rare but clinically relevant features, 12 subjects taking gout or antihypertensive treatment at V1 were discarded from the models. Patients with diabetes (n=3) and left ventricular hypertrophy (n=9) at baseline were also excluded from the analyses.
All statistical analyses were performed using the SAS software version 9.4 (SAS Institute Inc., Cary, NC, USA). The level of statistical significance was established at p<0.05.
Baseline demographics of parent participants and of the whole cohort
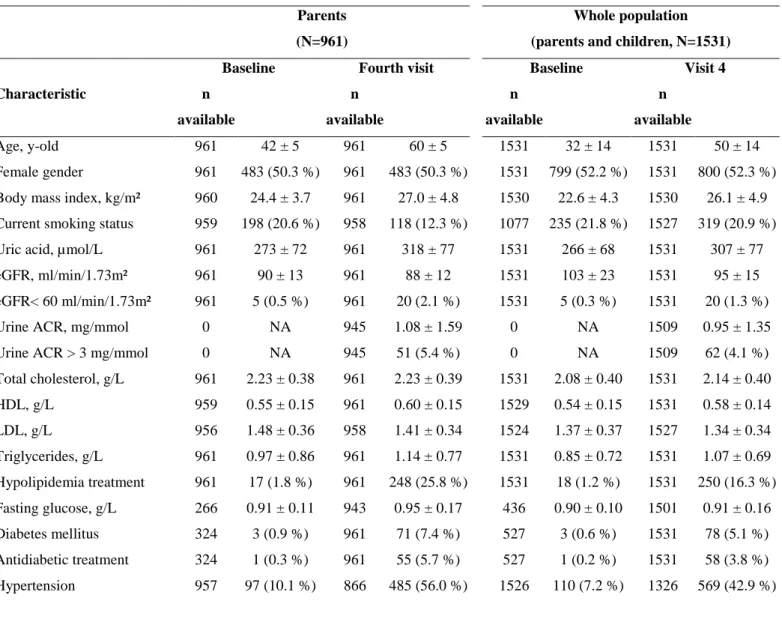
At baseline (V1), parent participants were middle-aged (mean age 42 ± 5 years), 10.1% had a history of HTN and only 1% took anti-HTN medication. Mean eGFR was 90±13 ml/min/1.73 m² and 9/243 participants with echocardiographic data had LVH (Table 1).
When considering the whole cohort (i.e. parents and children), mean age at V1 dropped to 32 ± 14 years (Table 1), the proportion of comorbidities as well as the proportion of TOD decreased (e.g. true PWV > 10 m/s 16.3% vs. 25.7%).
Association of serum uric acid with cardiovascular and renal dichotomous
outcomes
In parent participants, higher levels of SUA (either at V1 or V4) and a higher increase in SUA (ΔUA) were significantly associated with a higher risk of development of HTN even after adjusting for HTN risk factors (p<0.01 for all models) (Table 2). SUA at V1 and V4 were marginally associated with a higher risk of PWV > 10 m/s at V4. Moreover, SUA variables were not significantly associated with diastolic dysfunction, LVH or urine ACR (Table 2). In sensitivity analyses including additional adjustments on lifestyle factors, the results are the same, except for the association between HTN and changes in SUA, and SBP and SUA levels at V4 which became marginally significant (supplementary figure). Some marginal associations became non-significant (PWV for SUA levels at V1 and V4).
In the “whole population” (i.e. including children) sensitivity analysis (Table 2 and Supplementary Table 2), the results were very similar: SUA variables (baseline and changes) were significantly associated with the risk of HTN (Table 2, p<0.02). SUA at V1 was also significantly associated with a higher risk of PWV > 10 m/s at V4 (table 2: p<0.02).
Moreover, SUA at V1, V4 and changes were found associated with eGFR decrease (Supplementary Table 2: all p values <0.02).
Association of serum uric acid with cardiovascular and renal continuous outcomes:
interaction with BMI and age
Several significant interactions were found in adjusted linear regression models (all interactions p<0.05, Table 3). The association of SUA (at baseline and V4) with SBP and DBP was dependent on BMI while the association of SUA (at baseline and V4) with eGFR was dependent on age. The interplay of these associations with BMI and age is depicted in Figure 1. There was no significant interaction of PWV with age or BMI. No interaction with sex was found.
The association between higher baseline SUA and higher daytime SBP and DBP decreased with increasing BMI (Table 3 and Figure 1a and 1b). This association was significant for BMI 20.3 kg/m² (rise of 2.06 mmHg in SBP and 1.00 mmHg in DBP per 70 µmol/l increase in SUA) and 23.8 kg/m² (rise of 1.32 mmHg in SBP per 70 µmol/l increase in SUA) but not for BMI greater than 25 kg/m² (Figure 1a). A similar pattern was observed for V4 SUA (Table 3 and Figure 1b).
The association between higher baseline SUA and lower eGFR increased with higher age (Table 3 and Figure 1c). This association was significant for age 41 years (decrease of 1.22 ml/min/1.73m2 per 70 µmol/l increase in SUA) and age 48 years (decrease of 2.26 ml/min/1.73m2 per 70 µmol/l increase in SUA) but not for ages lower than 40 years (Figure 1c). A similar pattern was observed for V4 SUA (Table 3 and Figure 1d).
Discussion
This long-term (20-year) survey shows that an increased SUA level is prospectively associated with development of HTN, a decline in eGFR and impaired PWV at V4 even after adjusting for well-known risk factors.
It has been more than a century since Frederick Mahomed first published his article in Lancet highlighting the relationship between SUA level and HTN in 1879 (21). After this landmark publication, a vast number of studies have been conducted and controversy regarding causality between SUA and HTN has remained for decades (22). Although underlying mechanisms are not precisely known, a few suggested hypotheses have emerged from experimental studies. Watanabe et al. pointed out that once hyperuricemia-mediated renal injury reaches a significant threshold level, salt-sensitive HTN is observed among animals regardless of SUA level, leading the authors to suggest triggered pre-glomerular vascular disease as main pathology. Hyperuricemia-induced smooth muscle cell (SMC) proliferation induced by mitogen activated protein kinase, platelet-derived growth factor and cyclooxygenase-2 also leads to pre-glomerular vasculopathy (10). Another mechanism suggested by Mazzali et al. proposes that hyperuricemia induces renin-angiotensin aldosterone activation and impairment in macula densa nitric oxide synthase resulting in increased BP (8, 9). Furthermore, hyperuricemia may directly cause LVH, endothelial dysfunction, insulin resistance, blood pressure variability and microvascular disease, independently from causing HTN (23, 24).
Another potential suggested mechanism is related to the expression of the UA transporter in vascular smooth muscle cells leading to their proliferation (25, 26), the latter of which may cause PWV impairment. Entry of UA into the cell through voltage-gated and organic anion transport pathways induces cell pathways associated with vascular smooth
muscle cells (25). Uric acid-mediated vascular dysfunction can also originate from reactive oxygen species produced as a byproduct of the conversion reaction of hypoxanthine to UA by xanthine oxidase. Reactive oxygen species lead to smooth muscle cell proliferation and impairment in the nitric oxide pathway resulting in arteriolosclerosis (27).
In the present study, association of SUA and HTN was found to be statistically significant among patients with lower BMI whereas this association ultimately disappeared with higher waist circumference and BMI. SUA and increased BMI are known to interact with each other (28), Qiu et al. furthermore identified BMI as one of the most important determinants of SUA possibly due to increased diet intake, notably purin-rich food, known to modulate SUA, with the correlation between SUA and HTN weakened after adjustment for BMI (29, 30). Similarly, a cross-sectional study conducted in a Nepalese population revealed a decreased association between SUA and HTN after adjustment for BMI, thereby leading the authors to suggest that SUA level and obesity are confounding factors given that obesity leads to an exaggerated inflammatory response causing endothelial dysfunction (31).
Our analysis further indicates that the increased risk of HTN and impaired PWV correlated with SUA level became statistically significant when the initial population of children at baseline was included in the analysis. Indeed, increased uricemia at the beginning of childhood carries risk factors for future development of HTN. The Bogalusa Heart study published in 2004 accordingly revealed a statistical correlation between SUA level and BP (32). Tomiyama et al. also showed that hyperuricemia may have a role in the development of impaired PWV, inflammation and HTN (33). In addition, a cross-sectional cohort study conducted by Viazzi et al. identified SUA as an independent risk factor for HTN development (34). Similarly, recent studies have demonstrated the effectiveness of allopurinol use on treatment of HTN diagnosed among adolescents and adults (35, 36). Such significant
correlation between SUA and HTN among children emphasizes the role of SUA on pathogenesis given that children have less comorbidities and confounding risk factors compared to adults.
The STANISLAS cohort participants displayed a normal kidney function both at baseline and at V4 (average V4 eGFR in parents: 88 ± 12 ml/min/1.73m2, 2.1 % with an eGFR <60 ml/min/1.73m2). In this setting, our study also revealed that higher SUA levels at V1 and V4 were significantly correlated with lower eGFR at V4, this correlation being more prominent among elderly participants. Our findings are consistent with results of previous studies. A large-scale study conducted by Chang et al. identified SUA level as an independent risk factor for chronic kidney disease development among middle-aged and elderly Taiwanese adults (37). eGFR was moreover negatively correlated with SUA level, leading to suggest that the underlying pathophysiological relationship between SUA and chronic kidney disease encompasses inflammatory pathway activation and endothelial dysfunction as suggested in HTN development (1, 2). A randomized clinical trial conducted by Goicoechea et al. concluded to decreased hospitalization rates, cardiovascular events and slowed progression of chronic kidney disease among patients treated with allopurinol (38). Notably, treatment also improved the inflammatory markers CRP, TNF-alpha and endothelial function (39). In the past, hyperuricemia and metabolic syndrome/obesity relationship shared a similarity with the “chicken or egg?” question. However, recent studies have shown hyperuricemia as having an independent contributory effect on metabolic syndrome and obesity (1, 2, 10). Tumor necrosis factor is a proinflammatory and atherogenic adipocytokine in which a hyperuricemia-induced increase in tumor necrosis factor level was found to be associated with downregulation of the insulin receptor pathway contributing to insulin resistance (40, 41). Moreover, Nakagawa et al. highlighted the correlation between fructose-induced hyperuricemia and metabolic
furthermore considered as a key regulator of insulin resistance since NO-induced vasodilation in muscle cells increases glucose uptake and utilization, resulting in decreased blood glucose level (5).
Our study has several limitations. Firstly, given the observational nature of the study, it is therefore not possible to establish a causal link with the results obtained. Second, food intake was not taken into account in this study. Third, 24-hour ABPM to diagnose masked hypertension and 24h- proteinuria to define chronic kidney disease at early stage were not assessed at the first visit in this initially healthy population. A major strength and novelty of this study is that it was conducted in an initially generally healthy population also including children with long term follow-up and large sample size.
In conclusion, the present analysis identified a significant association between SUA level and HTN and TOD (both vascular and renal) within the 20-year STANISLAS cohort of initially healthy participants. This study highlights the necessity of designing multicenter randomized-controlled studies with large sample size and long-term follow-up in order to investigate the effect of current therapeutic approaches in patients with (a)symptomatic hyperuricemia on the prevention of development of HTN and TOD.
Acknowledgements
We are highly grateful to the Vandoeuvre-Lès Nancy Centre de Médecine Préventive staff, and to Dr Sophie Visvikis-Siest (INSERM U1122) who managed the STANISLAS Cohort for the first three visits. The authors deeply thank the Staff of the Clinical Investigation Center and other personnel involved in the Stanislas Cohort management: Biostatisticians: Fay R, Lamiral Z, Machu JL. Computer scientists: Boucenna N,
Gallina-Müller C, Maclot PL, Sas T. Co-investigators: Chau K, Di Patrizio P, Dobre D, Gonthier D, Huttin O, Malingrey L, Mauffrey V, Olivier A, Poyeton T, Steyer E, Watfa G. Datamanagers: Cimon P, Eby E, Merckle L. Data entry operators: Batsh M, Blanger O, Bottelin C, Haskour N, Jacquet V, Przybylski MC, Saribekyan Y, Thomas H, Vallée M. Echocardiographists, echographists: Ben Sassi M, Cario S, Camara Y, Coiro S, Frikha Z, Kearney-Schwartz A, Selton-Suty C, Watfa G. Imaging engineer: Bozec E. Laboratory Engineer: Nuée-Capiaumont J, and Technicians: Fruminet J, Kuntz M, Ravey J, Rousseau E, Tachet C. Project managers: Bouali S, Hertz C. Quality engineer: Lepage X. Registered Nurses: Giansily M, Poinsignon L, Robin N, Schmartz M, Senn M, Micor-Patrignani E, Toutlemonde M. Hospital technician: Fleurot MT. Resident physicians: Alvarez-Vasquez R, Amiot M, Angotti M, Babel E, Balland M, Bannay A, Basselin P, Benoit P, Bercand J, Bouazzi M, Boubel E, Boucherab-Brik N, Boyer F, Champagne C, Chenna SA, Clochey J, Czolnowski D, Dal-Pozzolo J, Desse L, Donetti B, Dugelay G, Friang C, Galante M, Garel M, Gellenoncourt A, Guillin A, Hariton ML, Hinsiger M, Haudiquet E, Hubert JM, Hurtaud A, Jabbour J, Jeckel S, Kecha A, Kelche G, Kieffert C, Laurière E, Legay M, Mansuy A, Millet- Muresan O, Meyer N, Mourton E, Naudé AL, Pikus AC, Poucher M, Prot M, Quartino A, Saintot M, Schiavi A, Schumman R, Serot M, Sert C, Siboescu R, Terrier-de-la-Chaise S, Thiesse A, Thietry L, Vanesson M, Viellard M. Secretaries: De Amorin E, Villemain C, Ziegler N. Study Coordinators: Dauchy E, Laurent S, and all persons not listed above who helped in the funding, initiation, accrual, management and analysis of the fourth visit of the STANISLAS cohort. Steering committee: Pierre Mutzenhardt, Mehdy Siaghy, Patrick Lacolley, Marie-Ange Luc, Pierre Yves Marie, Jean Michel Vignaud. Advisory members: Sophie Visvikis Siest, Faiez Zannad. Technical committee: Christiane Branlant, Isabelle Behm-Ansmant, Jean-Michel Vignaud, Christophe Philippe, Jacques Magdalou, Faiez Zannad, Patrick Rossignol. Scientific committee: Laurence Tiret, Denis Wahl, Athanase Benetos, Javier Diez, Maurizio Ferrari, Jean Louis Gueant,
Georges Dedoussis, François Alla, François Gueyffier, Pierre-Yves Scarabin, Claire Bonithon Kopp, Xavier Jouven, Jean-Claude Voegel, Jan Staessen.
The authors also thank the CRB Lorrain of Nancy CHRU for biobank handling, Pierre Pothier for the editing of the manuscript and the team (Sauvageot N, Alkerwi A, Albert A) headed by Pr Michelle Guillaume (Liege, Belgium) for granting us access to the FFQ and related algorithmic formula enabling nutrition analyses in the Stanislas cohort).
Funding sources:
The STANISLAS study is sponsored by the Nancy CHRU. This work is supported by the French Ministry of Health “Programme Hospitalier de Recherche Clinique Inter regional 2013”, by the Contrat de Plan Etat-Lorraine and FEDER Lorraine, and a public grant overseen by the French National Research Agency (ANR) as part of the second “Investissements d’Avenir” program FIGHT-HF (reference: ANR-15-RHU-0004) and by the French PIA project “Lorraine Université d’Excellence”, reference ANR-15-IDEX-04-LUE. It is also supported by the European Fibro-Targets Project (grant agreement No. SP7#602904), European HOMAGE project (grant agreement N° Heart “Omics” in Ageing, 7th Framework Program grant # 305507), the MEDIA project (Européen “Cooperation” – Theme "Health" / FP7-HEALTH-2010-single-stage (reference: 261409), FOCUS-MR (reference: ANR-15-CE14-0032-01), ERA-CVD EXPERT (reference: ANR-16-ECVD-0002-02), and the Fondation de Recherche en Hypertension Artérielle.
References:
1. Johnson RJ, Feig DI, Nakagawa T, Sanchez-Lozada LG, Rodriguez-Iturbe B. Pathogenesis of essential hypertension: historical paradigms and modern insights. J Hypertens. 2008;26(3):381-91.
2. Kanbay M, Jensen T, Solak Y, Le M, Roncal-Jimenez C, Rivard C, et al. Uric acid in metabolic syndrome: From an innocent bystander to a central player. Eur J Intern Med. 2016;29:3-8.
3. Jensen T, Niwa K, Hisatome I, Kanbay M, Andres-Hernando A, Roncal-Jimenez CA, et al. Increased Serum Uric Acid over five years is a Risk Factor for Developing Fatty Liver. Sci Rep. 2018;8(1):11735.
4. Kanbay A, Inonu H, Solak Y, Erden A, Uslu E, Yuksel SA, et al. Uric acid as a potential mediator of cardiovascular morbidity in obstructive sleep apnea syndrome. Eur J Intern Med. 2014;25(5):471-6.
5. Nakagawa T, Tuttle KR, Short RA, Johnson RJ. Hypothesis: fructose-induced hyperuricemia as a causal mechanism for the epidemic of the metabolic syndrome. Nat Clin Pract Nephrol. 2005;1(2):80-6.
6. Yerlikaya A, Dagel T, King C, Kuwabara M, Lanaspa MA, Andres-Hernando A, et al. Dietary and commercialized fructose: Sweet or sour? Int Urol Nephrol. 2017;49(9):1611-20.
7. Eren OC, Ortiz A, Afsar B, Covic A, Kuwabara M, Lanaspa MA, et al. Multilayered Interplay Between Fructose and Salt in Development of Hypertension. Hypertension. 2019;73(2):265-72.
8. Mazzali M, Hughes J, Kim Y-G, Jefferson JA, Kang D-H, Gordon KL, et al. Elevated Uric Acid Increases Blood Pressure in the Rat by a Novel Crystal-Independent Mechanism. Hypertension. 2001;38(5):1101-6.
9. Mazzali M, Kanbay M, Segal MS, Shafiu M, Jalal D, Feig DI, et al. Uric acid and hypertension: cause or effect? Curr Rheumatol Rep. 2010;12(2):108-17.
10. Kang DH, Nakagawa T, Feng L, Watanabe S, Han L, Mazzali M, et al. A role for uric acid in the progression of renal disease. J Am Soc Nephrol. 2002;13(12):2888-97.
11. Kanbay M, Segal M, Afsar B, Kang DH, Rodriguez-Iturbe B, Johnson RJ. The role of uric acid in the pathogenesis of human cardiovascular disease. Heart. 2013;99(11):759-66.
12. Ferreira JP, Girerd N, Bozec E, Merckle L, Pizard A, Bouali S, et al. Cohort Profile: Rationale and design of the fourth visit of the STANISLAS cohort: a familial longitudinal population-based cohort from the Nancy region of France. Int J Epidemiol. 2018;47(2):395-j.
13. Sauvageot N, Alkerwi A, Albert A, Guillaume M. Use of food frequency questionnaire to assess relationships between dietary habits and cardiovascular risk factors in NESCAV study: validation with biomarkers. Nutr J. 2013;12(1):143.
14. Mancia G, Fagard R, Narkiewicz K, Redon J, Zanchetti A, Bohm M, et al. 2013 ESH/ESC guidelines for the management of arterial hypertension: the Task Force for the Management of Arterial Hypertension of the European Society of Hypertension (ESH) and of the European Society of Cardiology (ESC). Eur Heart J. 2013;34(28):2159-219.
15. American Diabetes A. Diagnosis and classification of diabetes mellitus. Diabetes Care. 2010;33 Suppl 1:S62-9.
16. Nagueh SF, Appleton CP, Gillebert TC, Marino PN, Oh JK, Smiseth OA, et al. Recommendations for the evaluation of left ventricular diastolic function by echocardiography. Eur J Echocardiogr. 2009;10(2):165-93.
17. Marwick TH, Gillebert TC, Aurigemma G, Chirinos J, Derumeaux G, Galderisi M, et al. Recommendations on the use of echocardiography in adult hypertension: a report from the European Association of Cardiovascular Imaging (EACVI) and the American Society of Echocardiography (ASE)dagger. Eur Heart J Cardiovasc Imaging.
18. Van Bortel LM, Laurent S, Boutouyrie P, Chowienczyk P, Cruickshank JK, De Backer T, et al. Expert consensus document on the measurement of aortic stiffness in daily practice using carotid-femoral pulse wave velocity. J Hypertens. 2012;30(3):445-8.
19. Lopez-Sublet M, Girerd N, Bozec E, Machu JL, Ferreira JP, Zannad F, et al. Nondipping Pattern and Cardiovascular and Renal Damage in a Population-Based Study (The STANISLAS Cohort Study). Am J Hypertens. 2019;32(7):620-8.
20. Kaneko K, Aoyagi Y, Fukuuchi T, Inazawa K, Yamaoka N. Total purine and purine base content of common foodstuffs for facilitating nutritional therapy for gout and hyperuricemia. Biol Pharm Bull. 2014;37(5):709-21.
21. Mahomed F. On chronic Bright’s disease, and its essential symptoms. Lancet. 1879:398-404.
22. Johnson RJ, Feig DI, Herrera-Acosta J, Kang D-H. Resurrection of Uric Acid as a Causal Risk Factor in Essential Hypertension. Hypertension. 2005;45(1):18-20.
23. Kuwabara M, Kanbay M, Hisatome I. Uric Acid and Hypertension Because of Arterial Stiffness. Hypertension. 2018;72(3):582-4.
24. Cagli K, Turak O, Canpolat U, Ozcan F, Tok D, Mendi MA, et al. Association of Serum Uric Acid Level With Blood Pressure Variability in Newly Diagnosed Essential Hypertension. J Clin Hypertens (Greenwich). 2015;17(12):929-35.
25. Kang DH, Han L, Ouyang X, Kahn AM, Kanellis J, Li P, et al. Uric acid causes vascular smooth muscle cell proliferation by entering cells via a functional urate transporter. Am J Nephrol. 2005;25(5):425-33.
26. Price KL, Sautin YY, Long DA, Zhang L, Miyazaki H, Mu W, et al. Human vascular smooth muscle cells express a urate transporter. J Am Soc Nephrol. 2006;17(7):1791-5.
27. Yokoi Y, Kondo T, Okumura N, Shimokata K, Osugi S, Maeda K, et al. Serum uric acid as a predictor of future hypertension: Stratified analysis based on body mass index and age. Preventive Medicine. 2016;90:201-6.
28. Corry DB, Eslami P, Yamamoto K, Nyby MD, Makino H, Tuck ML. Uric acid stimulates vascular smooth muscle cell proliferation and oxidative stress via the vascular renin-angiotensin system. J Hypertens. 2008;26(2):269-75.
29. Qiu L, Cheng X-q, Wu J, Liu J-t, Xu T, Ding H-t, et al. Prevalence of hyperuricemia and its related risk factors in healthy adults from Northern and Northeastern Chinese provinces. BMC Public Health. 2013;13:664-.
30. Kanbay M, Ertuglu LA, Afsar B, Ozdogan E, Kucuksumer ZS, Ortiz A, et al. Renal hyperfiltration defined by high estimated glomerular filtration rate: A risk factor for cardiovascular disease and mortality. Diabetes Obes Metab. 2019;21(11):2368-83. 31. Poudel B, Yadav BK, Kumar A, Jha B, Raut KB. Serum uric acid level in newly
diagnosed essential hypertension in a Nepalese population: A hospital based cross sectional study. Asian Pacific Journal of Tropical Biomedicine. 2014;4(1):59-64. 32. Alper AB, Chen W, Yau L, Srinivasan SR, Berenson GS, Hamm LL. Childhood Uric
Acid Predicts Adult Blood Pressure. The Bogalusa Heart Study. 2005;45(1):34-8. 33. Tomiyama H, Shiina K, Vlachopoulos C, Iwasaki Y, Matsumoto C, Kimura K, et al.
Involvement of Arterial Stiffness and Inflammation in Hyperuricemia-Related Development of Hypertension. Hypertension. 2018;72(3):739-45.
34. Viazzi F, Antolini L, Giussani M, Brambilla P, Galbiati S, Mastriani S, et al. Serum Uric Acid and Blood Pressure in Children at Cardiovascular Risk. Pediatrics. 2013;132(1):E93-E9.
35. Feig DI, Soletsky B, Johnson RJ. Effect of Allopurinol on Blood Pressure of Adolescents With Newly Diagnosed Essential Hypertension: A Randomized Trial. JAMA : the journal of the American Medical Association. 2008;300(8):924-32.
36. Kanbay M, Ozkara A, Selcoki Y, Isik B, Turgut F, Bavbek N, et al. Effect of treatment of hyperuricemia with allopurinol on blood pressure, creatinine clearence, and proteinuria in patients with normal renal functions. Int Urol Nephrol. 2007;39(4):1227-33.
37. Chang HY, Tung CW, Lee PH, Lei CC, Hsu YC, Chang HH, et al. Hyperuricemia as an independent risk factor of chronic kidney disease in middle-aged and elderly population. Am J Med Sci. 2010;339(6):509-15.
38. Goicoechea M, de Vinuesa SG, Verdalles U, Ruiz-Caro C, Ampuero J, Rincón A, et al. Effect of Allopurinol in Chronic Kidney Disease Progression and Cardiovascular Risk. Clinical Journal of the American Society of Nephrology. 2010;5(8):1388-93. 39. Kanbay M, Siriopol D, Nistor I, Elcioglu OC, Telci O, Takir M, et al. Effects of
allopurinol on endothelial dysfunction: a meta-analysis. Am J Nephrol. 2014;39(4):348-56.
40. Popa C, Netea MG, van Riel PLCM, van der Meer JWM, Stalenhoef AFH. The role of TNF-α in chronic inflammatory conditions, intermediary metabolism, and cardiovascular risk. Journal of Lipid Research. 2007;48(4):751-62.
41. Baldwin W, McRae S, Marek G, Wymer D, Pannu V, Baylis C, et al. Hyperuricemia as a Mediator of the Proinflammatory Endocrine Imbalance in the Adipose Tissue in a Murine Model of the Metabolic Syndrome. Diabetes. 2011;60(4):1258-69.
42. Kanbay M, Afsar B, Siriopol D, Unal HU, Karaman M, Saglam M, et al. Relevance of uric acid and asymmetric dimethylarginine for modeling cardiovascular risk prediction in chronic kidney disease patients. Int Urol Nephrol. 2016;48(7):1129-36.
Figure legend:
Figure 1: Interaction of uric acid with age and BMI for the association between cardiovascular and renal continuous outcomes in multivariable linear regression in parent participants.
The red line represents the beta estimate, the black line represent interval. Panels (a) and (b) show the association respectively V1 (visit 1) and V4 (visit 4) SUA (serum uric acid) with SBP (systolic blood pressure) according to BMI (body mass index), panels (c) and (d) represent the association of V1 and V4 SUA with eGFR (estimated glomerular filtration rate) according to age. Red points are the 10th and 90th percentile of the x axis (BMI or age).
Table 1: Descriptive and demographic characteristics in parents and in the whole population (parents and children). Parents
(N=961)
Whole population (parents and children, N=1531)
Baseline Fourth visit Baseline Visit 4
Characteristic n available n available n available n available Age, y-old 961 42 ± 5 961 60 ± 5 1531 32 ± 14 1531 50 ± 14 Female gender 961 483 (50.3 %) 961 483 (50.3 %) 1531 799 (52.2 %) 1531 800 (52.3 %) Body mass index, kg/m² 960 24.4 ± 3.7 961 27.0 ± 4.8 1530 22.6 ± 4.3 1530 26.1 ± 4.9 Current smoking status 959 198 (20.6 %) 958 118 (12.3 %) 1077 235 (21.8 %) 1527 319 (20.9 %) Uric acid, µmol/L 961 273 ± 72 961 318 ± 77 1531 266 ± 68 1531 307 ± 77 eGFR, ml/min/1.73m² 961 90 ± 13 961 88 ± 12 1531 103 ± 23 1531 95 ± 15 eGFR< 60 ml/min/1.73m² 961 5 (0.5 %) 961 20 (2.1 %) 1531 5 (0.3 %) 1531 20 (1.3 %) Urine ACR, mg/mmol 0 NA 945 1.08 ± 1.59 0 NA 1509 0.95 ± 1.35 Urine ACR > 3 mg/mmol 0 NA 945 51 (5.4 %) 0 NA 1509 62 (4.1 %) Total cholesterol, g/L 961 2.23 ± 0.38 961 2.23 ± 0.39 1531 2.08 ± 0.40 1531 2.14 ± 0.40 HDL, g/L 959 0.55 ± 0.15 961 0.60 ± 0.15 1529 0.54 ± 0.15 1531 0.58 ± 0.14 LDL, g/L 956 1.48 ± 0.36 958 1.41 ± 0.34 1524 1.37 ± 0.37 1527 1.34 ± 0.34 Triglycerides, g/L 961 0.97 ± 0.86 961 1.14 ± 0.77 1531 0.85 ± 0.72 1531 1.07 ± 0.69 Hypolipidemia treatment 961 17 (1.8 %) 961 248 (25.8 %) 1531 18 (1.2 %) 1531 250 (16.3 %) Fasting glucose, g/L 266 0.91 ± 0.11 943 0.95 ± 0.17 436 0.90 ± 0.10 1501 0.91 ± 0.16 Diabetes mellitus 324 3 (0.9 %) 961 71 (7.4 %) 527 3 (0.6 %) 1531 78 (5.1 %) Antidiabetic treatment 324 1 (0.3 %) 961 55 (5.7 %) 527 1 (0.2 %) 1531 58 (3.8 %) Hypertension 957 97 (10.1 %) 866 485 (56.0 %) 1526 110 (7.2 %) 1326 569 (42.9 %)
Antihypertensive treatment 961 10 (1.0 %) 961 313 (32.6 %) 1531 10 (0.7 %) 1531 327 (21.4 %) Office SBP, mmHg 957 123 ± 12 960 130 ± 16 1526 120 ± 13 1530 126 ± 16 Office DBP, mmHg 957 75 ± 10 960 74 ± 9 1526 69 ± 13 1530 73 ± 9 24h-SBP, mmHg 0 NA 834 121 ± 11 0 NA 1290 120 ± 10 Daytime SBP, mmHg 0 NA 834 126 ± 11 0 NA 1290 125 ± 11 Nighttime SBP, mmHg 0 NA 834 112 ± 11 0 NA 1290 111 ± 10 24h-DBP, mmHg 0 NA 834 75 ± 7 0 NA 1290 74 ± 7 Daytime DBP, mmHg 0 NA 834 79 ± 8 0 NA 1290 78 ± 8 Nighttime DBP, mmHg 0 NA 834 67 ± 8 0 NA 1290 66 ± 8 True PWV, m/s 0 NA 937 9.2 ± 1.9 0 NA 1502 8.6 ± 1.8 True PWV > 10 m/s 0 NA 937 241 (25.7 %) 0 NA 1502 245 (16.3 %) Diastolic dysfunction 0 NA 932 281 (30.2 %) 0 NA 1492 287 (19.2 %) Index LVM, g/m² 243 72 ± 13 941 81 ± 20 377 71 ± 13 1505 77 ± 20 Left ventricular hypertrophy 243 9 (3.7 %) 941 179 (19.0 %) 377 13 (3.4 %) 1505 209 (13.9 %) Energy expenditure
(MET-minute/week) 0 NA 770 3440 ± 3638 0 NA 1299 3064 ± 3409
Alcohol intake (g/day) 0 NA 948 142 ± 202 0 NA 1531 132 ± 186 Meat and fish intake (g/day) 0 NA 948 171 ± 96 0 NA 1531 180 ± 103 Abbreviations: Urine ACR: Urine albumin-to-creatinine ratio, SBP: Systolic blood pressure, DBP: Diastolic blood pressure,
Table 2: Association of uric acid with cardiovascular and renal dichotomous outcomes in multivariable logistic regression models in parents and in the whole population (parents and children).
Logistic regression models HTN* OR (95%CI) LVH** OR (95%CI) Diastolic dysfunction** OR (95%CI) PWV > 10 m/s** OR (95%CI) uACR≥ 3 mg/mmol*** OR (95%CI) Parents (N=937) Uric acid V1,
for an increase of 70 µmol/l
1.32 [1.08 ; 1.61], p=0.008 0.93 [0.74 ; 1.17], p=0.54 1.13 [0.93 ; 1.37], p=0.23 1.23 [1.00 ; 1.50], p=0.051 1.23 [0.92 ; 1.66], p=0.16 Uric acid V4,
for an increase of 70 µmol/l
1.33 [1.12 ; 1.58], p=0.001 0.84 [0.68 ; 1.04], p=0.10 1.08 [0.90 ; 1.30], p=0.42 1.20 [0.98 ; 1.47], p=0.081 1.07 [0.80 ; 1.43], p=0.64 Change in uric acid,
for an increase of 50 µmol/l between V1 and V4 1.25 [1.09 ; 1.44], p=0.001 1.01 [0.87 ; 1.18], p=0.88 1.08 [0.94 ; 1.23], p=0.27 1.05 [0.91 ; 1.21], p=0.51 1.04 [0.82 ; 1.33], p=0.73 Whole population
(i.e. parents and children, N=1503)
Uric acid V1,
for an increase of 70 µmol/l
1.28 [1.06 ; 1.55], p=0.012 0.95 [0.76 ; 1.19], p=0.65 1.13 [0.93 ; 1.37], p=0.23 1.27 [1.04 ; 1.56], p=0.018 1.21 [0.90 ; 1.62], p=0.20 Uric acid V4,
for an increase of 70 µmol/l
1.12 [0.81 ; 1.55], p=0.48 0.69 [0.44 ; 1.09], p=0.11 1.08 [0.72 ; 1.62], p=0.70 0.94 [0.61 ; 1.44], p=0.77 1.81 [1.00 ; 3.27], p=0.05 Change in uric acid,
for an increase of 50 µmol/l between V1 and V4 1.25 [1.09 ; 1.42], p=0.0010 1.02 [0.88 ; 1.18], p=0.79 1.08 [0.95 ; 1.24], p=0.23 1.05 [0.91 ; 1.21], p=0.53 1.05 [0.82 ; 1.32], p=0.72 * Adjustment 1: age, gender, current smoker, BMI, total cholesterol (+ fasting blood glucose and gout treatment for uric acid at V4).
** Adjustment 2: age, gender, current smoker, BMI, total cholesterol, SBP (+ fasting blood glucose, gout treatment and antihypertensive treatment for uric acid at V4).
Abbreviations: HTN: hypertension, LVH: Left ventricular hypertrophy, PWV: Pulse wave velocity, uACR: Urine albumin-to-creatinine ratio, BMI: body mass index, SBP: systolic blood pressure
Table 3: Association of uric acid with continuous cardiovascular and renal outcomes in multivariable linear regression in the parent population. Daytime SBP* β(95%CI) Daytime DBP* β (95%CI) eGFR** β (95%CI) PWV** exp(β) (95%CI) Uric acid V1, for a 70 µmol/l increase BMI = 20.3 kg/m² 2.06 [0.72 ; 3.41], p=0.003 BMI = 23.8 kg/m² 1.32 [0.30 ; 2.33], p=0.011 BMI = 28.9 kg/m² 0.23 [-0.86 ; 1.31], p=0.68
Interaction with BMI. Please see Figure 1
BMI = 20.3 kg/m² 1.00 [0.05 ; 1.96], p=0.040 BMI = 23.8 kg/m² 0.51 [-0.21 ; 1.24], p=0.16 BMI = 28.9 kg/m² -0.20 [-0.97 ; 0.57], p=0.61
Interaction with BMI.
Age = 36 -0.36 [-1.71 ; 0.99], p=0.60 Age = 41 -1.22 [-2.19 ; -0.25], p=0.014 Age = 48 -2.26 [-3.55 ; -0.98], p=0.0006 Interaction with age.
Please see Figure 1
1.01 [1.00 ; 1.03], p=0.087 Uric acid V4, for a 70 µmol/l increase BMI = 21.6 kg/m² 1.16 [-0.01 ; 2.33], p=0.052 BMI = 26.3 kg/m² 0.46 [-0.37 ; 1.30], p=0.28 BMI = 33.1 kg/m² -0.56 [-1.65 ; 0.53], p=0.32
Interaction with BMI. Please see Figure 1
BMI = 21.6 kg/m² 0.66 [-0.18 ; 1.50], p=0.13 BMI = 26.3 kg/m² 0.15 [-0.45 ; 0.75], p=0.63 BMI = 33.1 kg/m² -0.59 [-1.38 ; 0.19], p=0.14
Interaction with BMI.
Age = 55 -1.46 [-2.71 ; -0.21], p=0.022 Age = 60 -2.31 [-3.20 ; -1.42], p=< 0.0001 Age = 66 -3.39 [-4.55 ; -2.24], p=< 0.0001 Interaction with age.
Please see Figure 1
1.01 [1.00 ; 1.03], p=0.070
Change in uric acid, for a 50 µmol/l increase between V1 and V4
0.40 [-0.27 ; 1.06], p=0.25 -0.07 [-0.55 ; 0.41], p=0.77 -1.87 [-2.52 ; -1.23], p=< 0.0001 1.01 [1.00 ; 1.02], p=0.21
* Adjustment 1: age, gender, current smoker, BMI, total cholesterol (+ fasting blood glucose, gout treatment and antihypertensive treatment for Uric acid at V4). ** Adjustment 2: Adjustment 1 + SBP.
Supplementary Figure. Table comparing the analyses from the article and sensitivity analyses including additional adjustments on lifestyle factors (physical activity, alcohol intake, meat and fish intake) and change in BMI in parents.
HTN LVH Diastolic
dysfunction PWV > 10 m/s uACR≥ 3 mg/mmol Daytime SBP
Daytime
DBP eGFR PWV
Uric acid
V1 article 20,3<bmi<28,9 bmi 20,3 if age≥41
Sensitivity
analyses 20,3<bmi<28,9 bmi 23,8 if age≥41
Uric acid
V4 article if bmi=21,6 all ages
Sensitivity
analyses if bmi=21,6 all ages
Change in uric acid article Sensitivity analyses significant marginally significant NS