HAL Id: hal-02499551
https://hal.archives-ouvertes.fr/hal-02499551
Submitted on 5 Mar 2020
HAL is a multi-disciplinary open access
archive for the deposit and dissemination of
sci-entific research documents, whether they are
pub-lished or not. The documents may come from
teaching and research institutions in France or
abroad, or from public or private research centers.
L’archive ouverte pluridisciplinaire HAL, est
destinée au dépôt et à la diffusion de documents
scientifiques de niveau recherche, publiés ou non,
émanant des établissements d’enseignement et de
recherche français ou étrangers, des laboratoires
publics ou privés.
Optimization of Conversion Treatment on Austenitic
Stainless Steel Using Experimental Designs
Souad El Hajjaji, C Cros, Lucien Ariès
To cite this version:
Souad El Hajjaji, C Cros, Lucien Ariès.
Optimization of Conversion Treatment on Austenitic
Stainless Steel Using Experimental Designs. International Journal of Metals, 2013, 2013, pp.1-7.
�10.1155/2013/757049�. �hal-02499551�
OATAO is an open access repository that collects the work of Toulouse
researchers and makes it freely available over the web where possible
Any correspondence concerning this service should be sent
to the repository administrator:
[email protected]
This is a Publisher’s version published in:
http://oatao.univ-toulouse.fr/24440
To cite this version:
El Hajjaji, Souad and Cros, C. and Ariès, Lucien
Optimization of Conversion
Treatment on Austenitic Stainless Steel Using Experimental Designs. (2013)
International Journal of Metals, 2013. 1-7. ISSN 2314-680X
Official URL:
https://doi.org/10.1155/2013/757049
Hindawi Publishing Corporation International Journal of Metals Volume 2013, Article ID 757049,7pages
http://dx.doi.org/10.1155/2013/757049
Research Article
Optimization of Conversion Treatment on Austenitic Stainless
Steel Using Experimental Designs
S. El Hajjaji,
1C. Cros,
2and L. Aries
21Laboratoire de Spectroscopie, Mod´elisation Mol´eculaire, Mat´eriaux et Environnement (LS3ME), Facult´e des Sciences,
Universit´e Med V-Agdal, Avenu Ibn Battouta, BP 1014, Rabat, Morocco
2CIRIMAT-LCMIE, Universit´e Paul Sabatier, 118 route de Narbonne, 31064 Toulouse Cedex 4, France
Correspondence should be addressed to S. El Hajjaji; [email protected]
Received 27 August 2013; Accepted 17 November 2013
Academic Editor: Chi Tat Kwok
Copyright © 2013 S. El Hajjaji et al. This is an open access article distributed under the Creative Commons Attribution License, which permits unrestricted use, distribution, and reproduction in any medium, provided the original work is properly cited.
Conversion coating is commonly used as treatment to improve the adherence of ceramics films. The conversion coating properties depend on the structure of alloy as well as on the treatment parameters. These conversion coatings must be characterized by strong interfacial adhesion, high roughness, and high real surface area, which were measured by an electrochemical method. The influence of all the elaboration factors (temperature, time, and bath composition: sulphuric acid, thiosulphate as accelerator, propargyl alcohol as inhibitor, and surface state) and also the interactions between these factors were evaluated, using statistical experimental design. The specific surface area and optical factor (𝛼) correspond to the quantitative responses. The evaluation showed, by using a designed experimental procedure, that the most important factor was “surface state.” Sanded surface allows the formation of conversion coating with high real surface area. A further aim was to optimise two parameters: treatment time and temperature using Doehlert shell design and simplex method. The growth of the conversion coating is also influenced by treatment time and temperature. With such optimized conditions, the real surface area of conversion coating obtained was about 235 m2/m2.
1. Introduction
Coatings have been developed from various materials using several deposition methods [1–3]. Electrochemical deposi-tion is an interesting technique to obtain corrosion protecdeposi-tion coatings, but the problem for such coatings is adhesion. In previous papers [4–6], we described an original method to strengthen the interface between ceramic layer and stainless steel or super alloy substrate. This method involves three steps. In the first, the metal surface is modified by a con-version treatment in an acid bath with S2− and acetylenic alcohol as additions, allowing the control of the conversion coating growth [6,7]. This pretreatment of the surface leads to a conversion coating which is very adherent, with a particular morphology, with micropores that allow deposition during the second step and contribute to the “anchoring” of the ceramic layer. In the second step, a refractory character is conferred to the surface by a cathodic treatment in a suitable bath, which induces the deposition of oxides or hydroxides
with varying degrees of hydration. In the third step, a thermal treatment leads to ceramic oxides and stabilized the coating. So, to strengthen the interface between ceramic and substrate, a specific pretreatment of the metal surface is proposed so as to form a conversion coating. The morphology of the surface is important and must present a very porous structure and a high specific area to facilitate the anchoring of the ceramic layer [5–7]. Many authors have studied the influence of different parameters in conversion treatment for different metal substrates and different applications [5, 8–
10].
This study was undertaken to elucidate the role of the different parameters and to optimise conversion coating on austenitic stainless steel. The parameters of conversion treatment have been studied using statistical experimental designs. The treatment process and the statistical designs are briefly reviewed before the experimental results are presented.
2 International Journal of Metals
Table 1: Chemical composition of austenitic stainless steel (wt%).
C Si Cu Mo S Cr Ni Fe
0.031 0.77 0.06 0.10 0.007 18.2 10.3 70.5
2. Materials and Methods
2.1. Conversion Treatment. Conversion coatings were
pre-pared on an austenitic stainless steel, its composition is given inTable 1. Samples were cleaned with tetrahydrofurane (ACROS ORGANIC, purity Z99%), washed with distilled water, and then dried in air at room temperature. Austenitic stainless steel conversion coating was obtained by chemical treatment in acid bath containing suitable additives and par-ticularly substances containing chalcogenides such as sulphur (sulphides, thiosulphates) [4–10]. Corrosion inhibitors like acetylenic alcohols are also required to facilitate the control of film growth in order to obtain coats with specific properties [4–10].
In order to homogenize the surface hardness, samples have undergone to a surface treatment of sanding or of microball tests.
After treatment, the samples were rinsed in demineralised water, and then dried at 70∘C for 10 minutes.
2.2. Electrochemical Study. The electrochemical
measure-ment was performed using a Tacussel model PRT 20-02 potentiostat. A saturated calomel electrode (SCE) was used as the reference electrode and a platinum electrode was used as the counter electrode.
2.3. Methodology of Experimental Research. The objective
of the methodology of experimental research (MER) is to search for an optimal strategy which allows obtaining the largest number of good quality information concerning a studied phenomenon, while carrying a limited number of experiments. These are informationally optimal mathemati-cal schemes in which all important factors are changed simul-taneously, thereby facilitating the identification of process relations as well as the location of the real process optimum.
2.3.1. Screening (Design I). The main purpose of a screening
study is to identify the most influential factors and those that may be regarded as inert. Fractional factorial designs [11] were chosen to evaluate the factors that significantly influence conversion coating morphology. For each problem formulated, the first problem is the choice of the factors which are the parameters that we can control. We must choose the variation limit of these factors which determines the experimental domain. These variations may have very different orders of magnitude, so that, to be able to compare the factor effects, it is necessary to work with the code levels of variation of each factor. For the present work, we have to evaluate the influence of fix factors, each at two levels (high (+1) and low (−1)). The selected parameters are listed inTable 2.
A factor is an assigned variable and the levels of the factor are the values assigned to the factor. Each experiment
represents a particular point of the experimental domain and provides a measurement with one or several responses of the phenomenon in this point.
In first step we used a 26-1 experiment; six factors each at two levels (+1,−1) were investigated; 32 trials were necessary for this fractional factorial design (Table 3). A factor is an assigned variable and the levels of the factor are the values assigned to the factor. The fractional factorial design consists in expressing the estimated effects in contrast. All experiments were performed in random order and the calculation was obtained by the NEMROD program [12].
2.3.2. Optimisation. In the second step, once the most
signif-icant factors have been identified, the next step is to optimise the process with respect to these factors. In this work, we used a “Doehlert uniform shell design” [13–15] and a simplex method [15].
In the present work, we studied two factors: treatment time (𝑋1) and temperature (𝑋2), requiring that six coeffi-cients be determined as follows:
𝑦 = 𝑏0+ 𝑏1𝑋1+ 𝑏2𝑋2+ 𝑏11𝑋21+ 𝑏22𝑋22+ 𝑏12𝑋1𝑋2. (1)
The experimental design is presented in Table 4. Their variation domains were determined in preliminary exper-iments (Table 4). To minimize the effect of uncontrolled factors and time variations, all experiments were performed in random order.
2.4. Measurement of Responses. In order to show the effect of
each factor, the studied responses are the real surface area or specific surface area (SS) of the conversion coating expressed in m2/m2and its optical properties (𝛼).
2.4.1. Measurement of Specific Area of the Coating. The main
characteristic of conversion coatings is their high porosity. The porous character was evaluated using cyclic voltammetry to obtain the real surface area. This method involves applica-tion of a potential E, which varies with time to an electrode, between −0.2 and −1.5 V/SCE in a 1 M sodium sulphate medium. The scanning rate was 20 mV/s. The measurements were performed with the three-electrode technique. This measurement assumes the formation of a monolayer of adsorbed hydrogen and one atom of hydrogen is taken as occupying 10 ˚A2[16,17]. The surface area for 1 cm2was given below:
SS=𝑄𝑁10 ˚A
2
𝑛𝐹 , (2)
where𝑄 is the quantity of electricity (coulomb) correspond-ing to the anodic peak area.𝑁 is Avogadro’s number. 𝑁 is the number of electron (H+ + 1e− → Hads, 𝑛 = 1) and 𝐹 = 96500C mol−1.
2.4.2. Measurement of Optical Property(𝛼). The total
hemi-spheric solar adsorption factor 𝛼 (ration of the energy adsorbed by the surface to the incident solar energy) was measured with an EL510 alpha meter (Elan Informatique).
International Journal of Metals 3
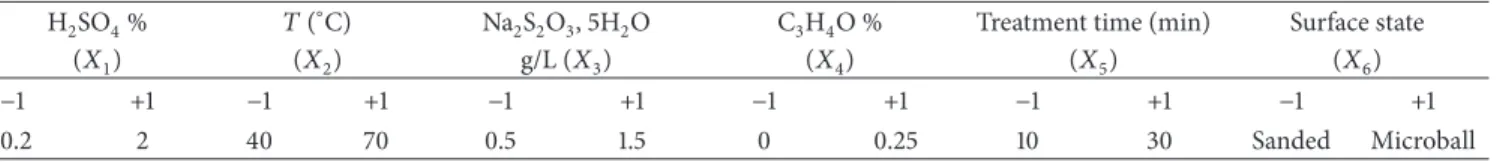
Table 2: Factors and their levels for the experiments.
H2SO4% 𝑇 (∘C) Na2S2O3, 5H2O C3H4O % Treatment time (min) Surface state (𝑋1) (𝑋2) g/L(𝑋3) (𝑋4) (𝑋5) (𝑋6)
−1 +1 −1 +1 −1 +1 −1 +1 −1 +1 −1 +1
0.2 2 40 70 0.5 1.5 0 0.25 10 30 Sanded Microball
Table 3: Fractional factorial design 26-1: theoretical values of coded
variables. No. 𝑋1 𝑋2 𝑋3 𝑋4 𝑋5 𝑋6 1 −1 −1 −1 −1 −1 1 2 1 −1 −1 −1 −1 −1 3 −1 1 −1 −1 −1 −1 4 1 1 −1 −1 −1 1 5 −1 −1 1 −1 −1 −1 6 1 −1 1 −1 −1 1 7 −1 1 1 −1 −1 1 8 1 1 1 −1 −1 −1 9 −1 −1 −1 1 −1 1 10 1 −1 −1 1 −1 −1 11 −1 1 −1 1 −1 −1 12 1 1 −1 1 −1 1 13 −1 −1 1 1 −1 −1 14 1 −1 1 1 −1 1 15 −1 1 1 1 −1 1 16 1 1 1 1 −1 −1 17 −1 −1 −1 −1 1 −1 18 1 −1 −1 −1 1 1 19 −1 1 −1 −1 1 1 20 1 1 −1 −1 1 −1 21 −1 −1 1 −1 1 1 22 1 −1 1 −1 1 −1 23 −1 1 1 −1 1 −1 24 1 1 1 −1 1 1 25 −1 −1 −1 1 1 −1 26 1 −1 −1 1 1 1 27 −1 1 −1 1 1 1 28 1 1 −1 1 1 −1 29 −1 −1 1 1 1 1 30 1 −1 1 1 1 −1 31 −1 1 1 1 1 −1 32 1 1 1 1 1 1
2.5. Measurement of Electrochemical Impedance. EIS
mea-surements were performed using EGG PAR apparatus model 16310. Impedance spectra were obtained in the frequency range of 10 KHz to 10 MHz. AC amplitude was 5 mV. Exper-iments were performed in aqueous aerated solution of 1 M Na2SO4at 25∘C.
Table 4: Doehlert design: theoretical values of coded variables and their levels for the experiments.
No. 𝑋1 𝑋2 Treatment time (s) 𝑇 (∘C)
1 1 0 300 55.00 2 −1 0 180 55.00 3 0.5 0.866 270 60.02 4 −0.5 −0.866 210 49.98 5 0.5 −0.866 270 49.98 6 −0.5 0.866 210 60.02 7 0 0 240 55.00
3. Results and Discussion
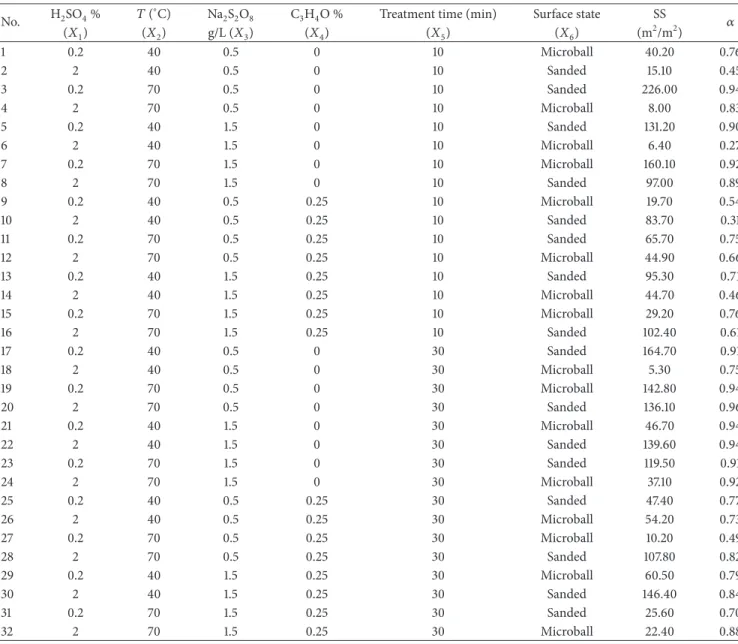
3.1. Determination of the Significant Factors (FFDs 26-1).
Experimental treatment conditions and the specific surface area and𝛼 of the as-prepared conversion coatings are shown in Table 5. Values of the 11 contrasts were computed with NEMRODw software and are given inTable 6. The study of these results indicates that the process can be explained by the strong effects corresponding to sulphuric acid, alcohol centrations, and to the effect of the interaction of alcohol con-centration with acid concon-centration and temperature.Figure 1
serves as an illustration for studying these interactions. The effect of alcohol depends on the level of temperature. The results show that the increase of propargyl alcohol concentration for a low temperature has no effect on the real surface. But, at high temperature, the best result corresponds to a low alcohol concentration (SS = 115 m2/m2).
The effect of alcohol depends on the level of acid. At low or high alcohol concentration, the responses are highly influenced by the variation of acid concentration and the best result corresponds to a low concentrations of sulfuric acid and propargyl alcohol (SS = 129 m2/m2). One other factor also has a significant main effect and does not display any interaction: surface state(𝑏6= −30.4). We can therefore state that the value of SS is higher if the surface is at level−1. In this case, sand surface is the surface that serves to obtain the highest SS.
A great real surface area of the conversion coating is achieved under the following experimental conditions.
Sulphuric acid concentration 0.2%. Thiosulphate concentration: 0.5 or 1.5 g/L. Alcohol concentration: 0%.
Temperature: 70∘C.
4 International Journal of Metals
Table 5: Fractional factorial design (26-1): variables, their levels, and data of the responses (SS and𝛼).
No. H2SO4% 𝑇 (∘C) Na2S2O8 C3H4O % Treatment time (min) Surface state SS 𝛼
(𝑋1) (𝑋2) g/L(𝑋3) (𝑋4) (𝑋5) (𝑋6) (m2/m2) 1 0.2 40 0.5 0 10 Microball 40.20 0.76 2 2 40 0.5 0 10 Sanded 15.10 0.45 3 0.2 70 0.5 0 10 Sanded 226.00 0.94 4 2 70 0.5 0 10 Microball 8.00 0.83 5 0.2 40 1.5 0 10 Sanded 131.20 0.90 6 2 40 1.5 0 10 Microball 6.40 0.27 7 0.2 70 1.5 0 10 Microball 160.10 0.92 8 2 70 1.5 0 10 Sanded 97.00 0.89 9 0.2 40 0.5 0.25 10 Microball 19.70 0.54 10 2 40 0.5 0.25 10 Sanded 83.70 0.31 11 0.2 70 0.5 0.25 10 Sanded 65.70 0.75 12 2 70 0.5 0.25 10 Microball 44.90 0.66 13 0.2 40 1.5 0.25 10 Sanded 95.30 0.71 14 2 40 1.5 0.25 10 Microball 44.70 0.46 15 0.2 70 1.5 0.25 10 Microball 29.20 0.76 16 2 70 1.5 0.25 10 Sanded 102.40 0.61 17 0.2 40 0.5 0 30 Sanded 164.70 0.91 18 2 40 0.5 0 30 Microball 5.30 0.75 19 0.2 70 0.5 0 30 Microball 142.80 0.94 20 2 70 0.5 0 30 Sanded 136.10 0.96 21 0.2 40 1.5 0 30 Microball 46.70 0.94 22 2 40 1.5 0 30 Sanded 139.60 0.94 23 0.2 70 1.5 0 30 Sanded 119.50 0.91 24 2 70 1.5 0 30 Microball 37.10 0.92 25 0.2 40 0.5 0.25 30 Sanded 47.40 0.77 26 2 40 0.5 0.25 30 Microball 54.20 0.73 27 0.2 70 0.5 0.25 30 Microball 10.20 0.49 28 2 70 0.5 0.25 30 Sanded 107.80 0.82 29 0.2 40 1.5 0.25 30 Microball 60.50 0.79 30 2 40 1.5 0.25 30 Sanded 146.40 0.84 31 0.2 70 1.5 0.25 30 Sanded 25.60 0.70 32 2 70 1.5 0.25 30 Microball 22.40 0.88 Acid concentration Alcohol concentration SS = 44.20 SS = 75.81 SS = 55.58 SS = 128.90 +1 +1 −1 −1 (a) Alcohol concentration Temperature SS = 68.99 SS = 51.02 SS = 68.65 +1 +1 −1 −1 SS = 115.82 (b)
Figure 1: Illustration of interactions𝑏14 and 𝑏24 between (a) sulphuric acid concentration (𝑋1)—alcohol concentration (𝑋4) and (b) temperature(𝑋2)—alcohol concentration (𝑋4).
International Journal of Metals 5 Acid concentration Treatment time −1 −1 +1 +1 𝛼 = 0.81 𝛼 = 0.85 𝛼 = 0.78 𝛼 = 0.56 (a) Temperature +1 Treatment time −1 −1 +1 𝛼 = 0.83 𝛼 = 0.83 𝛼 = 0.55 𝛼 = 0.79 (b)
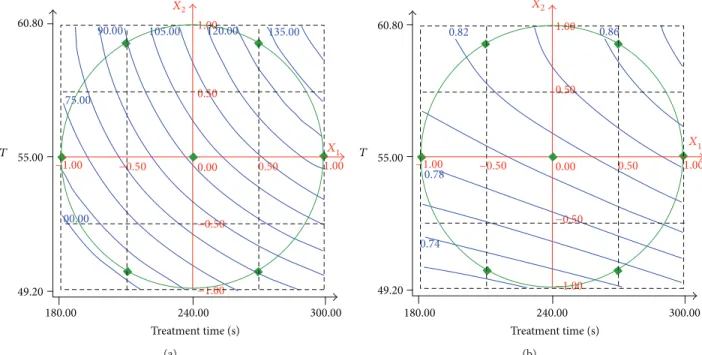
Figure 2: Illustration of interactions𝑏15and𝑏25between (a) sulphuric acid concentration(𝑋1)—treatment time (𝑋5) and (b) temperature (𝑋2)—treatment time (𝑋4). 75.00 00.00 1.00 49.20 55.00 60.80 T X1 X2 300.00 240.00 180.00 0.00 0.50 0.50 1.00 −0.50 −1.00 −1.00 Treatment time (s) 90.00 105.00 120.00 135.00 −0.50 (a) 0.74 0.78 0.82 0.86 49.20 55.00 60.80 T 300.00 240.00 180.00 1.00 0.50 0.00 0.50 1.00 X1 X2 −0.50 −0.50 −1.00 −1.00 Treatment time (s) (b)
Figure 3: Response surface of the real surface area (a) and𝛼 (b) versus 𝑋1(treatment time) and𝑋2(temperature).
For𝛼 response, the significant one here is also alcohol concentration that must be at level (−1). Two interactions (𝑏15and𝑏25), corresponding to the interaction acid-treatment
time and temperature-treatment time, respectively, have a significant effect and can be illustrated as in Figure 2. It emerges from these two interactions that the acid concentra-tion, treatment time, and temperature must be at level (−1).
We therefore decided to work in the following conditions: Acid concentration: 0.2% (−1).
Thiosulphate concentration: 0.5 g/L (−1). Alcohol concentration: 0 (−1).
Surface sanded surface: (−1).
And in these conditions, we focused essentially on the effect of the treatment time and temperature using a Doehlert uniform shell design for two parameters, and in which a second order response surface is fitted to the experimental
result by least squares multiple regressions by NEMROD software.
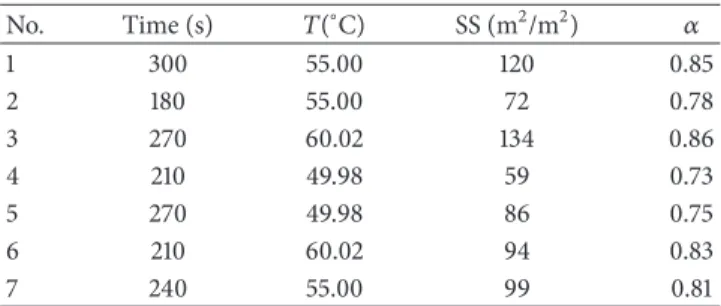
3.2. Doehlert Shell Design and Simplex Matrix. The results
obtained according to Doehlert’s matrix are given inTable 7. The experimental domain was determined from their best levels.
Processing of the data led to the estimation of six coefficients for the polynomial equation for each response as follows:
SS= 99 + 27.2𝑋1+ 24𝑋2− 3𝑋21− 2.7𝑋22+ 7.5𝑋1𝑋2, 𝛼 = 0.81 + 0.03𝑋1+ 0.06𝑋2+ 0.005𝑋21
− 0.03𝑋22+ 0.006𝑋1𝑋2
(𝑋1: treatment time, 𝑋2: temperature) .
6 International Journal of Metals
Table 6: Main and interactions effects calculated from factorial fractional design 26-1.
𝑏𝑖 Estimates (for responses SS) Estimates (for responses𝛼)
𝑏0 76.1 0.75 𝑏1 −10.4 −0.04 𝑏2 7.3 0.06 𝑏3 2.9 0.03 𝑏4 −16.1 −0.08 𝑏5 3.0 0.08 𝑏6 −30.4 0.02 𝑏14 26.2 0.03 𝑏24 −16.3 −0.03 𝑏15 12.4 0.07 𝑏25 −11.3 −0.06
The bold font refers to the most important values according to their levels as it is explain in the text.
Table 7: Doehlert design: results for each experiment.
No. Time (s) 𝑇(∘C) SS (m2/m2) 𝛼 1 300 55.00 120 0.85 2 180 55.00 72 0.78 3 270 60.02 134 0.86 4 210 49.98 59 0.73 5 270 49.98 86 0.75 6 210 60.02 94 0.83 7 240 55.00 99 0.81
Figure 3 represents the variation of responses SS (Figure 3(a)) and𝛼 (Figure 3(b)) according to temperature and treatment time. The high effects of treatment time and temperature appear clearly and the coefficient values corresponding to these factors are very important. The results show that the increase of treatment time and temperature increases the real surface area and 𝛼 as can be seen in
Figure 3. To find the optimum via an alternative, the simplex sequential optimisation method was used. Experiment 8 was carried out at a point symmetrical to experiment 7 with respect to the midpoint between points 1 and 3 (Figure 4). Here, the response is high (SS = 327 m2⋅ m−2,𝛼 = 0.91), which shows that the increase of a treatment time and temperature allows the formation of conversion coating with high surface area.
3.3. Determination of Fractal Dimension of the Coating by Impedance Measurements. The electrochemical impedance
diagrams of the conversion coating (Figure 5) show a capac-itive arc characteristic of the charge transfer process at the electrode-solution interface. At very high frequencies, a process of diffusion in the pores is observed.
It has been shown that the transfer semicircle, which is centered for a flat smooth interface, becomes rotated around its high frequency when the surface is porous and/or rough. This difference from a smooth interface is due to the distribution of the system response time constant. The
4 7 2 1 5 3 8 6 (X2) (X1)
Figure 4: Illustration of simplex defined on𝑋1(treatment time)— 𝑋2(temperature). 50 100 150 200 0 0 20 40 60 80 100 1 MHz 10 MHz 𝜃 Re(Ω·cm2) Im (Ω· cm 2)
Figure 5: EIS Nyquist plot in aerated 1 M Na2SO4aqueous solution of the austenitic stainless steel with conversion coating.
angle of rotation of capacitive loop around its high frequency is noted 𝜃 (Figure 5). In order to interpret any correlation that might exist between the particular texture of certain interfaces and the angle of rotation 𝜃, a nondimensional parameter 𝑑𝑓, representing the difference from an ideal surface (perfectly smooth and homogeneous), is often intro-duced. Several tentative relationships have been proposed to determine𝑑𝑓from the angle𝜃 [16–21]. In this work, we used the relationship proposed by Le Mehaut´e and Crepy [16]:
𝑑𝑓= 180 − 2𝜃180 + 1. (4)
For our optimal conversion coating, the obtained value of 𝑑𝑓is about 2.15 (𝜃 = 12.2∘).
The double layer capacitance𝐶dlrelevant to the EIS
dia-gram inFigure 5is 11775.3𝜇F ⋅ cm−2, a high value attributed to the presence of a porous layer on the surface, while a double layer capacitance for a smooth surface is considered to be about 50𝜇F ⋅ cm−2. The real surface area was estimated to be 235 m2/m2.
The calculated value of SS is in good agreement with what has been determined by cyclic voltammetry method.
International Journal of Metals 7
1𝜇m
Figure 6: Micrograph of conversion coating obtained in an opti-mum bath.
Examination of the optimal coating by scanning electron microscopy showed that the surface is rough and porous (Figure 6).
4. Conclusion
The aim of this study is the optimisation of conversion coating on iron-chromium-nickel alloy. This conversion coating must have a high specific area. The present work has demonstrated that the experimental domain that we defined appears suitable for the optimisation of conversion coating. The fractional factorial design, Doehlert design, and simplex design allow a rapid overall study of conversion coating growth in sulphuric acid medium, under relatively strong experimental constraints. The primary conclusion of this study is that interactions between bath compounds and surface state have an important influence on the formation of conversion coatings. The experimental designs used for these experiments led to the optimum conditions being obtained. The real surface area of optimal conversion coating is very high (235 m2/m2). The fractal dimension was determined by impedance measurement. The measurements of specific area by impedance and cyclic voltammetry present a good agreement and indicate high porosity.
References
[1] P. ´Alvarez, A. Collazo, A. Covelo, X. R. N´ovoa, and C. P´erez, “The electrochemical behaviour of sol-gel hybrid coatings applied on AA2024-T3 alloy: effect of the metallic surface treatment,” Progress in Organic Coatings, vol. 69, no. 2, pp. 175– 183, 2010.
[2] Y. Song, D. Shan, R. Chen, F. Zhang, and E. Han, “A novel phosphate conversion film on Mg-8.8Li alloy,” Surface and
Coatings Technology, vol. 203, no. 9, pp. 1107–1113, 2009.
[3] A. A. Zuleta, E. Correa, C. Villada, M. Sep´ulveda, J. G. Casta˜no, and F. Echeverr´ıa, “Comparative study of different environmentally friendly (Chromium-free) methods for sur-face modification of pure magnesium,” Sursur-face and Coatings
Technology, vol. 205, no. 23-24, pp. 5254–5259, 2011.
[4] L. Bamoulid, M. T. Maurette, D. De Caro et al., “Investigations on composition and morphology of electrochemical conversion layer/titanium dioxide deposit on stainless steel,” Surface and
Coatings Technology, vol. 201, no. 6, pp. 2791–2795, 2006.
[5] L. Bamoulid, M.-T. Maurette, D. De Caro et al., “An efficient protection of stainless steel against corrosion: combination of a conversion layer and titanium dioxide deposit,” Surface and
Coatings Technology, vol. 202, no. 20, pp. 5020–5026, 2008.
[6] S. El Hajjaji, M. El Alaoui, P. Simon et al., “Preparation and characterization of electrolytic alumina deposit on austenitic stainless steel,” Science and Technology of Advanced Materials, vol. 6, no. 5, pp. 519–524, 2005.
[7] A. Lgamri, A. Guenbour, A. Ben Bachir, S. El Hajjaji, and L. Aries, “Characterisation of electrolytically deposited alumina and yttrium modified alumina coatings on steel,” Surface and
Coatings Technology, vol. 162, no. 2-3, pp. 154–160, 2003.
[8] A. Komla, L. Aries, B. Naboulsi, and J. P. Traverse, “Texture of selective surfaces for photothermal conversion,” Solar Energy
Materials, vol. 22, no. 4, pp. 281–292, 1991.
[9] S. El Hajjaji, A. Lgamri, E. Puech-Costes, A. Guenbour, A. Ben Bachir, and L. Aries, “Optimization of conversion coatings: study of the influence of parameters with experimental designs,”
Applied Surface Science, vol. 165, no. 2, pp. 184–192, 2000.
[10] S. El Hajjaji, A. Guenbour, A. Ben Bachir, and L. Aries, “Effect of treatment baths nature on the characteristics of conversion coatings modified by electrolytic alumina deposits,” Corrosion
Science, vol. 42, no. 6, pp. 941–956, 2000.
[11] G. E. P. Box, W. G. Hunter, and J. S. Hunter, Statistics for
Experimenters: An Introduction to Design, Data Analysis and Model Building, Wiley, New York, NY, USA, 1978.
[12] D. Mathieu and R. Phan-Tan-Luu, NEMROD Software, LPRAI, Marseille, France, 1995.
[13] D. H. Doehler, “Uniform shell designs,” Journal of the Royal
Statistical Society C, vol. 19, pp. 231–239, 1970.
[14] D. H. Doehlert and V. L. Klee, “Experimental designs through level reduction of the d-dimensional cuboctahedron,” Discrete
Mathematics, vol. 2, no. 4, pp. 309–334, 1972.
[15] W. Splendley, G. R. Hext, and F. R. Himsworth, “Sequential application of simplex design of optimization and evolutionary operations,” Technometrics, vol. 4, pp. 441–461, 1962.
[16] A. Le Mehaut´e and G. Crepy, “Introduction to transfer and motion in fractal media: the geometry of kinetics,” Solid State
Ionics, vol. 9-10, pp. 17–30, 1983.
[17] M. Keddam and H. Takenouti, “Impedance of fractal interfaces : new data on the Von Koch model,” Electrochimica Acta, vol. 33, pp. 445–448, 1986.
[18] A. J. Bard and L. R. Faulkner, Electrochimie, Masson, Paris, France, 1983.
[19] L. Nyikos and T. Pajkossy, “Fractal dimension and frac-tional power frequency-dependent impedance of blocking elec-trodes,” Electrochimica Acta, vol. 30, pp. 1533–1540, 1985. [20] T. Pajkossy and L. Nyikos, “Impedance of fractal blocking
electrodes,” Journal of Electrochemical Society, vol. 133, no. 10, pp. 2061–2064, 1986.
[21] S. H. Liu, “Fractal model for the ac response of a rough interface,” Physical Review Letters, vol. 55, no. 5, pp. 529–532, 1985.