Publisher’s version / Version de l'éditeur:
Building and Environment, 38, December 12, pp. 1367-1379, 2003-12-01
READ THESE TERMS AND CONDITIONS CAREFULLY BEFORE USING THIS WEBSITE. https://nrc-publications.canada.ca/eng/copyright
Vous avez des questions? Nous pouvons vous aider. Pour communiquer directement avec un auteur, consultez la
première page de la revue dans laquelle son article a été publié afin de trouver ses coordonnées. Si vous n’arrivez pas à les repérer, communiquez avec nous à [email protected].
Questions? Contact the NRC Publications Archive team at
[email protected]. If you wish to email the authors directly, please see the first page of the publication for their contact information.
Archives des publications du CNRC
This publication could be one of several versions: author’s original, accepted manuscript or the publisher’s version. / La version de cette publication peut être l’une des suivantes : la version prépublication de l’auteur, la version acceptée du manuscrit ou la version de l’éditeur.
For the publisher’s version, please access the DOI link below./ Pour consulter la version de l’éditeur, utilisez le lien DOI ci-dessous.
https://doi.org/10.1016/S0360-1323(03)00139-2
Access and use of this website and the material on it are subject to the Terms and Conditions set forth at
Selecting moisture reference years using a moisture index approach
Cornick, S. M.; Djebbar, R.; Dalgliesh, W. A.
https://publications-cnrc.canada.ca/fra/droits
L’accès à ce site Web et l’utilisation de son contenu sont assujettis aux conditions présentées dans le site LISEZ CES CONDITIONS ATTENTIVEMENT AVANT D’UTILISER CE SITE WEB.
NRC Publications Record / Notice d'Archives des publications de CNRC:
https://nrc-publications.canada.ca/eng/view/object/?id=7ca040e7-67c6-4b67-88fe-4ee1415ba922 https://publications-cnrc.canada.ca/fra/voir/objet/?id=7ca040e7-67c6-4b67-88fe-4ee1415ba922
Selecting moisture reference years using a moisture index
approach
Cornick, S.; Djebbar, R.; Dalgliesh, W.A.
doi:10.1016/S0360-1323(03)00139-2
NRCC-45674
A version of this document is published in / Une version de ce document se trouve dans :
Building and Environment, v. 38, no. 12, Dec. 2003, pp. 1367-1379.
Selecting Moisture Reference Years Using a Moisture Index Approach
Steve Cornick*, Reda Djebbar
National Research Council of Canada, Institute for Research in Construction Building M-24, Montreal Road Campus, 1200 Montreal Rd.
Ottawa, Ontario, Canada. K1A 0R6 Facsimile: +1 613 998 6802 Email: [email protected]
And
W. Alan Dalgliesh
Formerly of National Research Council of Canada, Institute for Research in Construction
237 Valley Ridge Green N. W. Calgary AB, Canada
T3B 5L6
*
Abstract
Recent history has documented the premature failures of building envelopes in various regions –in North America most notably on the West Coast and the East Coast. The MEWS Consortium, a project undertaken by IRC and its partners, has addressed this issue in detail. The strategy for answering these questions was based on predicting the moisture management performance of wall systems as a function of climate, wall construction, and material properties through mathematical modeling. A key task was to determine what years to use as input for the simulations. Moisture Reference Years were selected using a Moisture Index approach developed for MEWS. This paper will develop the approach and compare it with other methods of selecting Moisture Reference Years for hygrothermal simulations.
Keywords:
Moisture Reference Years, Boundary Conditions, Building Envelope, Climate, Hygrothermal ModelingIntroduction
The objective of MEWS1 (Moisture Management of Exterior Wall Systems) was to develop guidelines for moisture management strategies for wall systems to meet user requirements of long-term performance and durability for the wide range of climate zones across North America [1][2]. The focus was
1
MEWS is joint research project between IRC- NRC Canada and the following external partners:
Louisiana Pacific Corporation, Marriott International Inc., Fortifiber Corporation, EIFS Industry Members Association, EI DuPont de Nemours & Co., Canadian Wood Council, Fiberboard Manufacturers Assn., Canada, Masonry Canada, Canadian Plastic Industry Association, Canada Mortgage and Housing Corp. and Forintek Canada Corporation.
on wood-frame buildings of 4 storeys or less, exposed to a range of outdoor climates found in North America (heating, cooling and mixed). Effective moisture control implies both minimizing moisture entry into the system, and maximizing the exit of moisture which does enter, so that no component in the system stays "too wet" for "too long". But what is "too wet" and "too long"? One of the goals of the MEWS project was to attempt to answer questions such as these. The strategy for answering these questions is based on predicting the moisture management performance of wall systems as a function of climate, wall
construction, and material properties through mathematical modeling. In summary a large parametric study was undertaken using a state-of-the-art 2 dimensional transient heat, air and moisture transport model [3].
The parametric study had four main types of parameters: 1) climate, 2) wall constructions, 3) construction materials, and 4) amount of accidental water entered into the stud cavity. For climate, five cities
representing distinct climates were selected [4]. Four different wall systems were considered: 1) stucco, 2) exterior insulated finish systems (EIFS), 3) siding, and 4) masonry (brick). The third type of parameter considered was the construction material type. The last parameter in the study was accidental water entry. A detailed set of experiments was undertaken for each wall system considered to characterize the amount of accidental water entry. Water entry was permitted through a series of typical deficiencies in walls obtained through a literature survey. Readers interested in further details are welcome to read the collection of Internal Reports from IRC. A list of selected reports is given following the references.
An important component of the parametric study was the selection of the appropriate weather data. Five North American locations were chosen for the study. Thirty or more years of hourly weather data were available for each of the locations. For each wall system over 100 2-dimensional hygrothermal simulations were done. It was not practical to consider the entire 30-year span of weather data. It was decided to use a 3-year simulation period to evaluate the moisture performance of the modelled wall systems. The selected years imply the levels of thermal and moisture exterior loads against which the long-term hygrothermal performance and durability of the walls were assessed. What were the appropriate Moisture Reference Years to use in the parametric study?
Work on defining a Moisture Reference Year (MRY) or a Moisture Design Year for hygrothermal analysis is ongoing. The International Energy Agency (IEA) Annex 24 on heat, air and moisture transport, Task 2
Environmental Conditions has made recommendations on how to determine a moisture design year [5].
Some of the methods require the use of specific building and wall characteristics. The approach taken in the MEWS project was that the climate data would be analyzed independently of the wall response;
consequently many of the IEA recommendations did not serve the purposes of this project. A universal method for selected a moisture reference year is not currently available. Many researchers are contributing in this area including Geving [6], Künzel [7], and Hagentoft [8], and Djebbar [9]. An ASHRAE Standard Committee, SPC 160P, is currently developing a standard titled “Design criteria for moisture control in buildings”. This standard is expected to include recommendations for moisture design reference year.
The problem still remained as to what to select as input for hygrothermal modeling. One approach was to use the entire available hourly weather record, 30 to 40 years for example, as input. This approach is currently not practical, especially for large studies or complicated modeling. Another approach is to define a reference year similar to the energy reference years that have been developed for energy calculations. Energy reference years are statistically based in that the values for each hour are synthesized from statistical analysis. Examples of "statistical" years include typical reference year (TRY), typical
meteorological year (TMY), and weather years for energy calculations (WYEC2 and CWEC). Again, this is ongoing work, currently being addressed for example by ASHRAE Technical Committee 4.2 [10].
Why the concern regarding selecting Moisture Reference Years for modeling purposes? Increasing the results of modeling are being incorporated into codes and national standards. The Discussion section provides a few examples of the application of modeling to codes and standards.
Although there is a rich literature related to the selection of Moisture Reference Years there is no universal method arrived at by consensus for identifying or selecting the worst MRY. Analysis of literature suggests the following criteria, for which there seems to be general agreement, for selecting MRYs [9]:
1. MRYs should reflect climate variability of locality; i.e. true frequencies, true sequences and true correlation.
2. MRYs should be a summary of the external climate for the geographic location under consideration.
3. For durability and hygrothermal consideration MRYs should span a least one-year. 4. MRYs should be able to account for severe moisture stress on the building envelope 5. MRYs should be location specific and not construction specific
6. Worst or 10%-level (return period of 10 year) year were both suggested for selecting the critical moisture year; i.e. to produce the most severe hygrothermal stress [5].
There are mainly two climate-based moisture sources in building envelopes, moisture originating from interstitial condensation and moisture that leaks in from exterior wetting, (i.e. from wind-driven rain). Most of the methods to select the moisture reference years found in the literature are based on characterizing one of the two types of moisture sources. Despite item 5 above, two types of approaches have been tried:
1. Construction-dependent methods, that require some form of hygrothermal simulation and consequently some knowledge of the characteristics of the wall and
2. Construction-independent methods that require only weather data analysis.
The essence of construction-dependent methods is calculation of the hygrothermal response of a wall or walls subjected to different weather years. The MRYs are selected based on the response. Examples of construction-dependent can be found in Sanders [5], Geving [6], and Rode [11]. The principles used in the construction can be summarized in five steps:
1. Define a set of typical wall constructions 2. Select typical interior boundary conditions 3. Prescribe the critical construction orientation
4. Perform hygrothermal simulations for all the years of hourly weather available
5. Investigate the existence of a common worst year for all constructions, if none exists proceed by ranking the comparisons of the years simulated and select the common worst year as the MRY for the considered location.
Djebbar [12] gives a more complete treatment of the individual methods for selecting Moisture Reference Years, both construction-dependent and construction-independent. A tool for selecting weather years for hygrothermal modeling is also described.
Examples of construction-independent methods were first suggested during the activities of the IEA Annex 24. Authors like Ali Mohamed and Hens [13], and Sanders [14] suggested that the critical moisture year could be correlated with the annual or monthly mean outdoor temperature. A variant of these methods suggests that MRY should be the year with the outdoor temperature at the lower 10-percentile, i.e., such that only 10% of the years in the climatological record are that cold or colder. Recently, 10% years were used by Karagiozis [15] for long-term HAM simulations. The same approach has been proposed for ASHRAE SPC 160P and ASTM Committee E06 on Performance of Buildings [16]. On other hand, authors like Geving [6] suggested that the critical moisture year could be correlated with the annual or monthly mean outdoor relative humidity. The Π-factor method is another approach suggested during IEA Annex 24 activities by Hagentoft and Harderup [17]. The Π-factor method identifies the MRY as the least forgiving year in terms of drying-out potential of wetted walls for a given location. Another suggestion for the critical year targets the exterior wetting due to wind-driven rain.
The subject of this paper is to present a construction-independent method based on a Moisture Index approach developed for the MEWS project. A complete description of the MEWS approach to selecting Moisture Reference Years is given by Cornick [4]. Recall that the MEWS project required that the climate
study be undertaken independent of wall construction. This approach was taken to satisfy the objectives of the project.
The Moisture Index approach
A Moisture Index approach was used in the MEWS project to define Moisture Reference Years. Bailey [18] provides a succinct definition of a moisture index as it applies to climate.
"A moisture index is a device which allows better comparison of natural landscapes than can be gained from the distribution of simple rainfall amounts. Such an index is then a more refined expression of the moisture factor in climate than straight rainfall, an advantage claimed for the simple indices proposed by De Martonne and others, and clearly demonstrated by Köppen in the various editions of his classification of climate."
The Moisture Index
This section briefly outlines the Moisture Index approach. Cornick [19] describes in detail the Moisture Index approach that was used in MEWS project. A moisture index can be considered to be a moisture budget. The index comprises wetting function and drying function. The wetting function describes the availability of water or the source part of the water budget. Rainfall is an example of a wetting function. The drying function describes the sink part of the water budget. The drying function could include terms that describe evaporation, soil retention, and run-off for example. In the most general form a moisture index can be written as:
MI = function (Wetting Index, Drying Index) = function (WI, DI) (1)
Where:
WI is the Wetting Function DI is the Drying Function
For each city considered in the MEWS parametric study there are 30 to 40 years of weather data, usually containing readings of meteorological elements (e.g. temperature, rainfall, wind velocity). Since the task was to select Moisture Reference Years (MRY) from the set of years for a city the Wetting and Drying Indices were normalized for each city. The normalization scheme is given in Equation 2.
Inormalized = (I - Imin)/(Imax - Imin) (2)
Where:
I is the Index of interest.
The MI is defined in Equation 3. Figure 1 shows the MI calculated for each of the 41 years of hourly data for Vancouver, British Columbia. As values of the WI increase along the x-axis the amount of wetting increases. As the values of DI increase along the y-axis the amount drying decreases. The hypothesis is that the higher the MI the more severe the year in terms of moisture loading in the wall.
2 normalized 2 normalized (1 DI ) WI MI= + − (3)
The wetting function, WI, is chosen to be the annual rainfall for the year in question. The function for drying is a little more complex. For a review of this see the MEWS Task 4 Final [4]. A simple function of drying that relates to evaporation is the difference between the humidity ratio at saturation and the humidity
ratio present in the ambient air. This is a measure of the "headroom in the air", available to take up water vapour. It is calculated from the dry bulb temperature and relative humidity. This is shown in Equation 4.
∆w is calculated for each hour of the year. The Drying Index is calculated as the sum of the hourly values (Equation 6).
∆w = wsat * (1 - µ) kg water/kg air (4)
Where: wsat = humidity ratio at saturation µ = degree of saturation µ = wambient/ wsat (5) DI =
∑
∆w kg water/kg air-year (6) = k 1 h Where:k is the number of hours in a particular year, i.e. either 8760 or 8784 hours.
The MI values for 41 years of Vancouver weather are shown in Figure 1.
Classifying the Years
The MEWS approach taken to selecting weather for hygrothermal modeling was to construct input files spanning three years using actual weather data. Using the Moisture Index it is possible classify individual
years as wet, dry, or average. From the weather record for a particular city the moisture index for each year was calculated, the hypothesis being that the higher the moisture index the greater the potential for moisture loading. Wet and dry years were defined as those years that deviate more than one standard deviation from the mean MI value of the sample set for a city. Average years were defined as being within one standard deviation of the mean. For MEWS the wet year for a city was defined as the year with highest moisture index, the dry year as the year with lowest moisture index, and the average year as the year closest to the mean Moisture Index. Figure 2 shows the three years selected as wet, dry and average for Wilmington, North Carolina. The chart shows the deviation of the drying and wetting indices from the mean in terms of standard deviations, σ.
This was the basic MEWS approach to selecting the moisture reference years to be used hygrothermal modeling. Years can be classified as wet, dry, or average. The required three-year span was then synthesized by concatenating three individual years together to form the desired three-year span. The method provides for flexibility in creating patterns for the three year span. One possible pattern for the three year span would have the first two years classified as wet with the following year being classified as
average. The approach allows for the synthesis of many sequences of Moisture Reference Years.
Orientation and Predominate Direction
Up to this point the definitions of the drying index and wetting index have been defined without considering building orientation. This was in keeping with the initial assumption that climate would be treated independently of the wall or building. Recall that the wetting index was defined as the annual rainfall on the horizontal. The scope of the MEWS parametric study phase was limited to analyzing one wall orientation. This required a redefinition of the wetting index, WI. Why?
Figure 3 a) shows 4 years selected from the Wilmington, NC weather record. The directional driving rain indices (dDRI) for two wet years, an average year, and a dry year are shown. The years were selected using the Moisture Index approach. Recall that WI was equal to the annual rainfall on the horizontal. Suppose
that the orientation of a given wall is south. A hygrothermal model will impose a rain load on the wall in proportion to the wind speed, wind direction, and rain intensity. A south-facing wall will see more rain during the average year than during both wet years. If one were to compare the wall response to the wet year 1966 with the dry year, 1968 a north or northeast orientation would be preferable. Clearly, the wetting index must take direction into account if only one wall orientation is to be considered. Since the Drying Index involves only temperature and atmospheric moisture the evaporation function was considered to be adequate and no changes were made to the DI2.
The first step in introducing a directional component was to determine the predominant direction of rainfall as it relates to wind speed and direction. The rain load on the wall was calculated for the four cardinal orientations for each city. Six methods for calculating the rain load impinging on a vertical wall were compared. They were Lacy's method [20], the UK Method [21], Künzel's adaptation of Lacy's approach [22], Straube's Method [23] and the LIF-CFD Method [24], and finally a directional Driving Rain Index approach. All the methods were in general agreement. Differences can be attributed to differences in the building aerodynamic factors assumed in the calculations. The method used to calculate the rain load in the MEWS project was recommended by Straube [23]. The hypothetical rain loading calculated using various methods, for Wilmington, NC, are given in Table 1. Four wall orientations were considered. The rain impinging on the wall was calculated for all the years available.
2
The decision to conduct the climate analysis independent of the wall characteristics was made at the outset of the MEWS project. Consequently solar radiation was not considered in the definition of the Drying Index.
The direction with highest amount of total rain impinging on the wall was selected as the predominant direction for rainfall. In cases where there was little difference between the total amounts, such as Wilmington, NC, the predominant direction was selected, conservatively, to be the one least conducive to drying. For Wilmington, NC the direction selected was north; the orientation with the least direct solar radiation.
The reference years for the selected cities were calculated using the Moisture Index approach outlined previously. The major difference was the redefinition of the wetting index, WI. Recall that the original definition for the Wetting Index, WI, was the total rainfall for the year. To include the effect of orientation the redefined wetting index was based on Straube's method [23] and is given in Equations 7 through 12. The years selected as wet, dry, and average for the Wilmington, NC are shown in Figure 3 b). Note that the selection of the Moisture Reference Year was now biased towards wetting in the direction of predominate rainfall.
WI = RAF * DRF(rh) * cos (θ) * V(h) * rh (7)
Where: WI is the wetting index
RAF is the rain admittance factor (RAF = 0.9 for the results presented here) rh is the horizontal rainfall intensity mm/m2-h
V(h) is the wind speed at the height of interest m/sec
θ is the angle of the wind direction to the wall normal
DRF(rh) = 1/Vt (8)
Where: DRF is the driving-rain factor
The terminal velocity can be calculated from the equation given by Dingle and Lee [25]:
Vt(Φ) = -0.16603 + 4.91884 * Φ - 0.888016 * Φ2 + 0.054888 * Φ3 <= 9.20 (9)
Where: Vt(Φ) is the terminal velocity of a raindrop of diameter Φ in still air (m/sec)
The distribution of raindrop sizes for a given horizontal rain intensity is given by Best [26].
F(Φ) = 1 - exp{-(Φ/(1.30 * rh0.232))2.25} (10)
Where: F(Φ) is the cumulative probability distribution of raindrop sizes for rh (mm) Φ is the equivalent spherical raindrop diameter (mm)
D50 is the value of the drop diameter x such that 50 percent of the water in the atmosphere is comprised of
drops with a diameter less than D50. The predominant drop diameter, Dpred, is the diameter of drops that
accounts for the greatest volume of water in the air.
D50 = a * 0.691/n (11)
Dpred = a * ((n - 1)/n)1/n (12)
Where: a = 1.30 rhp, p = 0.232
n = 2.25
The predominate drop diameter was used for the results presented in this paper as well as the for MEWS project.
An Example
In this section an example of selecting the Moisture Reference Years for Vancouver, British Columbia is presented. The example will be used to compare the selection of MRYs to those selected using other methods in the next section. Vancouver's climate is classified as Temperate Oceanic with a cool summer. Mean annual rainfall is just over 1100 mm while the mean temperature is 9.9 °C. The annual temperature range is 7.5°C. Rainfall occurs mainly in the winter months (low sun period), about 71% of the total, with the summer being drier. Vancouver's coastal climate is mild and the annual temperature range is smaller than those for continental climates. Most of the rain comes from an easterly direction. Some of the long-term climatic means are given in Table 2. For Vancouver, 41 years of hourly climate data was available, from 1953 to 1993. The reporting station is located at the International Airport. The data set was fully populated.
The normalized values of WI and DI for each of the 41 years are shown in Figure 1. The MRYs selected are shown in the figure. The years selected were: the wet year was 1980, the average year was 1969, and the dry year was 1985. Table 2 lists the particulars of the Moisture Reference Years selected and compares them with the long-term climatic means. The wet year was slightly colder and more humid than the mean and features more wind-driven from the easterly direction, the predominate direction. The average year has less wind-driven rain while the dry year has considerably less rain being driven onto east facing facades. Figure 4 shows the directional Driving-Rain rosettes for the years that were selected as wet, dry and
average. The Moisture Index values for all 41 years in the Vancouver weather record are given in Table 3
in order of descending MI. The reference years are highlighted. Figure 5 shows the reference years selected for Vancouver, BC as well as other years in the weather record. The plot shows the deviation from the mean values of the Wetting and Drying Indices for each year in terms of standard deviations. The figure shows how wetting and drying affect reference year selection. The wettest year, for example, is not necessarily the year with the most wind-driven rain but rather a year with above average rainfall and below average drying potential.
Comparisons
In this section, seven different methods for selecting Moisture References Years will be compared for Vancouver. Weathersmart, a tool that generates input data for a Heat, Air, and Moisture (HAM) model was used for 6 of the methods. Details describing the Weathersmart tool are provided in Djebbar [9]. The seventh method was the Moisture Index approach outlined in this paper.
Methods Compared for Calculating Moisture Reference Years
Weathersmart uses two different approaches to picking MRYs, one construction independent and the other construction dependent.
The construction independent methods are:
1. 10% Hot and Cold Years — The years that are closest to 1.28 standard deviations away from the mean average temp are selected as the hot and cold year. The hypothesis is that the cold year would be most prone to condensation whereas the hot year would be less prone to condensation. Hot year = nearest year to Mean + 1.28 σ. Cold year = nearest year to Mean - 1.28 σ. Average year = nearest year to Mean
2. Drying Potential — The Drying Potential is calculated as the Π factor for the year [17] modified to be independent of the wall characteristics. The year with the lowest value of the Π factor is selected wettest year with respect to Moisture Reference Years. The year with the highest Drying Potential is selected as the drying year. An average year would be nearest the mean value of the Drying Potential for the data set.
3. Rain and Wind Driven Rain. — Weather years can be characterized by either total annual rainfall on the horizontal or wind-driven on a vertical façade for a specific orientation. Using annual rainfall years are ranking in descending order of yearly rainfall. The year with the greatest amount of rainfall is selected as the wet year. Similarly years can be selected on the basis of free wind-driven rain
impinging on a vertical surface. The calculation is based on the approach described by Lacy [20]. For Vancouver the wind-driven calculation assumed an easterly orientation (the angle of the wall normal was 90 degrees from north), the direction of predominant wind during rain.
4. A Combined Method — Similar to the Moisture Index the combined method combines the Drying Potential (DP) and Wetting by dividing the Wind-Driven Rain (WDR) on a vertical surface calculated using Lacy's method [20] by the Π factor [17]. The larger the value of WDR/DP the wetter the year. The year with highest value is selected as the wet year.
The construction dependent approach in Weathersmart uses a one-dimensional HAM model to calculate the moisture content of several idealized wall cross sections [9]. Five predefined wall sections are included in Weathersmart. The wall sections are: 1) Wall 1 (Brick Veneer - Steel-Stud Wall, 2) Wall 2 (Brick Veneer - Concrete Bearing Masonry Wall), 3) Wall 3 (Pre-cast Concrete Wall), 4) Wall 4 (Thin Stone Veneer with Backing Wall), 5) Wall 5 (Load Bearing Masonry Wall). Moisture Reference Years can be selected as either a) the year which gives the maximum total daily moisture content in the wall or b) the year which gives the maximum yearly average moisture content.
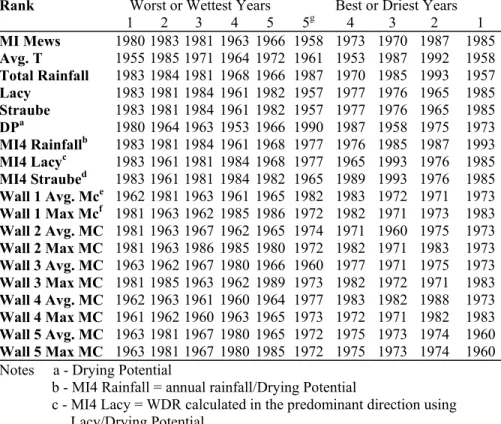
Table 4 provides a summary of the different MRYs picked using the Moisture Index approach, the 5 construction independent methods contained in Weathersmart and the construction dependent approach included in Weathersmart. Worst or wet years are considered to be years that might produce deleterious effects with respect to moisture performance, condensation within the wall for example or years where the moisture content exceeds a certain threshold for example. Similarly best or dry years are considered to be years that are conducive to drying of the wall. Table 5 provides a listing of the rankings for 5 worst and 5
If one compares individual years, the various methods give quite different results. In fact some of the years picked as worst years are picked by other methods as best. On the other hand, if one looks for a common year or years amongst the five worst or best years, there does seem to be general agreement. From Table 5 the year 1981 appears in 14 of the 18 different categories for worst year and 1973 appears in 12 of the 18 categories for best year. Still, this doesn't help much in selecting a definitive worst year using one method. For example the years selected as worst and best using the MEWS MI approach is picked 6 out 18 times for
worst and only 3 out 18 for best. The MI MEWS best year was not selected at all using the construction
dependent (modeling) approach.
How does the MEWS MI approach compare with other approaches?
Construction Independent Methods
If the MEWS MI method is compared with other construction independent methods it fares well. Picking Moisture Reference Years based on annual rainfall, wind-driven rain, and variants of the Moisture Index give roughly the same results. This is to be expected since all the methods are derived using rainfall as a basic input parameter. 1983 and 1981 are common worst picks amongst the rain-based methods. The common best pick was 1985. If annual average temperature is used to pick the MRYs there is a difference. Again this is to be expected since there is no strong correlation between annual precipitation and annual average temperature. Similarly there is no common pick between the rain-based selections and the drying potential. The drying potential, a measure of evaporation, is based on temperature and atmospheric moisture and no strong correlation exists between the drying potential and annual rainfall. The drying potential and average annual temperature approaches produce different picks for MRYs as well. This is a bit surprising since the drying potential is a derivative of temperature. The most sensitive input parameter for calculating the drying potential is the amount of atmospheric moisture. No strong relation exists between the average annual temperature and average atmospheric moisture content and hence there are no common picks between MI Mews method and temperature and evaporation based methods.
Construction Dependent Methods
Comparing the construction dependent method (model-based) with the MI Mews approach does produce a common worst year 1981. (See table 5). A common best year is also produced, 1973. Could a better correspondence between the MI MEWS method and model-based approach used in Weathersmart be achieved? One possible criticism of the model-based study was that the wall responses were generated from a continuous 31-year simulation. Years were selected from the total response curve. A better approach would be to do 31 one year simulations starting the same initial conditions and then assessing the increase or decrease in moisture content due to each specific year. The MI MEWS could also be further improved. Using yearly averages for the climate data does not match the time constants for the hygrothermal properties of the walls modeled, which are on the order of days or weeks. This suggests an approach to try for further refinement of the Moisture Index approach.
Discussion
Why bother picking Moisture Reference Years? The primary reason for developing a method for selecting Moisture Reference Years is to satisfy the requirements of hygrothermal modeling. First, hygrothermal modeling is gaining importance in the practice of designing new building envelope systems as well as retrofitting existing claddings. Currently most of the applications involve comparing the performance of competing cladding systems. Second, some jurisdictions already require certain levels of performance with respect to moisture in their codes and standards. Many of the requirements are prescriptive in form but they often provide a performance path as well. Performance could be demonstrated through the use of
hygrothermal models when these models gain sufficient acceptance.
Part 5 of the National Building Code of Canada, for example, is performance-based [27]. This part requires that wall assemblies be built in such a fashion as to minimize condensation on the surface of the warm side
(of the wall) and within the component assembly. The limiting condition is that moisture must not accumulate in sufficient amounts that could cause deterioration or adversely affect the health or safety or the intended use or operation of the building. Since this part of the Code is performance-based the comparative performances of proposed designs could be assessed through mathematical modeling through the combination of hygrothermal modeling and damage models [28][29]. Many damage models, such as those modeling the damage of wood require, as input, temperature and moisture content, readily available from hygrothermal models. It should be noted that although there are commercially available hygrothermal models the authors are not aware of any packaged damage models. However damage models have been published and they are readily implementable. The question is then, what weather years should be selected to represent the exterior boundary conditions? Code and standard writing authorities should begin
considering what method or methodology is used for selecting reference years when a performance path is followed.
Unlike Part 5 of the National Building Code of Canada, Part 9, which covers buildings not covered by Part 5, is prescriptive in nature. Proving equivalency is always an option. This is essentially a performance-based alternative option where performance of a novel design must be at least equivalent to that of prescriptive design. One article in Part 9 is concerned with location of low permeance materials within a wall assembly. The issue being addressed here is that in cases where a material has a high resistance to water vapour transfer and low air leakage characteristics there is a potential for damaging condensation to occurring if the material is not properly located. The material can be used if the low permeance layer is placed on the warm side of the wall or if outboard of a vented air space. Failing that the Code specifies acceptable locations in the assembly relative to the position of the materials providing thermal insulation, specifically at a point where a specified minimum ratio of total thermal resistance outboard of the material's inner surface to the total thermal resistance of the materials inboard of the materials inner surface occurs. This point is climate dependent. If sufficient thermal resistance is provided in the proper locations the temperature regime in critical positions of the wall can be kept above the dew point minimize the potential for damaging condensation. Table 9.25.1.2 specifies the ratio of outboard to inboard insulation for different Canadian climates [27][30]. This table was derived through the extensive application of hygrothermal
modeling [31][32]. The weather years used for the hygrothermal were statistically derived composites combining the coldest available months from the sample set into a cold year.
Another example deals with the retrofitting of masonry walls in Germany. The Energieeinsparverordnung (EnEV), the Energy Annex to the German Building Code, Verordnung über energiesparenden
Wärmeschutz und energiesparenden Anlagentechnik bei Gerbäuden (not in force yet, DIN 4108 is currently in force). The proposed new code has specific requirements for new buildings and retrofitted buildings. The main requirement deals with the whole energy demand of the building in terms of space heating and domestic hot water heating. Some specific requirements, however, are placed on the energy efficiency of building envelope sections in terms of upper limits on heat transfer in W/m2 wall area. This is a simplified method for demonstrating energy efficiency of buildings with a maximum 30% of window area. Only the material properties (thermal resistance) are taken into account. When the simplified method does not give the desired result then one can use a more detailed calculation method taking the overall energy
performance based on monthly values into account. In that case the negative influence of some building envelope components which do not fulfill the requirements can be eliminated, for instance, by a better heating system or other measures. For energy purposes reference years are provided for the zones
comprising Germany. These years are a melange of actual and statistical data intended to provide a typical year for a region (new reference years are currently in preparation). When the energy requirements are applied to historical masonry buildings several concerns arise. Since the nature of historical building usually precludes any modifications to the exterior, additional insulation can be added to the inside. Since there are no explicit prescriptions for vapour control, the only provision being no liquid water transport, in the German Code there is no rule to manage the potential for condensation which occurs within the masonry elements of the wall. A possible consequence of this is efflorescence marring the exterior appearance of the masonry. Hygrothermal modeling has been used to assess the condensation potential of masonry retrofits of historical buildings. This is the subject of an ongoing research project [33][34].
In Seattle, the Department of Design Construction and Land Use is considering improving the requirements relating to vapour retarders in the Seattle Energy Code based on the results of a recent hygrothermal
modeling study [35]. These examples show the increasing importance that hygrothermal modeling has made to current and future design practice and specifically how the years used as inputs to hygrothermal models are selected.
There is probably no one definitive Moisture Reference Year. If the problem is to determine the condensation potential of a proposed retrofit solution, selecting years using the 10% Hot/Cold method might be the most appropriate. For issues involving drying capacity a MRY based on drying potential might be better. A typical or average year based on a combination of wetting and drying would be appropriate for studying the long-term performance of wall cladding. In short, the selection of the MRY should depend on the problem being solved.
The problem at hand comprises the component of interest, its location in the wall, and the process affecting it, as well as the wall characteristics. If the problem at hand is freeze-thaw durability and the element of interest is brick then the selection of an appropriate MRY will be different than the MRY best suited to investigate the long-term performance of wood-based materials within the wall cladding.
Hygrothermal studies can be carried out in two ways. First, a series of historical data can be used for simulations and the behavior inferred from the results. The trouble here is that there is no guarantee that past trends will continue or that the sequence of years will be repeated. Second, various forms of statistical treatment can be applied to the historical data before they are used for simulations. One approach is to characterize individual years as worst, best, or typical for the problem at hand. Typical or design years might be those with 1 chance in 10 of occurring in any given year. As a further development, sequences of years can be assembled to examine any particular set of problems resulting from combinations of worst,
best, and typical.
Two general techniques for ranking years have been discussed, a construction independent approach and a construction dependent approach. Each technique has its advantages. Construction dependent approaches can be used for detailed studies of particular climates and wall types. Construction independent approaches
are probably best used for large-scale parametric studies comprising many climates and wall types. The MEWS Moisture Index is an example of construction independent approach that attempts to classify years as worst, best, or typical. The approach combines wetting and drying to rank individual years. The wetting and drying functions can be tailored to suit particular problems. Although the MEWS MI approach compares favorably with other independent methods there are discrepancies when it is compared with a representative construction dependent method. Further refinements of this approach are expected.
Conclusions
Increasing concerns for adequate moisture related performance of wall cladding systems have heightened interest in hygrothermal models. This in turn drives the need for appropriate Moisture Reference Years to be used as input for model studies. To select appropriate MRYs it must be possible to classify weather years according to criteria relevant for the problem at hand. There is probably no one definitive set of MRYs that are appropriate to solve all the hygrothermal problems of interest. Different sets of MRYs should be produced to suit different problems. As just one example, sequences of years can be assembled to deal with problems such as long-term performance or limit-state design, i.e. recurrence of years that severely stress the wall assembly. There are two different approaches for selecting MRYs, construction dependent and construction independent. Construction dependent approaches are good for detailed studies of particular walls and climates since they couple a hygrothermal model with historical weather data. Construction independent methods are appropriate for parametric studies of many different climates to assess the impact of varied climate on wall response.
The MEWS Moisture Index approach described here is an example of a construction independent method. The method is useful for three reasons:
1) it allows for the characterization of years for statistical analysis and the synthesis of sequences of years,
2) it allows for flexibility since wetting and drying functions can be tailored for specific problems of interest, and
3) the Moisture Index approach is quick and easy to implement and calculate given sufficient climate data.
The MEWS MI approach compares well with other construction independent approaches but not against the model-based construction dependent approach tried. There is, however, some general agreement amongst the various methods indicating that the approach can be modified to improve its consistency and reliability as an indicator of moisture related performance of wall systems.
Acknowledgements
The authors would like to thank the following people, all from the Institute for Research Construction, National Research Council of Canada, for their invaluable assistance:
Kumar Kumaran, Michael Lacasse, Mostafa Nofal, and Michael Swinton.
References
[1] Beaulieu, P.; Cornick, S.M.; Dalgliesh, W.A.; Djebbar, R.; Kumaran, M.K.; Lacasse, M.A.; Lackey, J.; Maref, W.; Mukhopadhyaya, P.; Nofal, M.; Normandin, N.; Nicholls, M.; O'Connor, T.; Quirt, J.D.; Rousseau, M.Z.; Said, M.N.; Swinton, M.C.; Tariku, F.; van Reenen, D. MEWS methodology for
developing moisture management strategies : application to stucco-clad wood-frame walls in North America, pp. 21, September 01, 2001 (NRCC-45213) IRC Internal Report
[2] Kumaran, M.K.; Mukhopadhyaya, P.; Cornick, S.M.; Lacasse, M.A.; Maref, W.; Rousseau, M.Z.; Nofal, M.; Quirt, J.D. and Dalgliesh, W.A.; "A Methodology to Develop Moisture Management Strategies for Wood-Frame in North America: Application to Stucco-Clad Walls", to be published at the 6th Nordic Building Physics Symposium, Trondhiem, Norway, June17-19, 2002
[3] Djebbar, R.; Kumaran, M.K.; Van Reenen, D.; Tariku, F. "Use of hygrothermal numerical modelling to identify optimal retrofit options for high-rise buildings," 12th International Heat Transfer Conference, Grenoble, France, Aug, 2002, pp. 1-6, (NRCC-45215)
[4] Cornick, S. M., Dalgliesh, W. A., Said, N. M., Djebbar, R., Tariku, F., Kumaran, M. K Task 4 -
Environmental Conditions Final Report T4-02, Institute for Research in Construction, National Research
Council of Canada, IRC-NRC, NRCC-45369, pp. 1-68. 2002
[5] Sanders, C., "Environmental Conditions, Final Report. Task 2." International Energy Agency. Energy Conservation in Buildings and Community Systems, Annex 24 Heat-Air and Moisture Transfer in Insulated Envelope Parts (HAMTIE). Laboratorium Bouwfysica, K.U.-Leuven, Belgium, 1996.
[6] Geving, S., "Moisture Design of Building Constructions: Hygrothermal analysis using simulation models - Part I and II" Ph.D. Thesis, Norwegian University of Science and Technology, Faculty of Civil and Environmental Engineering, June 1997: 41-55.
[7] Künzel, H. M., "Averaging climatic data and its effect on the results of heat and moisture transfer calculations", Report T1-D-93/05, IEA Annex 24 HAMTIE, 1993.
[8] Hagentoft, C. E., Harderup, E., "Reference for Moisture Calculations", Report T2-S93/01, IEA Annex
24 HAMTIE, 1993.
[9] Djebbar. R., van Reenen, D., Kumaran, M. K., "Indoor and Outdoor Weather Analysis Tool for Hygrothermal Modelling", Proceedings of the Eighth Conference on Building Sciences and Technology - Solutions to Moisture Problems in Building Enclosures. Toronto, Ontario. February 22-23, 2001. pp. 140-157.
[10] ASHRAE Technical Committee 4.2, Weather Information, ASHRAE Standard 169P Weather Data for
Building Design Standards. American Society of Heating, Refrigerating, and Air-Conditioning Engineers
Inc., Atlanta, Current status: In Draft.
[11] Rode, C., "Reference Years for Moisture Calculations", Denmark. Report T2-DK-93/02, International Energy Agency, Energy Conservation in Buildings and Community Systems Program, Annex 24 Heat, Air, and Moisture Transfer in Insulated Building Parts (HAMTIE).
[12] Djebbar, R.; van Reenen, D.; Kumaran, M.K. "Environmental boundary conditions for long-term hygrothermal calculations," Performance of Exterior Envelopes of Whole Buildings VIII : Integration of Building Envelopes (Clearwater Beach, Florida, 12/2/2001), pp. 1-18, January 02, 2002
[13] Ali Mohamed, F., and H. Hens, Outdoor Climate: Reference Years. Equivalent Temperature for
Condensation, International Energy Agency. Energy Conservation in Buildings and Community Systems,
Annex 24 Heat-Air and Moisture Transfer in Insulated Envelope Parts (HAMTIE). Report T2-B-92/03, 1992.
[14] Sanders C, "Proposals for work resulting from the Glasgow meeting." International Energy Agency. Energy Conservation in Buildings and Community Systems, Annex 24 Heat-Air and Moisture Transfer in Insulated Envelope Parts (HAMTIE). Report T2-UK-93/07, 1993.
[15] Karagiozis, A. N., "Advanced Hygrothermal Models and Design Models", Proceedings of Esim 2001, The Canadian Conference on Building Energy Simulation, National Resources Canada, Buildings Group, Ottawa Ontario, June 13-14, 2001. pp. 101-108.
[16] TenWolde, A., Colliver, D. G., "Chapter 2 Weather data". Moisture Analysis and Condensation
Control in Building Envelopes of Buildings, Treschel, H. R., Ed., Manual 40 ATSM Manual Series, ASTM,
2001, pp. 16-28.
[17] Hagentoft, C. E., Harderup, E., "Climatic Influences on the Building Envelope Using the Π Factor",
IEA-Annex 24 Hamtie Task 2, Environmental Conditions. Closing Seminar, Finland 1996.
[18] Bailey, H. P., "A Simple Moisture Index Based Upon a Primary Law of Evaporation", Geog. Ann., 1958, 40: 196-215.
[19] Cornick, S. M., Dalgliesh, W. A., A Moisture Index to Characterize Climates for Building Envelope Design submitted to Building and Environment May 1, 2002
[20] Lacy, R. E., "Driving-Rain Maps and the Onslaught of Rain on Buildings", Proceedings of the
RILEM/CIB Symposium on Moisture Problems in Buildings, Helsinki Finland, 1965.
[21] BSI. British Standard Code of Practise for Assessing the Exposure of Walls to Wind-driven Rain, BS 8104, British Standards Institution 1992.
[22] Künzel, H. M., Simultaneous Heat and Moisture Transport in Building Components: One- and
two-dimensional calculation using simple parameters. Fraunhofer-Institut f
ü
r Bauphysik, IRB Verlag, Stuttgart, 1995.[23] Straube, J. F., Moisture Control and Enclosure Wall Systems, Ph.D. Thesis, Civil Engineering Department, University of Waterloo, 1998.
[24] Choi, E. C. C., "Determination of wind-driven rain intensity on building faces", Journal of Wind
Engineering and Industrial Aerodynamics, 1994, 51: 55-69.
[25] Dingle, A. N., and Lee, Y., "Terminal Fall Speeds of Raindrops", J. of Appl. Meteor., Vol. 11, August 1972, pp. 877-879.
[26] Best, A. C., "The Size Distribution of Raindrops", Quarterly Journal of Royal Meteorological Society, 1950 76:16-36.
[27] National Building Code of Canada 1995. Canadian Commission on Building and
Fire Codes, National Research Council of Canada, Ottawa, 1995. Part 5: Environmental Separation, pp. 161-168, and Section 9.25: Heat Transfer, Air Leakage, and Condensation Control, pp. 271-274.
[28] Grondin, G. Y. Damage Functions for Service Life Prediction of Zinc and Steel Components, Internal
Report, Institute for Research in Construction, National Research Council Canada, 647, pp. 48, August,
1993 (IRC-IR-647).
[29] Nofal, M. Hygrothermal Damage of Building Materials and Components: State-of-the-Art Report on Studies of Hygrothermal Damage and Proposed Approach for Damage Assessments, Internal Report,
Institute for Research in Construction, National Research Council Canada, 757, pp. 139, March 01, 1998
(IRC-IR-757).
[30] Kumaran, M. K., and Haysom, J.C. "Low Permeance Materials in Building Envelopes." Construction
Technology Update, (41), Institute for Research in Construction, National Research Council of Canada,
[31] Ojanen, T. and M.K. Kumaran. "Air exfiltration and moisture accumulation in residential wall cavities." Thermal Performance of the Exterior Envelopes of Buildings V: Proceedings of the
ASHRAE/DOE/BTECC Conference, Clearwater Beach, Florida, 1992.
[32] Ojanen, T. and M.K. Kumaran. "Effect of exfiltration on the hygrothermal behaviour of a residential wall assembly." Journal of Thermal Insulation of Building
Envelopes 19, 1996, pp. 215–227.
[33] Jukka Bergmann, Heiko Fechner, Peter Häupl, Geert Houvenaghel, Ari-Veikko Kettunen, Hans Petzold "Results of the testhouse investigations", Volume 6 of final report of the EU-Project BRPR-CT96-0229 "Development of a new methodology to analyse the durability of facade repair and retrofitting systems", TU Dresden, January 2000.
[34] Heiko Fechner, Peter Häupl, John Grunewald, Moisture behaviour of a "Gründerzeit"-house by means of a capillary active calciumsilicate inside insulation, Proceedings of the Seminar “Analysis of water and salt flow in porous material and its measuring method”, Tokyo Research Institute of Cultural Properties, November 2000/
[35] Desjarlais, A. O., Karagiozis, A. N, and Aoki-Kramer, M., "Wall Moisture Problems in Seattle", Performance of Exterior Envelopes of Whole Buildings VIII: Integration of Building Envelopes (Clearwater Beach, Florida, 12/2/2001), pp. 1-8, January 02, 2002.
Selected MEWS Project Reports, 2001/2002, to be released as IRC-NRC Canada Internal Reports
M. Rousseau, M. T. Bomberg and G. Desmarais. Review of Common Approaches for Exterior Moisture Management.
W. Maref, M. A. Lacasse and D. Booth. Benchmarking of IRC’s Advanced Hygrothermal Model – hygIRC using Mid- and Large-Scale Experiments.
M. A. Lacasse, P. Beaulieu, T. O’Connor and M. Nicholls. Experimental Assessment of Water Entry into Wood-frame Wall Assemblies.
P. Mukhopadhyaya, M. K. Kumaran, F. Tariku and D. van Reenen. Parametric Analyses of Hygrothermal Behaviour of Wood-Frame Wall Assemblies
Figure Captions
Figure 1. The scatter plot shows the normalized values of the Wetting Index and Drying Index for 41 years of hourly weather data for Vancouver, British Columbia. Note that 1 - the normalized DI is plotted on the y-axis. Wetting increases along the x-axis whereas drying decreases along the y-axis. The Moisture Index is calculated as the distance from the origin. The Moisture Reference Years selected as wet, average, and dry are labeled. The Wetting Index in this case was defined on the basis of directional driving rain impinging on the wall.
Figure 2. The plot shows the deviations of individual years from the means of the climate indices for Wilmington, NC. The dark line shows the deviation from the mean for the wetting index. The light line shows the deviation from the mean for the drying index. Years selected as wet, dry, and average are highlighted. The selection was based on the Moisture Index. The dry year can be seen to have a higher than normal drying index and a lower than normal wetting index. The combination produces the lowest
Moisture Index. The Wetting Index in this case was defined as the mean annual rainfall.
Figure 3. a) This rosette shows the directional driving rain indices for four years selected from the weather record for Wilmington, NC. The years were classified as wet, average, or dry using the MI approach. The WI was defined as annual rainfall on the horizontal. A south-facing wall would experience more wind-driven rain during the average year than during either the wettest or next wettest years. b) The rosette shows the Moisture Reference Years selected for Wilmington, NC using a derivative of the directional Driving-Rain Index as the Wetting Index.
Figure 4. This rosette shows the directional driving-rain indices for the three years selected from the weather record for Vancouver, BC. The years were classified as wet (1980), average (1969), and dry (1985) using the MI approach. A derivative of the directional Driving-Rain Index was used as the Wetting Index. The predominate direction for wind-driven rain in Vancouver is east.
Figure 5. The plot shows the deviations of individual years from the means of the climate indices for Vancouver, BC. The dark line shows the deviation from the mean for the wetting index. The light line shows the deviation from the mean for the drying index. Years selected as wet (1980), dry (1985), and average (1969) are highlighted. The Wetting Index in this case was defined as the amount of wind-driven rain impinging on an east-facing wall.
Tables
Location: Wilmington, NC Years = 22 Orientation
Method North East South West
Total Straube mm/m2 9369 8472 9251 2784
Total Lacy mm/m2 9871 8987 9862 2821
Total LIF mm/m2 6846 6260 6911 1913
Total UK method mm/m2 5422 5000 5568 1438
Total AHM mm/m2 3525 3220 3547 988
Total dDRI m2/sec 54.33 50 55.68 14.37
The predominant direction for Wilmington, NC based on Straube's method is north
Table 1. Calculation of rain through a vertical plane using 6 different methods. Four of the methods, Lacy, Straube, the UK method, and the AHM method are derivatives of dDRI. The LIF-CID is the only method not directly related to dDRI. The results are given for Wilmington, NC. The values for north and south are essentially the same.
Location: Vancouver Year: 1980 Classification: wet
Parameter Means Year % from Mean comments
Temp oC 9.88 9.51 -3.67 colder
RH % 80.24 81.87 2.03 more humid
Rain mm/m2 1057.49 1213.22 14.73 more rain
aDRI m2/sec 4.82 5.33 10.71 more wind-driven rain
Wetting Index 802.91 857.04 6.74 higher WI
Drying Index 16.10 13.76 -14.55 lower DI
Ranking 0.70 1.11 59.32 higher rank
Location: Vancouver Year: 1969 Classification: average
Parameter Means Year % from Mean comments
Temp oC 9.88 9.48 -4.06 colder
RH % 80.24 81.18 1.17 more humid
Rain mm/m2 1057.49 935.57 -11.53 drier
aDRI m2/sec 4.82 4.17 -13.48 less wind-driven rain
Wetting Index 802.91 731.36 -8.91 lower WI
Drying Index 16.10 15.48 -3.85 lower DI
Ranking 0.70 0.70 0.59 higher rank
Location: Vancouver Year: 1985 Classification: dry
Parameter Means Year % from Mean comments
Temp oC 9.88 8.95 -9.38 colder
RH % 80.24 78.29 -2.43 less humid
Rain mm/m2 1057.49 849.13 -19.70 drier
aDRI m2/sec 4.82 3.55 -26.27 less wind-driven rain
Wetting Index 802.91 570.33 -28.97 lower WI
Drying Index 16.10 17.63 9.53 higher DI
Ranking 0.70 0.21 -70.63 lower rank
Table 2. The table compares the reference years for Vancouver, BC with the long-term values. Comparisons are made with temperature, relative humidity, annual rainfall, annual Driving-Rain Index, the Wetting Index (defined in terms of predominant direction of rainfall), the Drying Index (potential evaporation), and the mean ranking with respect to all of the years considered.
Year MI Year MI Year MI Year MI 1980 1.113039 1968 0.85872 1976 0.706572 1992 0.556734 1983 1.09571 1974 0.805049 1969 0.702709 1977 0.423853 1981 1.086941 1982 0.800553 1988 0.691339 1990 0.396009 1963 1.07145 1955 0.798624 1957 0.681264 1989 0.348897 1966 0.994037 1954 0.791871 1959 0.677381 1975 0.347732 1964 0.990617 1972 0.744142 1978 0.652115 1958 0.334702 1953 0.953268 1991 0.740474 1993 0.610896 1973 0.332317 1967 0.90811 1986 0.739438 1971 0.609301 1970 0.313151 1961 0.901427 1965 0.735586 1956 0.598004 1987 0.285926 1962 0.888426 1979 0.708837 1960 0.57169 1985 0.205171 1984 0.871172
Table 3. The table lists the MI values of all 41 years in the Vancouver hourly climate record. The years are listed in descending order of MI. The selected Moisture Reference Years are highlighted.
Location: Vancouver, British Columbia
Orientation Method Wet (worst year) Average (typical year) Dry (best year)
Independent
East (1) MI Approach 1980 1969 1985
N/A (2) 10% Cold/Hot 1972 1959 1953
N/A (3) Drying Potential 1980 1974 1973
N/A (4) Total Rainfall 1983 1959 1957
East (5) Wind-Driven
Rain
1983 1962 1985
East (6) Combineda 1983 1955 1985
(7) Dependent
East Wall 1 (Max MC) 1982b (1981)c * 1973 (1983)
East Wall 2 1981 (1981) * 1973 (1973)
East Wall 3 1963 (1981) * 1973 (1983)
East Wall 4 1962 (1961) * 1973 (1983)
East Wall 5 1963 (1963) * 1960 (1960)
East Combined Pick 1963 (1963) * 1973 (1973)
a - The combined approach is the Wind-Driven Rain divided by the Drying Potential b - The years were selected on the basis of maximum annual average moisture content c - The years in parentheses were selected on the basis of maximum daily moisture content
Table 4. The table lists the Moisture Reference Years selected using 6 different methods. The location is Vancouver, British Columbia. The data set comprises 41 consecutive years of hourly weather data from 1953 to 1993. Wet, dry, and when available typical moisture reference are reported. The
independent methods are based solely on weather data. The dependent method is based on one-dimensional hygrothermal analysis of 5 idealized wall sections.
Rank Worst or Wettest Years Best or Driest Years 1 2 3 4 5 5g 4 3 2 1 MI Mews 1980 1983 1981 1963 1966 1958 1973 1970 1987 1985 Avg. T 1955 1985 1971 1964 1972 1961 1953 1987 1992 1958 Total Rainfall 1983 1984 1981 1968 1966 1987 1970 1985 1993 1957 Lacy 1983 1981 1984 1961 1982 1957 1977 1976 1965 1985 Straube 1983 1981 1984 1961 1982 1957 1977 1976 1965 1985 DPa 1980 1964 1963 1953 1966 1990 1987 1958 1975 1973 MI4 Rainfallb 1983 1981 1984 1961 1968 1977 1976 1985 1987 1993 MI4 Lacyc 1983 1961 1981 1984 1968 1977 1965 1993 1976 1985 MI4 Straubed 1983 1961 1981 1984 1982 1965 1989 1993 1976 1985 Wall 1 Avg. Mce 1962 1981 1963 1961 1965 1982 1983 1972 1971 1973 Wall 1 Max Mcf 1981 1963 1962 1985 1986 1972 1982 1971 1973 1983 Wall 2 Avg. MC 1981 1963 1967 1962 1965 1974 1971 1960 1975 1973 Wall 2 Max MC 1981 1963 1986 1985 1980 1972 1982 1971 1983 1973 Wall 3 Avg. MC 1963 1962 1967 1980 1966 1960 1977 1971 1975 1973 Wall 3 Max MC 1981 1985 1963 1962 1989 1973 1982 1972 1971 1983 Wall 4 Avg. MC 1962 1963 1961 1960 1964 1977 1983 1982 1988 1973 Wall 4 Max MC 1961 1962 1960 1963 1965 1973 1972 1971 1982 1983 Wall 5 Avg. MC 1963 1981 1967 1980 1965 1972 1975 1973 1974 1960 Wall 5 Max MC 1963 1981 1967 1980 1985 1972 1975 1973 1974 1960
Notes a - Drying Potential
b - MI4 Rainfall = annual rainfall/Drying Potential
c - MI4 Lacy = WDR calculated in the predominant direction using Lacy/Drying Potential
d - MI4 Straube = WDR calculated in the predominant direction using Straube/Drying Potential
e - Avg. MC is the year where the highest average total moisture content in the wall is achieved.
f - MAX MC is the year where the highest daily average total moisture content is achieved.
g - only 31 years were used in the model-based results
Table 5. The table lists the Moisture Reference Years selected using 6 different methods. The location is Vancouver, British Columbia. The data set comprises 41 consecutive years of hourly weather data from 1953 to 1993. The columns report the five worst and the five best years picked using each method.
Drying Index versus Wetting Index 0 0.1 0.2 0.3 0.4 0.5 0.6 0.7 0.8 0.9 1 0 0.1 0.2 0.3 0.4 0.5 0.6 0.7 0.8 0.9 1 normalized Wetting Index (Precipitation)
1 nor m al iz ed Dr y ing Index MI = (x2 + y2)0.5 1980 "wet" 1985 "dry" 1969 "average" Location: Vancouver BC Years: 41 More wetting Less drying
Directional Driving Rain Rosette (m2/sec) 0 0.5 1 1.5 2 2.5 3 N NE E SE S SW W NW 1989 wet 1966 wet 1968 dry 1979 average 1989 1966 1968 1979
Directional Driving Rain Rosette (m2/sec) 0 0.5 1 1.5 2 2.5 3 3.5 N NE E SE S SW W NW 1984 wet 1988 average 1990 dry 1984 1988 1990
Directional Driving Rain Rosette (m2/sec) 0 0.5 1 1.5 2 2.5 3 3.5 N NE E SE S SW W NW 1980 wet 1969 average 1985 dry 1980 1985 1969
Yearly Deviation from Mean -2.5 -2 -1.5 -1 -0.5 0 0.5 1 1.5 2 2.5 3 1952 1954 1956 1958 1960 1962 1964 1966 1968 1970 1972 1974 1976 1978 1980 1982 1984 1986 1988 1990 1992 1994 Year Deviation (number of σ )
Rain sigma from mean DI sigma from mean
Location: Vancouver BC Dry year
Wet Year Average Year