HAL Id: hal-02904636
https://hal.archives-ouvertes.fr/hal-02904636
Submitted on 22 Jul 2020HAL is a multi-disciplinary open access archive for the deposit and dissemination of sci-entific research documents, whether they are pub-lished or not. The documents may come from teaching and research institutions in France or abroad, or from public or private research centers.
L’archive ouverte pluridisciplinaire HAL, est destinée au dépôt et à la diffusion de documents scientifiques de niveau recherche, publiés ou non, émanant des établissements d’enseignement et de recherche français ou étrangers, des laboratoires publics ou privés.
One MAX phase, different MXenes: a guideline to
understand the crucial role of etching conditions on
Ti3C2Tx surface chemistry
Mohamed Benchakar, Lola Loupias, Cyril Garnero, Thomas Bilyk, Claudia
Morais, Christine Canaff, Nadia Guignard, Sophie Morisset, Hanna Pazniak,
S. Hurand, et al.
To cite this version:
Mohamed Benchakar, Lola Loupias, Cyril Garnero, Thomas Bilyk, Claudia Morais, et al.. One MAX phase, different MXenes: a guideline to understand the crucial role of etching conditions on Ti3C2Tx surface chemistry. Applied Surface Science, Elsevier, 2020, pp.147209. �10.1016/j.apsusc.2020.147209�. �hal-02904636�
1
One MAX phase, different MXenes: a guideline to
understand the crucial role of etching conditions on
Ti
3
C
2
T
x
surface chemistry
Mohamed Benchakar,a Lola Loupias,a Cyril Garnero,a,b Thomas Bilyk,b Cláudia Morais,a Christine Canaff, a Nadia Guignard,a Sophie Morisset,a Hanna Pazniak,b Simon Hurand,b Patrick
Chartier,b Jérôme Pacaud,b Vincent Mauchamp,b Michel W. Barsoum,c Aurélien Habrioux,a,* Stéphane Célérier a,*
a
Institut de Chimie des Milieux et Matériaux de Poitiers (IC2MP), Université de Poitiers, CNRS,
F-86073 Poitiers, France
b
Institut Pprime, UPR 3346 CNRS, Université de Poitiers, ISAE-ENSMA, BP 30179, 86962
Futuroscope-Chasseneuil Cedex, France
c
Department of Materials Science and Engineering, Drexel University, Philadelphia, PA 19140,
United States
Corresponding Authors:
2 KEYWORDS
MXene, Ti3C2Tx, etching agent, surface chemistry, surface properties, oxidation, hydrogen
evolution reaction
ABSTRACT
MXenes are a new, and growing, family of 2D materials with very promising properties for a
wide variety of applications. Obtained from the etching of MAX phases, numerous properties
can be targeted thanks to the chemical richness of the precursors. Herein, we highlight how
etching agents govern surface chemistries of Ti3C2Tx, the most widely studied MXene to date.
By combining characterization tools such as X-ray diffraction, X-ray photoelectron, Raman and
electron energy loss spectroscopies, scanning and transmission electron microscopies and a
surface sensitive electrochemical reaction – the hydrogen evolution reaction, HER – we clearly
demonstrate that the etching agent (HF, LiF/HCl or FeF3/HCl) strongly modifies the nature of
surface terminal groups (F, OH and/or O), oxidation sensitivity, delamination ability, nature of
the inserted species, interstratification, concentration of defects and size of flakes. Beyond
showing how using these different characterization tools to analyze MXenes, this work
highlights that the MXene synthesis routes can influence targeted applications.
1. Introduction
MXenes are among the newest and largest family of 2D materials with demonstrated
applications in diverse fields such as electromagnetic interference shielding [1], transparent
3
supercapacitors [8], batteries [8], catalysis [9], photocatalysis [10],hydrogen storage [11], gas
and biosensors [12,13], electromechanical actuators [14], pH and humidity sensor [15,16],
nanomedicine [17] or gas and liquid separation and purification[18,19]. The properties and
potential applications of these materials have been the subject of several recent reviews[20–25].
This very broad spectrum of applications is mostly due to the high versatility of the MXene
composition and thus of their related properties. Indeed, these materials are synthesized by
selectively etching the A element from the Mn+1AXn phases, a family of about 150 different
members of layered ternary carbides, nitrides or carbonitrides [26], where M is an early
transition metal, A is an element mostly from columns 13 or 14 of the periodic table (i.e. group
IIIA or IVA), X is C and/or N and n = 1 to 3, leading to the formation of many different Mn+1Xn
metal carbides and/or nitrides [27]. To date, more than 30 different MXenes have already been
synthesized and many others have been theoretically predicted [24],[28]. Beyond the possibility
to tune the MXene composition and related properties by changing the MAX phase precursor, it
is well-established that different etching protocols lead to Mn+1XnTx flakes with different T
terminal groups (F, OH and/or O), that can also strongly modify MXene properties [29–32].
Although crucial for many applications, the effects of MXenes functionalization on properties is
still in its infancy because of the limited number of etching processes and the need to design
characterization protocols that can accurately quantify the nature of these terminations and relate
them back to the synthesis methods.
To date, several etching agents have been studied, the most common of which are HF [33],
NH4HF2 [34], LiF in HCl or LiCl in HF [8,35]. Moreover, LiF can be replaced by other salts
such as NaF, KF, CsF [8]. More recently transition metal-fluorides were used, such as FeF3 and
4
40]. Other methods, including electrochemical etching [40,41] and etching with molten salts
[42], have also been used. The choice of the etching agent has been shown to have a large impact
on the surface chemistry, oxidation sensitivity, hydrophilic properties, delamination ability,
conductivity, nature of inserted cations, size of flakes and degree of defects among other
properties [36,43].
Although several studies compared the effect of different etching agents [36,43], a straight
and systematic comparison of the Ti3C2Tx surface chemistries obtained using the same initial
MAX phase powder and combining characterization tools such as ray diffraction (XRD),
X-ray photoelectron spectroscopy (XPS) and Raman spectroscopy in the same study is currently
lacking in the literature. Additionally, many studies have focused on the etching of Ti3C2Tx using
HF but the etching conditions, such as temperature, duration, HF concentration can vary
considerably from one report to another. This is mainly due to the fact that the structural and
physicochemical properties of the initial Ti3AlC2 powders (e.g., grain size, crystallinity, purity,
synthesis protocol) vary, thus rendering a direct comparison between different studies difficult.
For example, Kong et al.[44] showed that the Ti3AlC2 synthesis method (combustion or
pressureless synthesis) significantly affects the electrochemical properties of the obtained
MXenes. Shuck et al. [45] illustrated also the major role of the MAX synthesis method on the
corresponding MXene properties. The use of the same initial MAX phase is therefore crucial for
a rational study of the role of the etching agents on MXene properties.
The purpose of this work is to analyze the influence of different etching agents on the surface
chemistries of Ti3C2Tx multilayers obtained from the same MAX phase batch. We chose to focus
on three different etching agents: HF, LiF/HCl and FeF3/HCl as they result in very different
5
one batch, the etching conditions are described as soft; for the other the conditions were harsher.
This work does not aim at precisely studying the effect of each synthesis parameter such as
temperature or concentration for each etching agent, but it intends to highlight, for a given
etchant, how the surface chemistries can be impacted by simply adjusting the synthesis
conditions. Therefore, a complete set of characterizations (XRD, SEM, EDS, XPS, Raman,
TEM-EELS) was performed to determine structural features of the different Ti3C2Tx
multi-layers. Obtaining significantly different surface states for Ti3C2Tx was also used as a helpful
database to confirm or rebut assignments of spectroscopic signals (Raman, XPS) proposed in the
literature. This was also useful to provide a better understanding of differences observed in XRD
patterns. Lastly, in order to further highlight the crucial role played by the synthesis conditions
on the surface properties, the hydrogen evolution reaction, HER, was used as a probe reaction as
it is mainly driven by the surface properties of the material under study.
2. Experimental
2.1 Synthesis of materials
To produce Ti3C2Tx MXene powders (6 samples), 3 different etching agents were used:
HF, LiF/HCl and FeF3/HCl with two quite different conditions (labelled as soft and harsh).
Systematically, 0.5 g of the Ti3AlC2 MAX phase precursor (initial particles sizes < 25 m, see
ESI part I for MAX synthesis) was used.
Ti3C2-HF10 and Ti3C2-HF48. The Ti3AlC2 powder was gradually added to 10 mL of
hydrofluoric acid, HF, under stirring. [Safety Note: hazardous product requiring appropriate
protocol]):
6
- 10 wt.% for Ti3C2-HF10 (prepared by dilution of HF-48wt%) (soft conditions)
The mixture was stirred at 25 °C for 24 h before the centrifugation step.
Ti3C2-Li-24/25 and Ti3C2-Li-72/60. The Ti3AlC2 powder was gradually added to 10 mL of
0.8 g of LiF ( 99%, Sigma) dissolved in 10 mL of 9 mol L-1 HCl (prepared by HCl 37%, Sigma Aldrich). Thus, the initial F/Al atomic ratio is of 12. The reaction was running for 24 h at 25 °C
(Ti3C2-Li-24/25 – soft conditions) or 72 h at 60 °C (Ti3C2-Li-72/60 – harsh conditions) under
stirring. This synthesis method is partly based on the work of Alhabeb et al. [43].
Ti3C2-Fe-24/25 and Ti3C2-Fe-72/60. Ti3AlC2 was gradually added to 10 mL of 1.716 g of
FeF3,3H2O (Sigma-Aldrich) dissolved in 10 mL of 9 mol L-1 HCl (prepared by HCl 37%, Sigma
Aldrich). As in the case of LiF/HCl etching method, the F/Al atomic ratio is of 12. The reaction
was running for 24 h at 25 °C (Ti3C2-Fe-24/25 – soft conditions) or 72 h at 60 °C (Ti3C2
-Fe-72/60 – harsh conditions) under stirring. This synthesis method is partly based on the work of
Wang et al. [36].
Except for Ti3C2-Li-24/25, the suspension obtained after the etching step was centrifuged 4
times at 6000 rpm for 6 min with ultrapure water (these washing cycles are sufficient to reach a
supernatant pH value higher than 5) and the supernatant liquid was systematically removed. The
resulting sediment was then filtered using a vacuum-assisted filtration device (PVDF membrane,
0.22 m pore size), washed several times with ultrapure water, and dried one night at room temperature under air. As already proposed by some of us [36], the powders were finally washed
in 350 mL of deaerated water during 4 h to remove aluminum impurities following by filtering
and drying at room temperature under air during one night. The powders are then weighted and
7
For Ti3C2-Li-24/25, the suspension obtained after etching, including Ti3C2Tx and non-reacted
Ti3AlC2, was centrifuged 8 times at 6000 rpm for 6 min and the supernatant liquid was
systematically removed. The black Ti3C2Tx slurry was then carefully collected and separated
from the surface of the sediment Ti3C2Tx/Ti3AlC2 with a spatula as proposed by Alhabeb et al.
[43]. The slurry and the sediment were then filtered separately, washed and dried one night under
air at room temperature and finally weighted and stored under inert atmosphere.
2.2 Characterization of materials
XRD analysis of the MXene powders were carried out with a PANalytical EMPYREAN
powder diffractometer using CuK radiation source (K1 = 1.5406 Å and K2 = 1.5444 Å). XRD
patterns were collected between 5 and 70 ° with a 0.07 ° step and 420 s dwell time at each step.
An ultra-fast X-Ray detector (X’Celerator) was used to collect the signals. The identification of
Ti3AlC2, TiC, and LiF phases was performed with the HighScorePlus software (PANalytical©)
and by comparison with the ICDD database reference files. Phase identification of MXene from
the XRD patterns is based from our previous works [46].
The XPS analysis were carried out with a Kratos Axis Ultra DLD spectrometer using a
monochromatic Al Kα source (1486 eV, 10 mA, 15 kV). When required, a charge neutraliser
system was operated for the analysis. Instrument base pressure was 9×10⁻⁸ Pa. High-resolution spectra were recorded using an analysis area of 300 μm×700 μm2
and a 20 eV pass energy.
These pass energies correspond to Ag 3d5/2 FWHM of 0.55 eV. Data were acquired with 0.1 eV
steps. All the binding energies were calibrated with the C1s (C-Ti-Tx) binding energy fixed at
281.9 eV as an internal reference since this component is present in all MXenes and it is very
8
Raman spectroscopy was carried out using a HORIBA Jobin Yvon LabRAM HR800
confocal Raman microscope with a CCD detector. Spectra were acquired at RT using an
excitation wavelength of 632.8 nm, supplied by an internal He-Ne laser. The power delivered at
the sample is less than 1 mW. An 1800 grooves.mm-1 grating is used resulting a spectral resolution of 0.5 cm-1. The spectrometer is calibrated by a silicon wafer.
It is important to note here that all Raman and XPS spectroscopies were performed on fresh
samples (i.e. less than 24 h after synthesis) except when it is specified (aged samples).
The Al, Ti, Li and Fe contents of the different Ti3C2Tx were determined by Inductively
Coupled Plasma-Optical Emission Spectrometry (ICP-OES) using a PerkinElmer Optima
2000DV instrument. The determined contents of each element were normalized to 3 Ti atoms.
The morphology of the MXene powders was studied using a field emission gun scanning
electron microscope (FEG-SEM) 7900F from JEOL. This microscope is equipped with an
Energy Dispersive X-ray Spectrometer (EDS) from Brücker (with Esprit software) allowing the
determination of the O, F, Al, Ti, Cl and C contents. The determined contents of each element
were normalized to 3 Ti atoms.
Specific surface area measurements were performed using nitrogen adsorption at -196°C
with a TRISTAR 3000 gas adsorption system. Prior N2 adsorption, the powder samples were
degassed under secondary vacuum for 12 h at 80 °C. The BET equation was used to calculate the
specific surface area of the samples (SBET in m2 g-1).
Transmission electron microscopy (TEM) experiments were performed on the Ti3C2
-Li-72/60 sample. TEM samples were prepared by diluting the powder into water followed by
ultrasonication for 2 minutes with a power of 150 W to separate the Ti3C2Tx flakes. A drop of the
9
observed areas on the sample were investigated using energy filtered electron diffraction (EFED)
and electron energy loss spectroscopy (EELS). Both short range and long-range order was
probed in the MXene structure. Experiments were performed in a JEOL 2200 FS TEM, operating
at 200 kV, and equipped with an in-column omega filter. A 10 eV slit was used to acquire the
EFED patterns. The energy resolution was about 1.0 eV and the collection angle was about 5
mrad. EEL spectra in the core losses were recorded. The backgrounds of the core-losses spectra
were extracted using a power law and the multiple scattering effect was removed using the
Fourier-ratio method.
2.3 Electrochemical measurements
All electrochemical measurements were carried out at RT in a standard three-electrode
electrochemical cell using potentiostat Autolab (PGSTAT-302N) coupled with a rotating disc
electrode (RDE) on fresh samples (unless otherwise stated). An Ag/AgCl (saturated KCl-filled)
(EAgCl/Ag = 1.02 V vs. RHE) electrode and a glassy carbon plate were used, respectively, as
reference and counter electrode. A 3 mm diameter glassy carbon (GC) disc was used as the
working electrode substrate. The catalytic inks were prepared by dispersing 10 mg of catalyst
powder in a mixture composed of ultra-pure water (500 µL), isopropanol (500 µL) and Nafion® (100 µL), followed by ultrasonication for 10 min. 3 μL of the dispersed catalyst were deposited onto the surface of the working electrode (catalyst loading of 0.38 mg cm-2) and the deposit was dried under N2 flow.
The measurements were conducted in a N2 saturated 1 mol L-1 KOH (86.5%, VWR) aqueous
electrolyte. Firstly, cyclic voltammograms were recorded in a nitrogen-saturated electrolyte from
0.15 to 1.35 V vs RHE at a scan rate of 50 mV s-1. Then the activity of catalysts towards HER was examined by recording linear sweep voltammograms from 0.5 to -0.6 V vs. RHE at a scan
10
rate of 5 mV s-1 by applying a rotating rate of 1600 rpm to the RDE. All measurements were IR-drop corrected by determining the cell resistance using electrochemical impedance spectroscopy
measurements (EIS) between 0.1 Hz-100 KHz. Spectra were acquired in the capacitive region
with a Solartron SI 1287 electrochemical interface and an SI 1260 impedance/gain-phase
analyser.
3. Results and discussion
All the here-investigated MXenes were synthesized from the same initial MAX phase,
Ti3AlC2 powder, as precursor. The synthesis conditions of the different MXenes are summarized
in Table 1 and the different separation/washing steps are described in the experimental part and
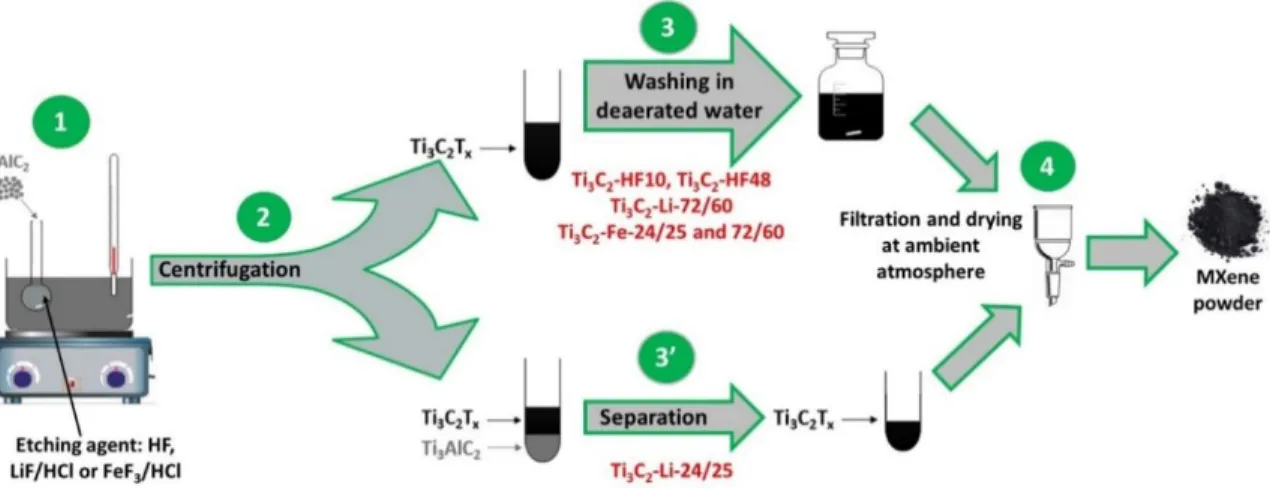
depicted in Scheme 1.
Scheme 1. Schematic representation of various MXenes syntheses methods used in this work.
Table 1. Summary and labels of synthesis conditions employed to obtain different Ti3C2Tx
powders. In each case, 0.5 g of Ti3AlC2 powders and 10 mL of etching solution were used.
MXene Labelled
condition Etching agent (10 mL)
Synthesis parameters Initial F/Al atomic ratio* Ti3C2-HF10 soft HF 10 wt.% 24 h – 25 °C 21 Ti3C2-HF48 harsh HF 48 wt.% 24 h – 25 °C 98
11
Ti3C2-Li-72/60 harsh 0.8 g of LiF in 9 M HCl 72 h – 60 °C 12
Ti3C2-Fe-24/25 soft 1.716 g of FeF3 in 9 M HCl 24 h – 25 °C 12
Ti3C2-Fe-72/60 harsh 1.716 g of FeF3 in 9 M HCl 72 h – 60 °C 12
* Atomic ratio between the fluorine contained in the etching agent and the Al in Ti3AlC2.
Three different etching solutions were used. They are:
i) HF with two different concentrations, viz. 10 and 48 wt.% (Table 1).
ii) LiF/HCl. This method, first reported in 2014 [8], resulting in the in-situ formation of HF, was
recently improved by Alhabeb et al [43], with the design of the MILD method (minimally
intensive layer delamination) allowing the production of single, as well as large flakes with low
amounts of structural defects. Beyond the fact that this method avoids using hazardous HF, the
delamination of sheets is favored because of the simultaneous insertion of Li cations and water
molecules between sheets during the etching step [47]. In the here reported work, the MILD
conditions, i.e. exfoliation of Ti3AlC2 at 25 °C during 24 h, was reproduced (sample labelled
Ti3C2-Li-24/25). For comparison, a harsher synthesis - 60 °C for 72 h, was investigated (sample
labelled Ti3C2-Li-72/60 – Table 1). Increasing both etching temperature and duration was
deliberate in order to exacerbate differences between their properties.
iii) FeF3/HCl. As shown in our previous work [36], LiF can be substituted by iron fluoride, FeF3,
as the etching agent. These samples - labelled Ti3C2-Fe-24/25 and Ti3C2-Fe-72/60 - were
prepared using identical F/Al atomic ratios, temperatures and times (see Table 1) used for the
Ti3C2-Li-24/25 and Ti3C2-Li-72/60 samples, respectively.
12
The X-ray diffraction (XRD) patterns of the different samples are plotted in Fig. 1. With one
exception, all of the etching conditions resulted in the total loss of Ti3AlC2 peaks – at 2 of 9.54,
19.18 and 38.92° (see Fig. S1 of ESI) - from the XRD patterns. For the Ti3C2-Fe-24/25 sample, a
very small amount of unreacted MAX phase is observed. The absence of MAX phase peaks in
the XRD patterns is taken as direct evidence for the total etching of Al. This result is further
confirmed by Inductively Coupled Plasma - Optical Emission Spectrometry (ICP-OES) analysis.
The ICP results reported in Table 2 clearly show that the highest number of Al per 3 Ti atoms is
only of 0.08. Furthermore, according to the XRD patterns, and with one exception, we see no
evidence for crystallized secondary phases, such as TiC, TiO2 or AlF3, that are sometimes
13
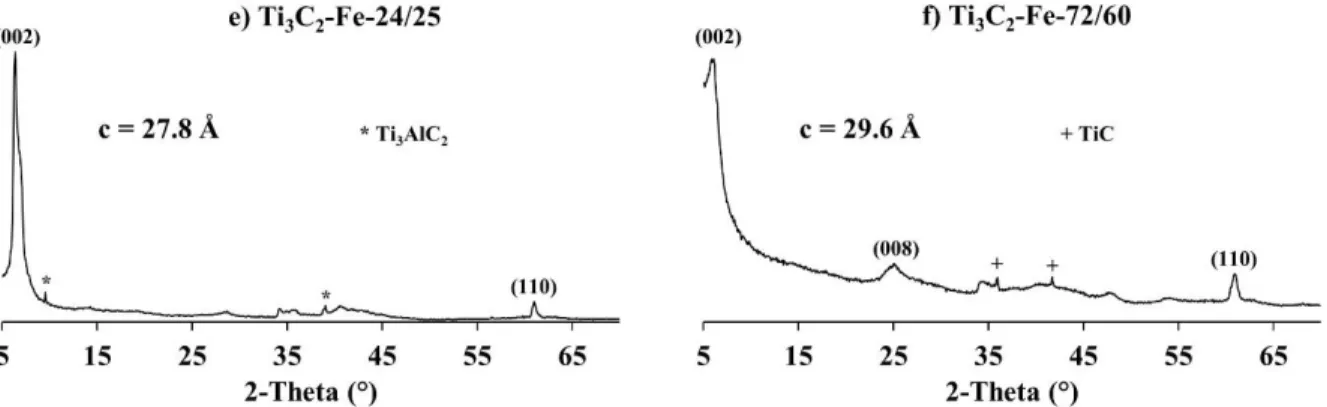
Fig. 1. XRD patterns of different Ti3C2Tx MXenes. For the sake of clarity, only the (00l) and
(110) peaks of MXenes are indexed. Note presence of unreacted MAX phase peaks in e) and TiC in f).
Table 2 ICP analyses of Ti3C2Tx final powders prepared with different etching agents. The
content of each element is normalized to 3 Ti atoms. The final amount of MXene obtained from 0.5 g of Ti3AlC2 by the different synthesis methods is reported in last column.
MXene ICP-OES Amount of MXene after synthesis
(g) Ti Al Li Fe Ti3C2-HF10 3 <0.01a - - ≈ 0.40 Ti3C2-HF48 3 0.08 - - ≈ 0.51 Ti3C2-Li-24/25 3 0.01 0.04 - ≈ 0.10 Ti3C2-Li-72/60 3 <0.01a 0.02 - ≈ 0.45 Ti3C2-Fe-24/25 3 0.04 - 0.03 ≈ 0.40 Ti3C2-Fe-72/60 3 0.05 - 0.06 ≈ 0.22
a Below the detection limit
The XRD pattern of the Ti3C2-HF48 powders is similar to those previously reported using the
same preparation conditions [33]. It is well-established that the substitution of Al by terminal
groups during the etching step involves a shift of (00l) peaks of the initial MAX phase towards
lower diffraction angles leading to higher c lattice parameter value (c = 18.5 Å for Ti3AlC2). The
c parameter value of 19.9 Å obtained for the Ti3C2-HF48 material is the lowest value obtained
herein, indicating that no water is intercalated between sheets for this material. For the Ti3C2
-HF10 powders, two (002) peaks can be clearly identified: a more intense one corresponding to a
14
Å. The latter indicates the presence of some water between the sheets and is characteristic of the
interstratification phenomenon observed in clay materials, as described in our previous work
[46]. This hydration heterogeneity involves different layer-to-layer distances in the multilayer
particle. The observation of two distinct peaks is also characteristic of partial segregation, i.e.,
wherein a succession of layers having the same hydration state is favored over a random one
[46].
As observed in Fig. S2, before the washing step (step 3 of Scheme 1), the Ti3C2-HF10 sample
is mainly composed of stacks having an interlayer spacing leading to a c parameter value of 25.5
Å (Fig. S2a) revealing higher amounts of water layers intercalated in the MXene structure. It is
well-known that the presence of cations is required to stabilize water molecules between the
sheets since the MXene surface is negatively charged [35,46]. So, in the present case, it is very
likely that H3O+ (coming from the acid of the etching agent) stabilizes the interlayer water
molecules. The stabilization of water molecules with H3O+ was already reported [47]. The
washing step, performed at low concentration - 0.5 g in 350 mL of deaerated water - has a crucial
role for this sample since it removes these cations, probably by osmotic pressure, leading to a
partial dehydration of the MXene. Consequently, washing results in a decrease in the c parameter
value and the aforementioned segregation phenomenon is observed. In contrast, the XRD
patterns of the Ti3C2-HF48 powders (Fig. S2c and d) evidence a negligible effect of the washing
step on c. The c parameter at 19.9 Å does not evolve with washing, indirectly demonstrating the
absence of water and cations between sheets. Thus, in contrast to the Ti3C2-HF48 sample, the
Ti3C2-HF10 multilayers exhibit a real ability for the insertion of few water molecules between
their sheets. Nevertheless, once the water layers are removed, it is not possible to increase again
15
In the Ti3C2-Li-24/25 case, a separation step by centrifugation (step 3’ – Scheme 1) was
required to obtain a MXene free from the initial MAX phase. A high fraction of unreacted MAX
phase always remained in the sediment (see Fig. S3) and the complete separation of the MAX
and MXene was difficult. It is for this reason that the fraction of obtained MXene for this etching
protocol (≈ 0.1 g) is considerably smaller than the other methods (see Table 2). Nevertheless, as
proposed by Alhabeb et al [43], the sediment can be reused to undergo the synthesis protocol. In
comparison with the (002) peaks, the intensities of other (00l) peaks are so low that a higher
magnification of the diffractogram is required to reveal them (Fig. S3b). The asymmetry of these
(00l) peaks combined with the position of the (002) peak corresponding to a c parameter value of
27.3 Å, value between 25 Å (one water layer) and 31 Å (two water layers), reveals a random
distribution of interlayer spacing having one water layer or two water layers stabilized by the Li+ cations [35,46], characteristic of interstratified MXenes [46].
The XRD pattern of Ti3C2-Li-72/60 sample (Fig. 1) is close to that of Ti3C2-Li-24/25 sample
with a c parameter value of 24.7 Å. As expected [8,36], both MXenes have intercalated water
molecules between the sheets contrary to the Ti3C2-HF48 (19.9 Å) powders for which no water
was present between the layers. It should be noted that a LiF impurity is sometimes observed in
the XRD patterns (Fig. S3b). Nevertheless, the LiF amount is quite low as confirmed by the Li
content determined from ICP analyses (Table 2). Finally, the use of harsher conditions (Ti3C2
-Li-72/60 material) makes it possible to obtain a higher amount of MXene (≈ 0.45 g – Table 2) in a
one-pot synthesis compared to the Ti3C2-Li-24/25 sample and does not require an additional
separation step (like in step 3’ of Scheme 1).
For the FeF3-etched samples, the characteristic MXene diffraction are also observed and
16
Interestingly, whereas the etching conditions are similar for Ti3C2-Fe-24/25 and Ti3C2-Li-24/25
samples, the etching of Al is clearly favored when FeF3/HCl is used since the fraction of
unreacted MAX phase is quite low and the separation step (step 3’ of Scheme 1) is not required.
Furthermore, the obtained MXene amounts in a one-pot synthesis is four times higher: 0.4 g and
0.1 g for Ti3C2-Fe-24/25 and Ti3C2-Li-24/25 samples, respectively (Table 2). Consequently, Al
etching is not only due to the in-situ generated HF (the initial fraction of F is similar for both
samples) but also the cations present. In this case, Fe also plays a major role in the etching
process and this will be discussed in section 3.4 of this manuscript. The asymmetric shape of the
XRD peaks obtained when Fe is used, also indicates an interstratification phenomenon. The c
parameter values of 27.8 Å and 29.6 Å calculated for Ti3C2-Fe-24/25 and Ti3C2-Fe-72/60
MXenes, respectively, are higher than those obtained when starting with HF or LiF in the etching
solutions, suggesting the simultaneous insertion of water molecules and Fe cations between the
MXene sheets. The amount of Fe present, however is quite low (Table 2) but previous works
showed that a low amount of cations is enough to stabilize water layers (for example: 0.08 Mg
for 3 Ti) [47].
For the Ti3C2-Fe-72/60 sample, only 0.22 g of MXene was obtained, indicating that a
significant amount of the MAX phase and/or the synthesized MXene dissolves during the
process. At 0.45 g, the remaining MXene amount for the Ti3C2-Li-72/60 sample is more than
double. Thus the FeF3-etching agent is significantly harsher and results in over-etching. The low
amount of TiC observed as a secondary phase in the XRD pattern recorded for Ti3C2-Fe-72/60
sample (Fig. 1) confirms the over-etching. Indeed, TiC is a small impurity in the initial MAX
phase which is not affected during the etching process and thus remains after the synthesis.
17
detected by XRD. In contrast, for the latter, since a relative large fraction of MAX/MXene
dissolves, the fraction of TiC in the global sample increases explaining why it is observed by
XRD.
3.2 Raman and XPS spectroscopies
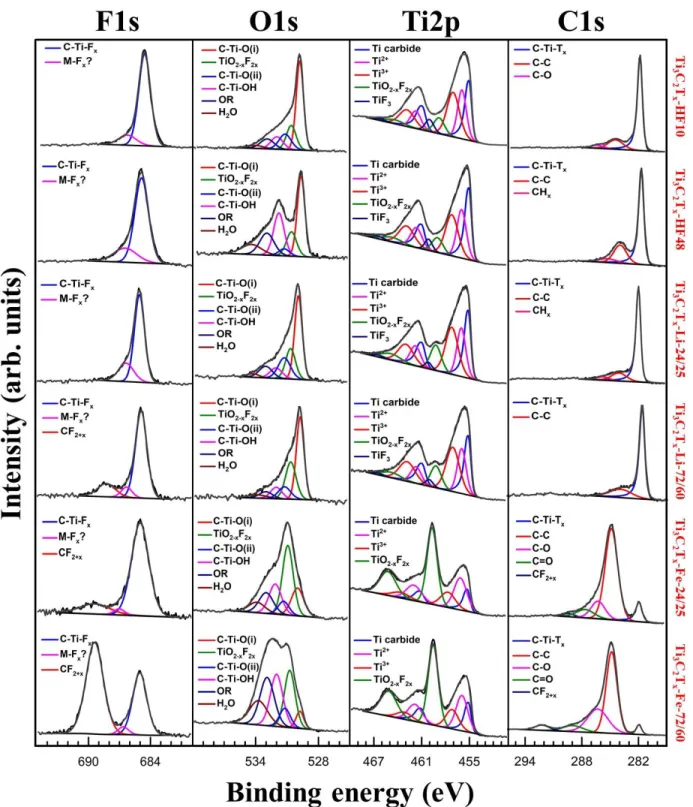
The XPS spectra of Ti 2p, O 1s, C 1s and F 1s of the different samples are plotted in Fig. 2
and the fitting results are reported table S1 to S7. XPS is currently an essential tool to understand
the surface chemistry of MXenes and several recent papers have reported on the spectral
decomposition of the different photopeaks associated with MXenes [48–50]. As noted above,
one of the aims of the present work is to provide a better methodology to decompose
experimental XPS signals, thanks to the synthesis of Ti3C2Tx samples with different surface
18
Fig. 2. XPS high resolution spectra of F 1s, O 1s, Ti 2p and C 1s regions for the different
Ti3C2Tx samples whose labels are listed on right hand side.
In the Ti 2p region, it is now well-established that the 3 doublets of asymmetric peaks
19
eV and labeled as Ti carbide, Ti2+ and Ti3+, respectively, are related to the MXene structure: C-Ti-C in the core of the layer, C-Ti-O, C-Ti-F and C-Ti-OH corresponding to Ti atoms bonded to
both C atoms and terminal groups. Nevertheless, the assignation of each peak to a specific bond
is not clear since numerous discrepancies can be found in the literature [48–50]. Moreover, due
to their closeness in terms of binding energy, the decomposition of the 3 peaks is not obvious
since different combinations of peak positions and full width at half maxima (FWHM) can
provide a good refinement while drastically changing the area ratio between peaks. Nevertheless,
for quantification purposes, we can undoubtedly attribute these 3 contributions to MXene Ti
atoms.
In the pioneering XPS work done by Halim et al. [48], the Ti atoms bonded to F-terminal
groups was shown to be responsible for the appearance of the band centered at ca. 460.0 eV. By
correlating the area of this latter peak with the one of C-Ti-F in the F 1s spectra, the obtained
F/Ti ratio is inconsistent (see Tables S2 to S7 and the F/Ti ratio determination in part III of ESI).
For example, the F/Ti ratios of ≈ 11 and 7 are found for the Ti3C2-HF48 and Ti3C2-HF10
samples, respectively. This is impossible since in the Ti3C2Tx formula group, x is considered to
be 2 or less [48]. Moreover, the magnitude of this peak is similar for Ti3C2-HF48 and Ti3C2
-HF10 (table S2 to S3) whereas it is clear that Ti3C2-HF48 have more F terminal groups as
discussed below. Thus, it is clear that F terminal groups contributions should be involved in the
three above mentioned contributions assigned to the MXene Ti atoms as proposed by Schultz et
al. [50] and Persson et al. [49]. The peak centered at ca. 460.0 eV and labelled in the present
work as TiF3 is therefore herein attributed to the formation of a minor secondary phase, TiF3±x,
20
a commercial TiF3 powder. A peak was obtained at a B.E. of 460.5 eV (Fig. S4a) which is close
enough to our 460.0 eV peak.
Furthermore, the doublet at ca. 459.0 eV (Fig. 2 and table S2 to S7) in the Ti 2p region was
assigned to the presence of TiO2-xF2x. In general, the peak corresponding to TiO2 is centered at
ca. 458.8 eV [51]. However, the introduction of small amounts of F in this structure, resulting in
TiO2-xF2x, leads to a shift of this peak towards higher B.E. values (ca. 459.1 eV) [51]. Thus, the
oxidation observed for the different samples can be assigned to the formation of a TiO2-xF2x
oxyfluoride. This comment notwithstanding, one cannot exclude that this shift toward a higher
B.E. simply results from a stronger electronic interaction of TiO2 with the MXene conductive
substrate.
The magnitude of this contribution is particularly high for the Fe samples showing that these
materials are the most oxidized ones (Fig. 2). Therefore, this photopeak can be safely assigned to
an oxidation of the MXene surface resulting in the formation of a fluorinated TiO2 viz. TiO2-xF2x.
Raman spectroscopy, discussed in the next section, confirms this conclusion. The fraction of
oxidized Ti atoms was determined by calculating the ratio between the area of the peak
corresponding to TiO2-xF2x (459.1 eV) and all peaks involving chemical bonds formed with the
Ti atoms (Table 3).
Peaks in the O 1s region were assigned based on reported studies [52]. The peaks centered at
ca. 529.7-529.8 eV and at ca. 531.2-531.3 eV labelled as C-Ti-O (i) and C-Ti-O (ii) in our work
can be attributed to –O terminal groups bonded to Ti atoms at two different crystallographic
sites, previously described as bridging and A sites, respectively [50]. The peak at ca. 531.8-532.0
eV can be ascribed to hydroxyl terminal group bonded to Ti atoms. Lastly, the peak centred at
21
the surface of the multi-layered particles). The peak centered at ca. 530.6-530.8 eV is attributed
to TiO2-xF2x. Importantly, the intensity of this peak increases as that of the peak attributed to
TiO2-xF2x in the Ti 2p region also increases, particularly for the oxidized Fe samples, thus
confirming our assignment. Finally, the contribution at ca. 533 eV corresponds to O bonded to
adventitious carbon (labelled OR in Fig. 2) as proposed by Schultz et al. [50]. Nevertheless, we
cannot exclude that a small fraction of this adventitious O is also present in the peak assigned to
hydroxyl groups at ca. 531.8-532.0 eV.
In the C 1s region, the peak at ca. 281.9 eV can be undoubtedly assigned to C-Ti-Tx moieties
[48–50]. The others contributions (Table S2 to S7) are ascribed to the contamination of the
MXene surface by the atmosphere [48,50]. Nevertheless, the high magnitude of the C-C
contribution in the most oxidized samples (Ti3C2-Fe-24/25 and Ti3C2-Fe-72/60) can be also
partly due to the formation of amorphous C during the etching process due to oxidation and
over-etching (Fig. 2). The formation of amorphous carbon during MXene oxidation process was
already reported in the literature [53].
In the F 1s region, the major contribution at ca. 685.0 eV can be assigned to C-Ti-F groups.
Nevertheless, F atoms belonging to TiO2-xF2x and TiF3 compounds also contribute to this peak.
Indeed, the F 1s peak for TiO2-xF2x is 684.6 eV [51]. We measured a B. E. of 685.1 eV for TiF3
(Fig. S4a). The low intensity peak at 686.5 eV is probably related to an unknown fluorinated
secondary phase or to F atoms directly bonded to MXene C atoms exposed due to the dissolution
of some of Ti atoms. The others peaks at higher B.E can be assigned to the formation of F
polymeric chains involving CF2 or CF3 groups [54]. As observed, this photopeak is present
almost exclusively on MXenes prepared with the FeF3/HCl etching solution which are the most
Ti-22
C bonds allowing for the formation of fluorinated polymeric C chain thanks to the presence of F
atoms in the etching environment.
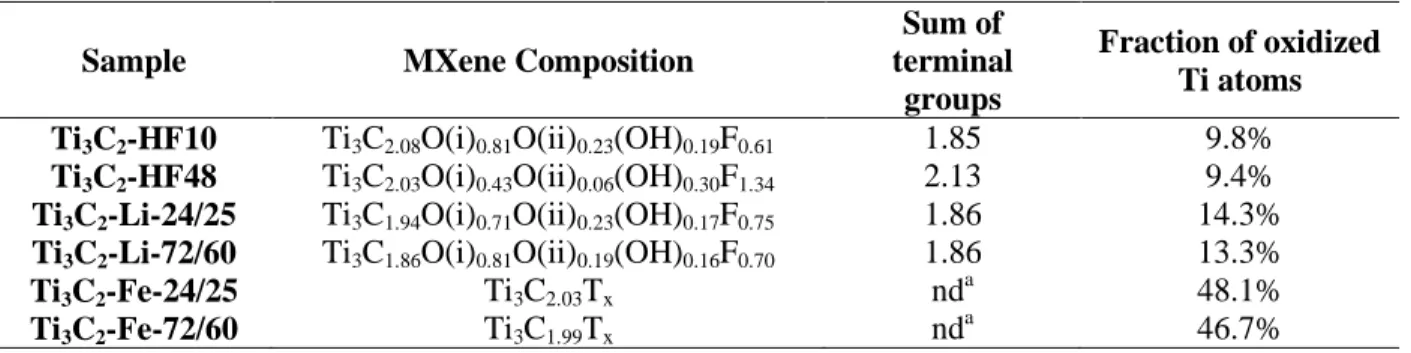
Table 3 Results of XPS quantification for all MXenes.
Sample MXene Composition
Sum of terminal
groups
Fraction of oxidized Ti atoms Ti3C2-HF10 Ti3C2.08O(i)0.81O(ii)0.23(OH)0.19F0.61 1.85 9.8%
Ti3C2-HF48 Ti3C2.03O(i)0.43O(ii)0.06(OH)0.30F1.34 2.13 9.4%
Ti3C2-Li-24/25 Ti3C1.94O(i)0.71O(ii)0.23(OH)0.17F0.75 1.86 14.3%
Ti3C2-Li-72/60 Ti3C1.86O(i)0.81O(ii)0.19(OH)0.16F0.70 1.86 13.3%
Ti3C2-Fe-24/25 Ti3C2.03Tx nd a 48.1% Ti3C2-Fe-72/60 Ti3C1.99Tx nd a 46.7% a nd =not determined
Based on our aforementioned assignments of the various XPS peaks, a quantification of the
MXene surface composition was attempted (Table 3) using the results of the fits reported in
Tables S2 to S7. To this purpose, several assumptions were made: (i) F attributed to the unknown
fluorinated phase was not considered as an integral part of the MXene, (ii) amount of F atoms
bonded to Ti atoms in the TiF3 impurity was subtracted from the C-Ti-Fx contribution at 685 eV
considering 3 F atoms for 1 Ti, the amount of Ti in TiF3 being deduced from the TiF3
contribution centered at ca. 460.0 eV in the Ti 2p region (Fig. 2), (iii) F atoms belonging to the
TiO2-xF2x moiety in the C-Ti-F contribution at 685 eV as well as adventitious O in the O 1s
region and involved in the C-Ti-(OH)x groups were neglected, (iv) the low amounts of chlorine,
Cl, atoms (Table S1) were ignored, even if some are terminal groups.
Based on these different assumptions and taking into account the fittings uncertainties (close
to 10%), the obtained results should be taken with a grain of salt. Nevertheless, the obtained
23
every case, a Ti/C ratio of 3/2 is obtained. As importantly, the global number of moles of T
groups is close to 2 as expected [48]. It is worth noting here, quantification of the terminal
groups for the FeF3-etched samples was too complicated and is thus not reported in Table 3. This
was mainly due to the high degree of oxidation of these surfaces. Indeed, the fitting of the O 1s
region was strongly impacted by the formation of oxygenated carbonaceous species caused by
the corrosive etching. The high fraction of Ti oxyfluoride complicates the quantification of the F
terminal groups since the x value in TiO2-xF2x could not be unambiguously determined.
Nevertheless, the consistent Ti/C ratio, obtained from spectral decomposition of the Ti and C
peaks indirectly confirms the validity of our peak assignments and the formation of MXenes with
this etching agent.
According to Table 3, the compositions obtained for the Ti3C2-HF10, Ti3C2-Li-24/25 and
Ti3C2-Li-72/60 samples were quite close. The F-content of the Ti3C2-HF48 composition, on the
other hand, was roughly double that of the other samples (Table 3 and Table S1). The higher
amount of F atoms in the Ti3C2-HF48 sample is not surprising given the higher F content in the
etching solution (Table 1) [6]. Somewhat surprisingly, the amount of F atoms in all Li-samples is
close to that of the Ti3C2-HF10 samples despite the fact that almost twice as much F was used to
synthesize the latter (Table 1).
The fraction of hydroxyl groups among the oxygenated species is higher in the Ti3C2-HF48
sample in comparison with Ti3C2-HF10, Ti3C2-Li-24/25 and Ti3C2-Li-72/60 samples. As
discussed below, this conclusion is confirmed by Raman spectroscopy. As already shown, the
fraction of O/OH on the MXene surface depends on pH [55]. At low pH the favoured
termination is OH; increasing the pH leads to dihydroxylation of the OH into O. Our synthesis
24
centrifugation with water (see experimental part) increase the pH until 5 leading to a partial
dihydroxylation and the formation of O terminal groups on the MXene surfaces as proposed by
Natu et al [55]. Nevertheless, the dihydroxylation for Ti3C2-HF48 sample appears to be slower.
As observed Fig. S2, after the centrifugation steps and before the washing step, water layer can
be inserted between the layers for the Ti3C2-HF10 sample which is not the case for the Ti3C2
-HF48 sample. Thus, for the latter, the dihydroxylation, involving water molecules, is disfavoured
[55]. Even if it is to a lesser extend for the Ti3C2-HF48 sample, this finding (table 3) confirms
that O is favoured as terminal group in comparison with OH in our synthesis conditions and in
agreement with studies reported by Persson et al. [49] and Hope et al. [56].
Moreover, as previously mentioned, the F terminal groups are bonded preferentially on the
A-sites [49,50]. Thus, it is not surprising that, when the amount of F terminal groups increases as in
the case of Ti3C2-HF48, a smaller fraction of O atoms are on the A-site (C-Ti-O (ii)). This result
confirms our assignation and the theoretical work of the literature [49,50].
Finally, the fraction of oxidized Ti atoms (Table 3) indicates that the MXenes prepared with
the FeF3/HCl etchant are highly surface oxidized and no significant difference was observed
between both the two samples. This result further confirms that this etching agent is more
25
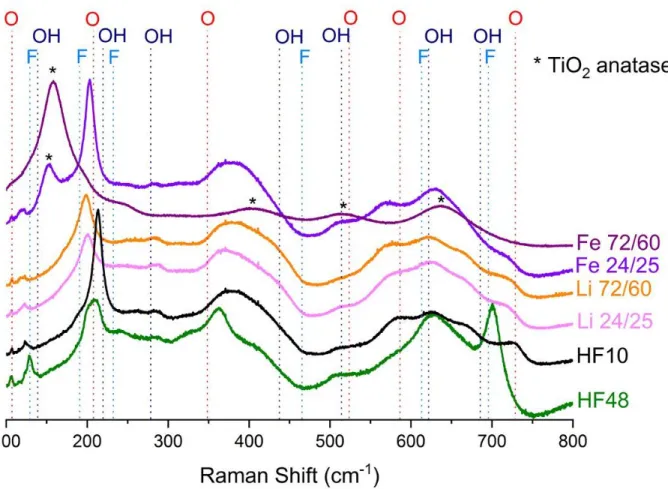
Fig. 3. Raman spectra of the as-synthesized MXenes. The spectra are shifted vertically for
clarity.
Raman spectra obtained for all samples are plotted in Fig. 3. According to the computational
study of Hu et al. [57], there are several Raman active vibrational modes in the observed range
for the three Ti3C2Tx with homogeneous terminal groups, namely Ti3C2O2, Ti3C2F2 and
Ti3C2(OH)2, and the chemical nature of the terminal groups greatly affects the vibrational
frequencies of the Raman modes. In Fig. 3, the positions of the calculated frequencies are
indicated by doted lines and marked with an O, F or OH label, respectively for Ti3C2O2, Ti3C2F2
and Ti3C2(OH)2. It can be seen that these calculated frequencies roughly match with the observed
26
formation of Ti3C2Tx MXene. Indeed, deviations observed from the calculated values may be
explained since calculations are based on Ti3C2T2 MXene with homogeneous terminations and
only considering a monosheet [57].
The intensities of the two bands at 128 and 700 cm-1,assigned to Ti3C2F2, werefound to be
relatively higher for the Ti3C2-HF48 sample than the others, confirming the higher F content in
good agreement with the XPS analyses (Table 3 and S1).
Based on the theoretical results of Hu et al. [57], the frequency associated with the
out-of-plane stretching vibration of surface Ti in bare Ti3C2 at 228 cm-1 is shifted to 218 and 208 cm-1,
respectively with -OH or -O as terminal groups and to 190 cm-1 with -F as terminal groups. The position of this band in the spectra will be therefore greatly dependent on the relative abundance
of the different terminal groups. In Fig. 3, the corresponding band is centered at about 212 cm-1 for the Ti3C2-HF10 sample. For the F-rich sample (Ti3C2-HF48), a shoulder ≈ centered at 195
cm-1 is clearly observed again consistent with the higher F content of this sample. Nevertheless, this band is also downshifted for samples prepared with the LiF/HCl etching agent, whereas the
amount of F is close to that of Ti3C2-HF10 (Table 3). Lioi et al. [58] also observed the downshift
of this band when comparing MXenes obtained using HF and LiF/HCl etching agents. They state
that small changes in the relative abundance of the various Tx groups may have a strong effect in
individual MXene sheets and therefore significantly affect the Ti-C bond lengths and
consequently Raman modes. Inter-layer species (water, cations), present in the LiF etched
samples, should also affect the electron density drawn from the Ti-C bonds resulting in
harder/softer Raman modes. This Raman band (ca. 200 cm-1) was also shown to be affected by the restacking properties of the materials [59]. Besides, we cannot exclude that Cl atoms
27
observed in small amounts in LiF and FeF3-etched samples (Table S1) may also affect this
out-of-plane stretching vibration mode in the same way as F atoms do.
The band intensity associated with the -O terminal groups (730 cm-1) increase as the HF concentration decreases indicating that more -O terminal groups are present. The intensity of
bands associated with the –OH terminal groups (622 and 285 cm-1) does not evolve significantly, however. Thus, the O/OH ratio of the Ti3C2-HF48 sample is lower than that of all other samples.
This result is also in line with the XPS study and validates both our XPS and Raman
assignments.
The Raman spectra of both samples etched with the LiF/HCl solution are similar to the ones
etched with 10% HF (Ti3C2-HF10) except for the already discussed shift of the band associated
to the out-of-plane stretching vibration of surface Ti atoms (ca. 200 cm-1). This is also in agreement with the XPS data showing no significant differences between the surface
compositions of these three samples (Table 3).
Though the XRD patterns of the Fe-samples do not show the presence of crystallized TiO2,
Raman and XPS spectroscopies clearly indicate the partial oxidation of these samples. Indeed,
the formation of anatase TiO2 (or TiO2-xF2x) can be observed in the Raman spectra (Fig. 3),
particularly for Ti3C2-Fe-72/60 sample. The Eg vibrational mode of pure anatase is at 143 cm-1
[51]. Here, that mode is shifted to 158 cm-1, a shift that could be due to the presence of F in the anatase structure [51]. This conclusion is consistent with our XPS results. The fraction of TiO 2-xF2x increases under harsher etching conditions (Ti3C2-Fe-72/60).
Referring to Fig. 3, the presence of the MXene spectral signature is clear for the Ti3C2
-Fe-24/25 material. For the visible Ti3C2-Fe-72/60 sample the intense TiO2-xF2x bands hide the
28
surface of the MXene as evidenced previously from XPS since the high fraction of TiO2-xF2x at
the surface is similar for both samples (Fig. 2 and Table 3) whereas the amount of TiO2-xF2x
observed by Raman, with a greater depth of analysis, is clearly different (Fig. 3).
Finally, a hump is also observed between 350 and 450 cm-1 for all Ti3C2Tx samples. As
reported by Hu et al [57], this can be explained by the heterogeneity of terminal groups. Indeed,
using a simplified Ti3C2O(OH) monosheet model, two Raman active modes appear at 364 and
387 cm-1 which match well with our results. We thus conclude, not unsurprisingly and in total agreement with previous work, that our MXenes have heterogeneous terminations, as observed
from XPS results. Furthermore, the intensity of these bands seems to be strongly affected by the
nature of terminal groups as the intensity of the band at ca. 364 cm-1 considerably increases with the F-content.
3.3 Micro/macrostructure characterization
The macrostructure of the MXene is also affected by the chemical composition of the etching
agent. As shown by SEM analyses (Fig. S5), using a high HF concentration (Ti3C2-HF48) leads
to multi-layers MXenes separated by large gaps (accordion-like structure) whereas at lower HF
concentrations (Ti3C2-HF10) tightly stacked sheets are formed [43]. The exfoliation process
performed using HF at high concentrations involves the formation of more macroscopic defects
and thus well-separated multi-layers MXenes [43]. This is due to the formation of H2 gas from
the reaction between Al and HF, this reaction being faster when the HF concentration increases
thus contributing to expanding the structure. SEM pictures of Li-samples (Fig. S5) show the
typical microstructure of a delaminated MXene after restacking during the filtration step [8].
29
MILD method leads to easier delaminations. Indeed, the delamination can be performed by
simply shaking the suspension.
The general microstructure of FeF3-etched samples observed by SEM is similar to that of
HF-MXene (Fig. S4). Contrary to LiF-etched samples, here the delamination is not observed by
simple manual shaking though the c parameter value is higher. Even if some flakes can be
isolated by centrifugation as indicated in our previous work [36], this method does not allow for
a facile delamination and formation of clays as in the case of LiF/HCl, probably due to surface
oxidation. Previous works showed already that the spontaneous delamination in water is only
possible with Li cations [47].
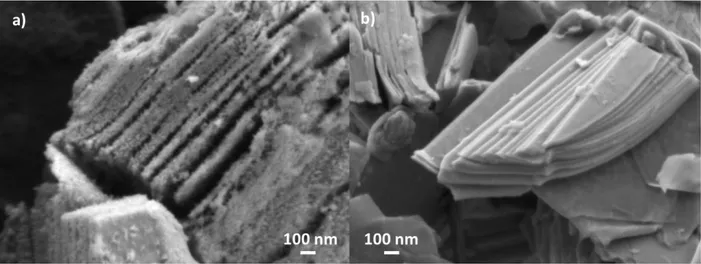
From Raman spectroscopy, we concluded that the Ti3C2-Fe-72/60 material is highly oxidized.
Using high magnification SEM images (Fig. 4) of that sample confirmed the presence of a large
number of surface nanoparticles that are presumably TiO2 anatase. Such nanoparticles are not
observed on the non-oxidized samples such as Ti3C2-HF10 (Fig. 4). The presence of these
nanoparticles results in a significant increase in the specific surface area values determined by
BET method - 75 m2 g-1 for Ti3C2-Fe-72/60, and between 2 and 15 m2 g-1 for the other samples
(Table S8).
EDS analyses were also undertaken on the different samples (Table S8). Taking into account
the uncertainties concerning the quantification of light elements, the reported results only allows
for a semi-quantitative analysis. The removal of Al in all samples deduced from ICP
measurements (Table 2) is confirmed by EDS analyses. As observed by XPS (Table 3 and S1), a
higher content of F is observed for Ti3C2-HF48 material compared to the other samples. In
agreement with the XPS and Raman analyses, no major differences in compositions are observed
30
in the MXene prepared with HCl in the etching solution is also confirmed. The O fraction in the
FeF3-etched samples is significantly higher than for other samples due to the MXene oxidation,
increasing accordingly to the fraction of TiO2-xF2x observed by Raman spectroscopy (Fig. 3). The
C fraction also increases, particularly for the Ti3C2-Fe-72/60 sample, confirming the formation of
an amorphous C phase during etching as demonstrated by XPS analysis. Titanium atoms are
indeed partly oxidized and dissolution takes place during the synthesis as stated previously,
automatically increasing the fraction of C in the sample.
Fig. 4. SEM micrograph of, a) Ti3C2-Fe-72/60 sample at high magnification showing the
formation of small nanoparticles on the surface of the MXene sheets, b) Ti3C2-HF10 sample, at
same magnification, showing the absence of nanoparticles.
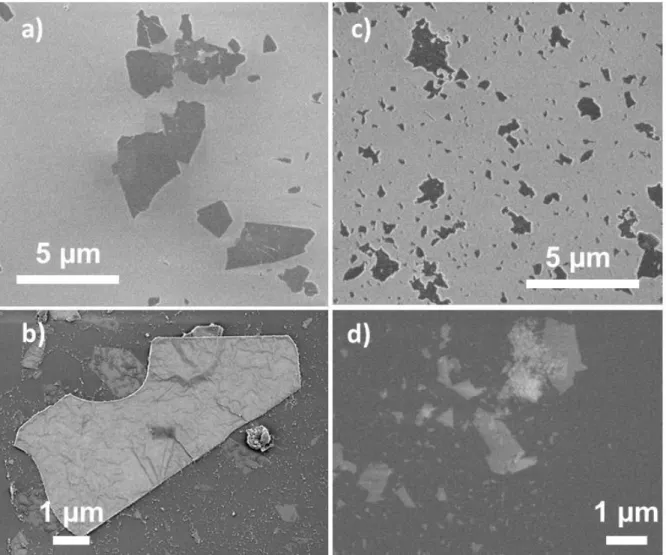
Comparing the behavior of the MXenes synthesized using the three different etching agents,
only those etched with LiF/HCl allows for a spontaneous delamination by simply manually
shaking an aqueous MXene suspension [47]. That is not say that the two LiF-etched samples
were different. To highlight a difference, the powders were dispersed in water to form a colloidal
31
images, major differences were observed, particularly concerning the lateral size of isolated
flakes (or multi-layers flakes with few sheets). Indeed, the harsher etching conditions led to
smaller flakes (with lateral sizes < 2 m) whereas the Ti3C2-Li-24/25 sample is composed of
larger flakes (most with a lateral size between 2 and 10m).
Fig. 5. Typical SEM micrographs of flakes collected from colloidal suspension of, a) and b)
Ti3C2-Li-24/25 and c) and d) Ti3C2-Li-72/60. Top: secondary electron imaging, bottom:
32
In addition to reducing the flake size, the harsh conditions (i.e. those corresponding to the
synthesis of Ti3C2-Li-72/60) led to more disorganized stacks and defective sheets as evidenced in
Fig. 6, where a TEM analysis of representative flakes is shown. Fig. 6a shows different TEM
micrographs and corresponding energy-filtered electron diffraction patterns (EFEDP) acquired
on different flakes. For most of the investigated zones (two of which are here given and labelled
zones 1 and 2) the flake size is consistent with the SEM observations. In addition, the
corresponding EFEDP evidences the disorganization of the sheets with diffraction spots arranged
over rings characteristic of in-plane flake rotation with respect to each other. This is in contrast
with zone 3, obtained in the same sample, where the flake is much larger and the EFEDP
evidences well defined spots characteristic of the hexagonal symmetry (this kind of stack is
largely in minority in this sample). This zone 3 is similar to those generally encountered in the
Ti3C2-Li-24/25 sample, prepared with soft conditions. In addition to the disorder evidenced in
the EFEDP, the C-K edge recorded in zones 1 and 2 shows a modification of the fine structure
compared to the less perturbed zone 3. As evidenced in Fig. 6b, the A peak intensity is reduced,
B peak is broadened and structures C and D are less pronounced in zones 1 and 2 compared to
the C-K edge in zone 3, which is closer to the C-K edges recorded in samples obtained under
softer etching conditions [60]. The broadening and intensity-loss observed in the fine structures
spectra collected in zones 1 and 2, which are much more representative of most of the flakes than
zone 3, is characteristic of structural disorder within the MXene sheets and evidences the effect
33
Fig. 6. [a] TEM micrographs and corresponding energy filtered electron diffraction patterns of
different stacks in Ti3C2-Li-72/60 sample (i.e. prepared in harsh conditions). [b] C-K edges
recorded on the three zones shown in (a).
3.4 Summary of the different properties adjusted by the etching conditions
Based on this study, it is clear that by varying the HF concentration in the etching agent, the
surface properties as well as surface composition can be tuned. As shown by the XPS analyses
performed on Ti3C2-HF10 and Ti3C2-HF48 samples, the amount of fluorine as terminal groups in
the MXene can thus be controlled resulting in tunable ability to insert water between sheets as
confirmed by XRD. Since -F terminal group is more hydrophobic than –OH and –O ones, this is
consistent with the higher fluorine content in Ti3C2-HF48 that strongly limits the ability to
intercalate water between sheets. This constitutes a major level in the optimization of MXenes
for applications such as electrochemical devices, water treatment, catalysis or humidity sensors.
34
concentration. So, the variation of the conditions in HF medium allow tuning the O/OH ratio as
terminal groups which can be interesting for specific applications preferentially involving one
particular speciation.
Except for the presence of Li cations as well as a little amount of Cl in the LiF-etched
MXenes, their composition is close to that of Ti3C2-HF10 sample, explaining why obtained
Raman and XPS spectra are so similar. Nevertheless, the macrostructure of these three samples is
quite different. Indeed, the Li-samples can be spontaneously dispersed and delaminated in water
contrary to Ti3C2-HF10 [47]. This is certainly due to the presence of Li ions between the sheets
whereas for Ti3C2-HF10 the washing step leads to a partial dehydration of the sample caused by
the removal of cations inserted between the sheets during the etching step, thus disabling the
delamination. As stated above, using the same initial LiF and HCl concentrations but different
synthesis conditions - soft vs. harsh - results in the formation of MXenes with comparable
compositions in general and similar terminal groups in particular (Table 3). However, when
harsher etching conditions are used, they result in the formation of structural defects and smaller
flakes. As discussed below, these defects greatly modify the surface properties of the samples.
All else being equal (temperature, duration, fluorine to MAX ratio), the FeF3/HCl etching
method leads to faster etching of Al compared to LiF/HCl etching. This method is thus of great
interest when the efficiency of the etching process is the governing parameter in the synthesis of
Ti3C2Tx materials. Moreover Li is a limited natural resource[61], whereas iron is the fourth most
abundant element in the earth’s crust, which makes it more interesting from an industrial point of view. Furthermore, FeF3/HCl etching results in Ti3C2Tx@TiO2-xF2x composite in a one-pot
synthesis. The MXene oxidation mechanism is closely related to the presence of Fe cations as Ti
35
average charge of Ti atoms in Ti3C2Tx to be ≈ 2.4 [62], then the standard potential of the
Fe3+/Fe2+ redox couple (E°Fe3+/Fe2+ = 0.77 V vs. SHE) is higher than that of Ti (E°Ti3+/Ti2+ = -0.37
V vs. SHE and E°TiO(2+)/Ti3+ = +0.19 V vs. SHE). This oxidation probably favors the exfoliation
step explaining why Al removal rate is higher compared to the samples synthesized using
LiF/HCl as etching agent; despite similar synthesis conditions are used. Combining XPS and
Raman results, it was shown that the oxidation was produced preferentially at the MXene sheet
surfaces.
In our previous work, FeF3/HCl was employed but at lower concentrations (initial F/Al
atomic ratio equal to 7) [36] and no formation of TiO2 (or TiO2-xF2x) was observed using Raman
spectroscopy. To confirm this result, a Ti3C2-Fe-72/60 sample was also synthesized in this work
with two times less FeF3 in the etching solution (initial F/Al atomic ratio = 6) (See section V of
ESI). In this case, a small amount of TiO2 (or TiO2-xF2x) is observed in the Raman spectra (Fig.
S6) compared to the other Fe-samples. Thus, by varying the synthesis parameters such as FeF3
concentration, temperature and duration, it is possible to control in a one-pot synthesis the
fraction of TiO2, more accurately, an anatase-like TiO2-xF2x structure. Taking into account that
these composites are increasingly studied for different applications such as photocatalysis [63],
sensors [13], batteries [64,65] or supercapacitors [66], our simple and one-pot synthesis allows
for the facile control of the fraction of oxidized phase. On the other hand, by combining the
positions of the XPS photopeaks and Raman bands, it seems that the formed oxidized phase is an
oxyfluoride with anatase-like structure rather than an oxide.
36
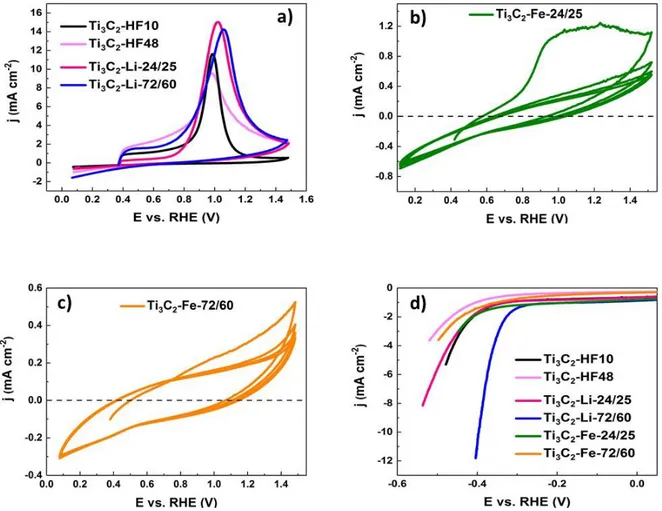
The voltammetric signatures of our MXenes were first investigated in a nitrogen-saturated 1
mol L-1 KOH electrolyte at a scan rate of 50 mV s-1. The resulting cyclic voltammograms for Ti3C2-HF10, Ti3C2-HF48, Ti3C2-Li-24/25 and Ti3C2-Li-72/60 materials are presented in Fig. 7a.
For theses samples, an irreversible oxidation peak centered at ca. 0.9 – 1.1 V vs. RHE is
observed during the positive scan of the first voltammetric cycle. In the absence of redox active
species in the electrolyte, this redox peak can be most assuredly assigned to the irreversible
oxidation of Ti atoms in direct contact with the electrolyte [67] and disappears in the following
cycles as showed for Ti3C2- HF48 sample (Figure S8). This electrochemical response was found
not to depend on the synthesis conditions since this intense oxidation peak was observed for all
MXenes except for the Fe-samples (Fig. 7b and c). Indeed, the intensity of the irreversible
oxidation peak for Ti3C2-Fe-24/25 (Fig. 7b) is much lower than those observed for the other
confirming once again that this material was partly oxidized prior to voltammetric
measurements. This decrease in intensity is even higher for Ti3C2-Fe-72/60 material (Fig. 7c),
that is to know for the most oxidized sample, showing that this methodology is well-adapted to
characterize the MXene surface oxidation. It is worth noting that the cyclic voltammograms
obtained with FeF3-etched samples have the typical I(E) behavior of materials possessing low
electronic conductivities. The high oxide content of these samples probably strongly reduces
37
Fig. 7. Cyclic voltammograms of a) Ti3C2-HF10, Ti3C2-HF48, Ti3C2-Li-24/25, Ti3C2-Li-72/60
(only the first cycle is reported here for clarity), b) Ti3C2-Fe-24/25 and c) Ti3C2-Fe-72/60
samples recorded at a scan rate of 50 mV s-1. d) HER polarization curves recorded with the different MXenes at a scan rate of 5 mV s-1. All curves are recorded in a N2 saturated 1 mol L-1
KOH electrolyte.
The activity of the different MXenes towards HER was investigated by recording a
polarization curve at a scan rate of 5 mV s-1. HER is here used as a probe to shed light on the surface chemical stated of the MXenes. Fig. 7d summarizes our results and the obtained HER
kinetic parameters are listed in Table 4. As observed, among the different studied MXenes,
38
Tafel slope (96 mV dec-1 ) are the lowest (Table 4). Focusing on the HF-etched samples, the HER activity of Ti3C2-HF10 is higher than the Ti3C2-HF48 material, the worst catalyst. These
results are in agreement with the work of Handoko et al. [6] suggesting that the HER activity of
MXene surfaces can be inhibited by the presence of terminal F atoms. The HER activity indeed
decreases with the increase of F/Ti atomic ratio (Table 3). As discussed below, the F content is
not systematically the main parameter which affects HER activity.
Focusing now on the Li-samples, Ti3C2-Li-72/60 MXene is largely better as an electrocatalyst
for HER than Ti3C2-Li-24/25 (Table 4). Taking into account the similarity between the chemical
compositions for these Li-containing samples (Table 3), this huge difference concerning HER
activity cannot be solely related to the F content. In general, the experimental determination of
the nature of the involved active site for HER is quite difficult. Nevertheless, the formation of
smaller flakes (more exposed edges and corners,…) and more structural defects (as showed by
TEM/EELS analyses) with Ti3C2-Li-72/60 sample change the nature of the active sites compared
to Ti3C2-Li-24/25 explaining the difference in HER activities. As an example, Natu et al. showed
that the charges of MXenes edges and surfaces are different [55], which can potentially drive to
difference in the –OH adsorption kinetics for HER reactions.
HER activities of the Fe-samples (Fig. 6) are also relatively low in comparison with Ti3C2
-Li-72/60 material. This is associated with both the surface oxidation and the low electronic
conductivity. This is confirmed by the very low Tafel slopes of these samples compared to other
MXenes. The lower activity of Ti3C2-Fe-72/60 compared to Ti3C2-Fe-24/25 can be ascribed to a
higher fraction of oxidized Ti atoms. The role of oxidation on HER activity is further discussed
39
Focusing now on gravimetric capacitance (see ESI part VI for methodology), it is clear that
Ti3C2-Li-24/25 sample is the most interesting among all materials with a gravimetric capacitance
of 180 F g-1 (table 4) indicating that MXene with larger flakes exhibit a higher capacitance as already reported by Peng et al. [68]. The high degree of oxidation of the FeF3-etched samples
precluded our measuring their capacitances.
To summarize, the synthesis conditions have a crucial role on electrochemical performances.
As an example, the synthesis conditions (soft and harsh) applied using the LiF/HCl etching agent
have a dramatic impact on surface properties of the resulting MXene though the chemical
compositions are very similar. Soft synthesis condition favors a higher gravimetric capacitance
by producing larger flakes containing a lower defect density. These materials can be used for
applications such as supercapacitors, whereas harsh conditions favor the production of MXenes
that are more active for the HER. The choice of the synthesis method is thus crucial and greatly
depends on the targeted application.
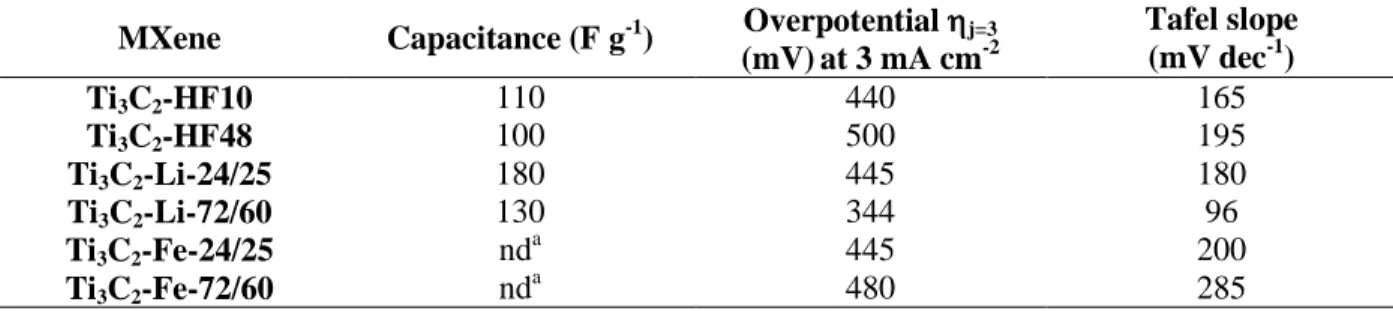
Table 4. Capacitance and HER kinetic parameters obtained with different MXenes studies
herein.
MXene Capacitance (F g-1) Overpotential j=3 (mV)at 3 mA cm-2 Tafel slope (mV dec-1) Ti3C2-HF10 110 440 165 Ti3C2-HF48 100 500 195 Ti3C2-Li-24/25 180 445 180 Ti3C2-Li-72/60 130 344 96 Ti3C2-Fe-24/25 nd a 445 200 Ti3C2-Fe-72/60 nd a 480 285 a nd =not determined
40
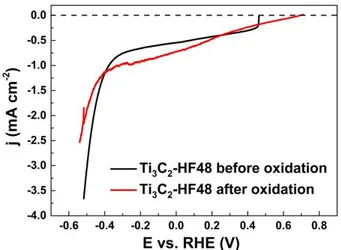
3.6 Correlation oxidation/HER/XPS
To confirm the role of surface oxidation on HER performances, the HER activity of Ti3C2
-HF48 was also measured after the irreversible surface oxidation occurring at around 1 V vs. RHE
(potential cycling from -0.6 to 1.35 V vs. RHE) and compared with HER obtained after potential
cycling from -0.6 to 0.5 V vs. RHE (Fig. 8), that not result in surface oxidation. As observed, the
irreversible oxidation process leads to a significant decrease in the activity of MXene towards
HER. Thus, oxidized MXene surfaces are not favorable for the HER.
Fig. 8. HER polarization curves recorded with Ti3C2-HF48 before and after irreversible
oxidation at a scan rate of 5 mV s-1. All curves are recorded in a N2 saturated 1 mol L-1 KOH
electrolyte.
Previous work showed that MXene surfaces are oxidation sensitive particularly under a wet
atmosphere [36,69]. This behavior was used to confirm the role of Ti oxidation on HER activity.
To further explore this aspect we studied the influence of storage conditions on MXene surface
oxidation for the Ti3C2-HF10 and Ti3C2-HF48 samples. To do so, the fractions of oxidized Ti