HAL Id: hal-01558294
https://hal.archives-ouvertes.fr/hal-01558294
Submitted on 10 Jul 2017HAL is a multi-disciplinary open access archive for the deposit and dissemination of sci-entific research documents, whether they are pub-lished or not. The documents may come from teaching and research institutions in France or abroad, or from public or private research centers.
L’archive ouverte pluridisciplinaire HAL, est destinée au dépôt et à la diffusion de documents scientifiques de niveau recherche, publiés ou non, émanant des établissements d’enseignement et de recherche français ou étrangers, des laboratoires publics ou privés.
photochemistry
Sarah Tigrine, Nathalie Carrasco, Ludovic Vettier, Guy Cernogora
To cite this version:
Sarah Tigrine, Nathalie Carrasco, Ludovic Vettier, Guy Cernogora. A microwave plasma source for VUV atmospheric photochemistry. Journal of Physics D: Applied Physics, IOP Publishing, 2016, 49, pp.395202 - 395202. �10.1088/0022-3727/49/39/395202�. �hal-01558294�
A microwave plasma source for VUV atmospheric
photochemistry
S Tigrine1,2, N Carrasco1,3, L Vettier1 and G Cernogora1
1LATMOS, Université Versailles St. Quentin, UPMC Univ. Paris 06, CNRS, 11 Bvd.
d’Alembert, 78280 Guyancourt, France,
² Synchrotron SOLEIL, l’Orme des Merisiers, St Aubin, BP 48, 91192 Gif sur Yvette Cedex, France,
3 Institut Universitaire de France, 103 Boulevard St Michel, 75005 Paris, France
E-mail : [email protected]
Abstract. Microwave plasma discharges working at low pressure are nowadays a
well-developed technique mainly used to provide radiations at different wavelengths. The aim of this work is to show that those discharges are an efficient windowless VUV photon source for planetary atmospheric photochemistry experiments. To do this, we use a surfatron-type discharge with a neon gas flow in the mbar pressure range coupled to a photochemical reactor. Working in the VUV range allows to focus on nitrogen-dominated atmospheres (λ < 100 nm). The experimental setup makes sure that no other energy sources (electrons, metastable atoms) than the VUV photons interact with the reactive medium. Neon owns two resonance lines at 73.6 and 74.3 nm which behave differently regarding the pressure or power conditions. In parallel, the VUV photon flux emitted at 73.6 nm has been experimentally estimated in different conditions of pressure and power and varies in a large range between 2×10¹³ ph/s/cm2 and 4×10¹⁴
ph/s/cm2 which is comparable to a VUV synchrotron photon flux. Our first case study is the
atmosphere of Titan and its N2-CH4 atmosphere. With this VUV source, the production of HCN
and C2N2, two major Titan compounds, is detected, ensuring the suitability of the source for
atmospheric photochemistry experiments.
PACS.
50 Physics of gases, plasmas, and electric discharges 52.70.Kz Optical (ultraviolet, visible, infrared) measurements 52.80.Pi High-frequency and RF discharges
52.80.Yr Discharges for spectral sources (including inductively coupled plasma)
1. Introduction
Microwave plasma columns are widely used this is why developing an effective source has become an important topic over the past decades. In the 1970s, Moisan et al (Moisan et al. 1974)(Moisan et al. 1975) created the first surface-wave launcher, called “surfatron”, working in the microwave range, which is an efficient and compact tool for creating long plasma columns in a wide range of pressures (from atmospheric pressure to fractions of mbar) and discharge diameters. One of the main advantages of those discharges is that they are electrodeless and then avoid pollution by metal sputtering. They are also reliable reservoirs of charged, reactive particles and radiation (Moisan & Zakrzewski 1991). The individual wavelength of these radiations depends on the gas used for the discharge. It goes from the infra-red up to the vacuum ultra-violet (VUV) range (below 200 nm) as shown by (Espinho et al. 2013)(Espinho et al. 2016) in their studies of the VUV emission of an Ar-H2 gas mixture or an helium
discharge.
The radiations are mostly used as light sources for different technical studies. For example, a low pressure Kr VUV source is used for its photoionization efficiency, as an alternative to electronic impact in mass spectrometers, in order to avoid complex fragmentation patterns (Northway et al. 2007). At
2 atmospheric pressure, surface-wave driven plasma find applications in surface treatment, as they increase the wettability of silicon (Hnilica et al. 2012).
The aim of the present work is to develop a low-pressure (mbar) microwave plasma discharge (2.45 GHz) in a noble gas used as a VUV light source for a new application: to perform laboratory simulations of the planetary atmospheric photochemistry occurring at high altitudes, where solar VUV photons are penetrating. This wavelength range is of high demand in photochemistry laboratory simulations as it permits the dissociation and/or ionization of a lot of molecules, involving molecular nitrogen, the most abundant component in the atmospheres of the Earth and of Titan, the largest satellite of Saturn, on which we will focus here. As a matter of fact, thanks to the Cassini-Huygens mission (NASA-ESA), it is known now that Titan’s atmosphere is mainly composed of N2 and CH4 for a methane concentration
between 2 and 10 %, depending on the altitude (Waite et al. 2007). The observations revealed that a complex organic chemistry takes place in this 1200 km wide atmosphere, all starting with the dissociation and ionization of the neutrals N2 and CH4 by the VUV solar radiations in the upper layers.
The fast and efficient photochemistry leads to the formation of heavy C and/or N based species, like benzene (C6H6) or pyridine (C5H5N) for example. They will then grow into aerosols that globally
surround the whole satellite on several hundreds of kilometres. All those processes make Titan a natural laboratory to witness and understand this complex organic chemistry but despite all the data collected, all the possible photochemical pathways in such a hydrocarbon nitrogen rich environment are not precisely understood.
This is why Titan’s atmospheric photochemistry experiments are of high interest. So far, the main VUV sources have been Mercury lamps at 253.65 nm (Clarke et al. 2000) or Hydrogen lamps emitting the Ly-α line at 121.6 nm which is the main source of VUV energy in the solar system (Thuillier et al. 2004). Those lamps allow to work in closed gas cells as MgF2 windows are transparent to radiations
above 110 nm and focus on the kinetics of heavy hydrocarbon formation (Ádámkovics 2003), or on the influence of benzene (C6H6) on Titan’s atmospheric chemistry (Yoon et al. 2014). Also, a gas mixture
of H2-He was used in various conditions in order to obtain an output comparable to the solar irradiance
between 115 and 170 nm (Es-sebbar et al. 2015).
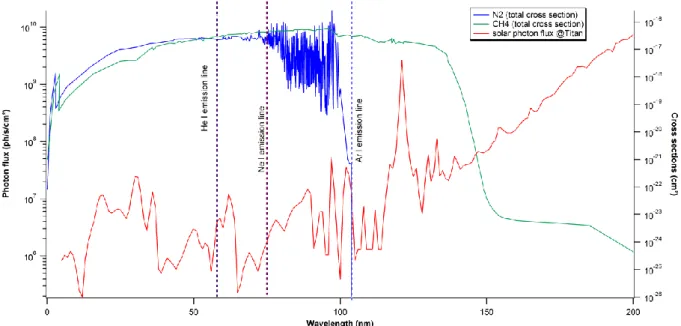
Nevertheless, molecular nitrogen requires wavelengths shorter than 100 nm in order to allow a direct photo-dissociation (Figure 1). This implies that the flows on both sides have to be balanced as the gas reactor and the VUV source would be openly coupled. So far, one way to obtain a VUV intense photon source has been coupling a gas reactor to a VUV synchrotron beamline (Imanaka & Smith 2010), (Peng et al. 2013). But even if they allow a high photon flux and a large range of specific energies (Nahon et al. 2012), they provide only a limited duration for the experimental campaigns as the demand has exponentially increased in the past decades.
A microwave plasma source for VUV atmospheric photochemistry
3 Still in the VUV range, an alternative could be commercial lamps, which exist in different types and shapes. Most of them are based on plasma discharge techniques involving noble gases. A priori, they offer several experimental qualities like a high intensity VUV beam (1015 ph/s) or a low-pressure
discharge (lower than few mbar). Nevertheless, these set-ups do not provide the flexibility needed in terms of wavelength and pressure that atmospheric photochemistry experiments demand. In fact, the Solar system offers a wide range of atmospheres which do not share the same conditions, especially regarding the pressures. The VUV source, which is to be window-less coupled to the photochemical reactor, has to suit an Earth-like stratospheric pressure as well as Titan’s ionosphere conditions. For example, the Scienta VUV 5000 focuses only on the extreme UV helium lines at 58.4 nm, 53.7 nm (He I) and 30.4 nm (He II). Or the UVS40 A2 source from Henniker Scientific is designed to be only coupled with experiments at pressures lower than a few 10-2 mbar, which makes it inappropriate for some
experimental simulations of atmospheric photochemistry.
For this kind of applications, new window-less VUV sources are required and flexible low-pressure microwave discharges could be a solution, explored in the present work. We test here the potential of the surfatron technique with our experimental setup. One of the main aims is to ensure that no other energy source than VUV radiations could reach the reactor and initiate some unwanted chemistry. The other energy sources to avoid are electrons from the plasma discharge and metastable atoms.
A complete diagnosis of the system is then performed regarding the flux of photons delivered by the VUV lamp in different conditions of pressure and power, in order to compare it with the flux of other VUV sources like synchrotron facilities. Conclusions regarding its suitability for pure atmospheric photochemistry experiments are then drawn, with the application to the upper atmosphere of Titan.
1. Experimental setup
1.1 The VUV source: a microwave-plasma discharge
The plasma discharge takes place in a 40 cm length tube in fused silica with an internal diameter of 8 mm and an external diameter of 10 mm, surrounded by a surfatron resonance cavity. The microwave power delivered by a Sairem generator goes up to 200 W. The surfatron can be moved along the quartz tube in order to settle the end of the discharge regarding the entrance of the photochemical reactor. A compressed air circulation avoids any over heat of the system. Surface temperature measurement showed that it does not go above 60°C.
Figure 1: VUV absorption cross sections of N2 (blue) and CH4 (green), and the VUV solar spectrum
at Titan (red). The dotted vertical lines show the VUV emission lines of the three rare gases He I, Ne I, Ar I.
4 The gas flow is regulated with a 0-10 sccm (cm3/min STP) range MKS mass flow controller. Moreover,
the pressure is measured with a Pfeiffer capacitor gauge, mounted upstream the surfatron device, while the main part of the plasma column is created downstream the field applicator.
Three noble gases, with intense resonance lines, can be used in order to work in the VUV range. Argon emits at 104.8 nm (no dissociation of N2), neon at 73.59 and 74.37 nm and helium at 58.4 and 53.7 nm
(ionization of both molecules) (table 1). Here, we use neon: at this energy, the dissociation and ionization of N2 are both possible (figure 1) in parallel to the ionization of CH4 (threshold at 98.52 nm).
Table 1. Resonance lines of He I, Ne I and Ar I (NIST database).
Gas Wavelength (nm) Aki (s-1)
He I 58.43; 53.70 1.8 × 10⁹ ; 5.66 × 10⁸
Ne I 73.59 ; 74.37 6.11 × 10⁸ ; 4.76 × 10⁷
Ar I 104.8 ; 106.66 5.1 × 10⁸ ; 1.19 × 10⁸
1.2 Characterization of the source with a VUV monochromator
The characterization of the VUV source is performed by coupling it directly to a VUV 1 m focal length McPherson NOVA 225 spectrometer, fitted with a 1200 gr/mm concave grating blazed at 45 nm and sensitive from 30 nm to 300 nm. The efficiency of the grating strongly varies with the wavelength and is around 6 % at 75 nm (characterized by McPherson). In order to avoid the saturation of the acquisition system but still have a good resolution, the width of the slits is set up at 75 µm for a height of 4 mm. The acquisition system consists of an Optodiode AXUV100 photodiode coupled to an amplifier. The output signal gives 1 V for 1 nA and saturates at 10 V. Moreover, according to the data sheet, at 75 nm, the photodiode responsivity is about 0.22 A/W.
The monochromator is pumped with a turbomolecular pump (Agilent TV 301) and the internal pressure is measured by a Penning gauge (Oerlikon) calibrated for air. The real pressure is obtained using a neon/air correction factor. The turbomolecular pump ensures an ultimate vacuum of 10-8 mbar inside
the monochromator; while the VUV source is also pumped by this system, through the entrance slit. At the maximum gas flow injected into the VUV source, the monochromator pressure is about 10-3 mbar.
The luminous power collected by the photodiode is related to the number of photons per second:
𝑑𝐸 𝑑𝑡 = ℎ𝑐 𝜆 × 𝑑𝑁𝑝 𝑑𝑡 (1)
where E is the energy and Np the number of collected photons.
As neon from the source is pumped in the monochromator, optical absorption happens. Then the transmission inside the monochromator at a specific pressure is given by the Beer-Lambert law:
𝐼𝑡
𝐼0= 𝑒
−𝑑×[𝑁𝑒]×𝜎 (2)
where d stands for the length of the optical path (here d = 2 m); σ is the absorption cross section (for neon and around 75 nm, σ = 9 × 10-17 cm² (Hébrard & Marty 2014)); and finally [Ne] is the neon density
linked to the pressure via the perfect gas law. In the few cm between the end of the discharge and the monochromator entrance slit, the absorption is negligible.
After weighting the number of photons per second with all those factors (responses of both the photodiode and the grating, plus the neon absorption), we divide by the surface of the exposed slits in order to obtain the photon flux (ph/s/cm²).
A microwave plasma source for VUV atmospheric photochemistry
5
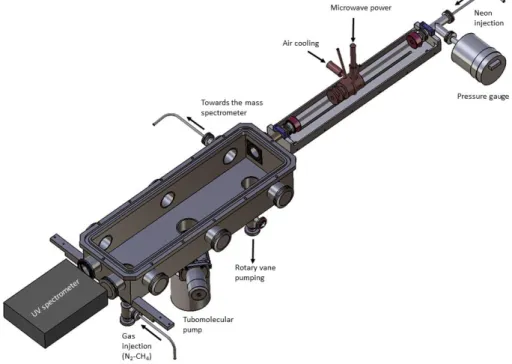
1.3 The atmospheric photoreactor (“APSIS”)
The table-top VUV source is to be coupled with a photochemical reactor named APSIS (Atmospheric Photochemistry SImulated by Surfatron) in order to carry research on planetary upper atmospheres and their interaction with the VUV solar light. The APSIS reactor is described in details in (Carrasco et al. 2013). Briefly, it is a stainless steel chamber of dimensions 500 mm x 114 mm x 92 mm where the reactive mixture is introduced via a gas inlet (figure 2). The gas mixture is chosen in order to simulate Titan’s atmospheric composition. In the present work, a 95-5% N2-CH4 mixture is injected up to 10
sccm with a MKS gas flow controller. Before each experiment, the reactor is pumped by a turbo-molecular pump down to 10-7 mbar. During the photochemistry experiments, a rotary vane pump ensures
a stable pressure on the order of 1 mbar.
Figure 2. Scheme of the photochemical reactor coupled windowless with the VUV source.
1.4 In-situ mass spectrometry on APSIS
We use mass spectrometry to monitor the neutral molecules in the experiment, with a HIDEN HPR-20 QIC mass spectrometer. The gaseous products are taken at the closest spot from the VUV source. In order to maintain a low pressure inside the mass spectrometer at 10-7 mbar, a 1 m capillary tube with an
internal diameter of 1/16e inch is used. The Multiple Ion Detection (MID) mode on the mass spectrometer is chosen, as it follows selected mass signals in function of time and shows the evolution of the intensities before and during the irradiation process.
1.5 UV optical emission spectroscopy on the coupled system “VUV source-APSIS”
In order to ensure that no neon plasma enters the APSIS reactor, and that the dissociation of nitrogen and methane only occurs from the VUV photochemistry, optical emission spectroscopy of the neon-N2
-CH4 system is performed in the UV range. A Hamamatsu spectrometer TG-UV C9404CAH is
positioned in front of the VUV source at the opposite side of the reactor (figure 2). The emitted spectra in the UV range from 200 nm to 450 nm is recorded through a quartz window.
2. Results
2.1 Validation of pure photochemistry
In order to work with a clean neon plasma, the discharge remains on for at least 20 min before starting any measurement. A VUV spectrum of the clean discharge is presented on figure 3 (black curve). The
Neon
injection
Pressure gauge
Micro-wave power
6 key parameter in our photochemistry experimental platform is the distance between the end of the discharge and the entrance of the reactor. Indeed, if the distance is too short, there is a risk that the discharge would continue inside the reactor and create a N2-CH4 plasma (electron-driven chemistry) or
that the metastable neon atoms will enter the reactor. But if the distance is too long, a photon loss is to be considered.
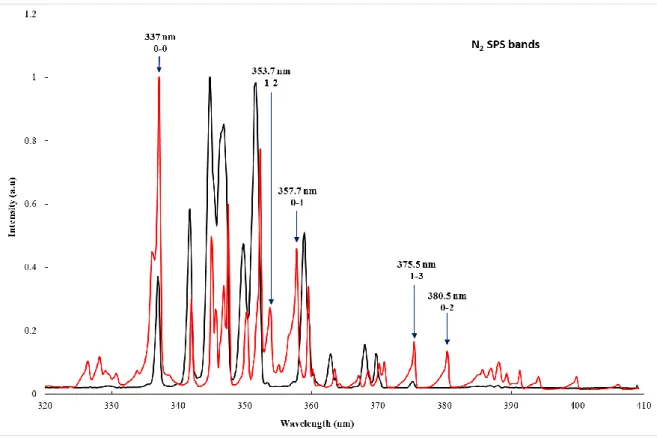
1.1.1 Preventing electron-driven chemistry. Thanks to optical emission spectroscopy, it is possible to
monitor the N2 bands of the Second Positive System (SPS), which are recognizable because degraded
to shorter wavelengths. The SPS is emitted from the 𝑁2(𝐶3 𝛱
𝑢) state which cannot be populated neither
by the 73.6 nm nor the 74.3 nm VUV line. This emission is then due to the energetic electrons of the plasma in the reactor: seeing those SPS bands means that the plasma discharge enters the photo-reactor and interacts with the N2-CH4 mixture.
First, in order to inject the maximum amount of VUV photons, the surfatron has been placed as near as possible from the entrance of the APSIS reactor. However, in this configuration, N2 bands of the SPS
appear on the spectrum (Figure 3, red curve).
It is then relevant to balance the distance from the end of the discharge and the entrance of the reactor in order to have enough photons entering the reactive medium without exciting the nitrogen-methane mixture.
A microwave plasma source for VUV atmospheric photochemistry
7 Figure 3. Typical UV spectrum of the neon discharge (black curve). Only Ne I lines listed in the NIST data base are observed. The red curve shows the same UV spectrum when plasma reaches the entrance of the reactor and the N2 SPS bands are visible (Lofthus & Krupenie 1977).
Figure 4. UV spectrum with neon in the discharge tube (blue) and neon facing APSIS filled with the N2-CH4 mixture (orange). The fact that the two spectra are exactly the same shows that N2 is not
8 For this reason, the surfatron is pushed back from the entrance of the reactor until the end of the discharge is 5 cm away from it. Figure 4 compares UV spectra of the only neon source and the APSIS reactor filled with N2-CH4 and irradiated by the surfatron source in its new position. N2 emission bands
are no more observed, even for the maximum (10 sccm) gas flow of N2-CH4. From that we can conclude
that N2 is not excited by electrons, and that there is no electron-driven chemistry in the reactor with this
position of the surfatron.
1.1.2 Preventing neon metastable atom driven chemistry. Another possible source of energy could
also be the neon metastable states 3P0
2-0 at 16.61 and 16.71 eV. Those metastable atoms are a potential
source of energy for ionizing molecular nitrogen as its ionization threshold is at 15.58 eV; this is why it is crucial to determine if they can reach the reactor. As metastable atoms are embattled in the neon flow, their diffusion characteristic time τD has to be compared with their travel time τt between the end of the
discharge and the reactor entrance.
In our experimental conditions, the depopulation is mainly done by radial diffusion to the discharge which means that the metastable atom density depends on the Bessel function of the first kind J0 (Moisan
& Pelletier 2006):
𝑛(𝑟) = 𝑛0 × 𝐽0(2.405×𝑟𝑅 ) (3)
The inverse of the diffusion characteristic time is then 1
𝜏D= 𝐷
𝛬2 where Λ, the diffusion length, equals
𝑅
2.405 where R is the radius of the tube. The neon metastable diffusion coefficient is D = 170 cm²/s at 1
Torr and 300 K (Dixon & Grant 1957). In our working conditions, (P = 1 mbar, T = 300K, R = 4mm), the diffusion time of the neon metastable atoms is 𝜏𝐷 = 1.6×10⁻⁴ s.
For a neon gas flow Q = 4sccm, the velocity is V = 1.3×10² cm/s and the travel time on this 5 cm length is τt = 4×10-² s. As τt >> 𝜏𝐷, the neon metastable atoms are destroyed before arriving to the reactive
zone.
We are now sure that the only energy input from our lamp are the VUV photons, making it fully compatible to the kind of experiments we intend to perform.
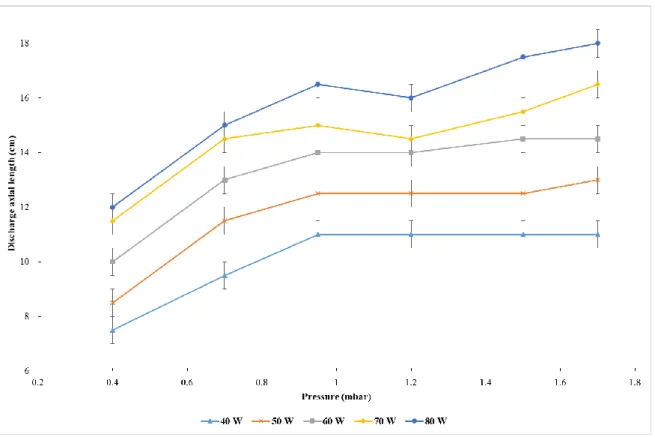
1.1.3 Discharge length. In order to increase the VUV photon flux, one can increase the microwave
power deliver to the discharge, but this will modify the discharge length, which could then enter the reactor. This explains why we measured the length of the discharge downstream the surfatron device as a function of pressure in different conditions of power (Figure 5). The length increases with the pressure. Above 1 mbar, it depends only on the microwave power with a maximum of 18 cm at a pressure of 1.7 mbar and a power of 80 W.
Then, for further use for photochemistry, we know where the surfatron must be positioned in order to have the maximum of VUV flux without any induced plasma reactions whatever the pressure and/or the power are.
A microwave plasma source for VUV atmospheric photochemistry
9
2.2 Characterization of the VUV source
In order to fully characterize the source in the VUV range, the intensities of the two neon resonant lines (Table 1) are recorded in different conditions of pressure and power for the discharge.
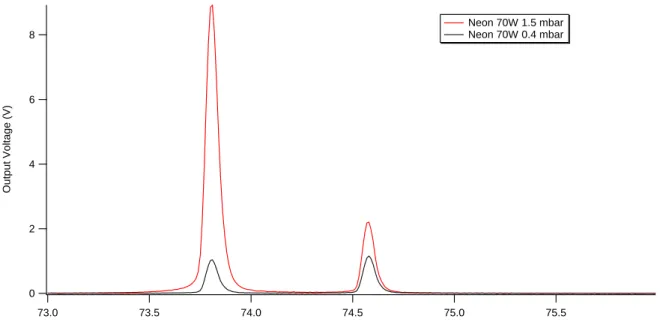
Typical spectra recorded for the two resonance lines of neon are presented on Figure 6. We notice that the two lines present different behaviours regarding the pressure, this is why we will study them separately.
In order to calculate the VUV flux emitted by the surfatron source, we need the spectral responses of both the grating and the photodetector, without forgetting the absorption of the neon present inside the monochromator as described in section 1.2.
Figure 5: Length of the neon microwave discharge (downstream the surfatron device) for different conditions of pressure and power.
10 Figure 6. The two resonant emission lines of Ne I at 73.6 and 74.3 nm at 70 W for two different pressures showing different intensity ratio between the two lines.
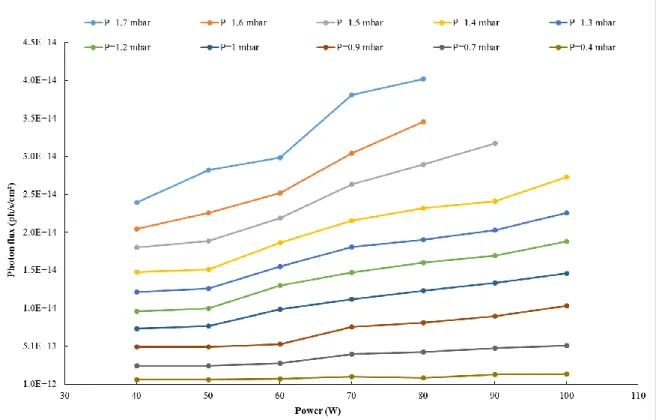
The calculations have been performed first on the 73.6 nm line for different gas pressures and microwave powers (Figure 7; Figure 8). The order of magnitude of the source photon flux is 1014 ph/s/cm², with a
maximum of 4 × 10¹⁴ ph/s/cm² (1.7 mbar and 100 W) and a minimum of 2 × 10¹³ ph/s/cm² (0.4 mbar
and 40 W). 8 6 4 2 0 Ou tp u t V o lta g e (V) 75.5 75.0 74.5 74.0 73.5 73.0 Wavelength (nm) Neon 70W 1.5 mbar Neon 70W 0.4 mbar
Figure 7. Photon flux emitted by the neon microwave discharge in different conditions of power versus the pressure. At high powers (Pw >70 W) and high pressures (P >1.5 mbar), the amplifier saturates this
A microwave plasma source for VUV atmospheric photochemistry
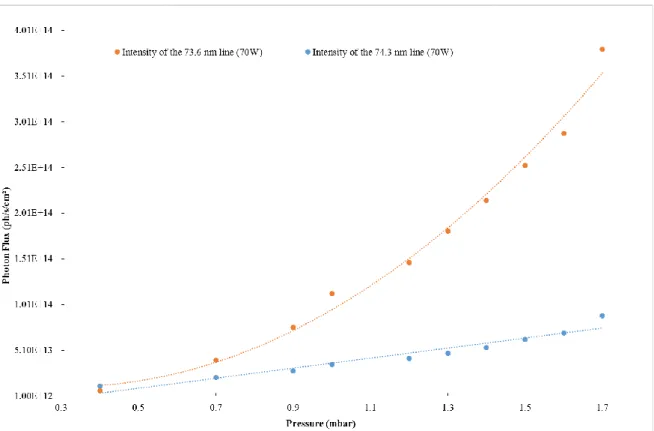
11 Figure 7 shows how the photon flux of the lamp varies versus the pressure for different values of power. It reveals a general profile of quadratic growth regarding the neon pressure as fitted on the orange curve on Figure 9.
On Figure 8, the variations of the photon flux versus the power delivered into the discharge are presented, for different values of pressures. Here, the growth looks linear.
These two trends versus the pressure and the power can be explained by a collisional radiative model. The radiative level is populated by electron collisions from the neon ground state and depopulated by line emission. The intensity of the 73.6 nm line is given by equation 4 where ne is the electron density,
[Ne] represents the neon concentration in its fundamental state,
𝜈
𝐿 is the inverse of the lifetime of the radiative level and k an excitation coefficient function of the electronic temperature:𝐼(73.6 𝑛𝑚) ∝𝑛𝑒[𝑁𝑒]𝑘(𝑇𝑒)
𝜈𝐿 (4)
In our pressure range, we assume that the electron energy remains practically constant which means that the ionization degree is supposed to stay constant as well. For a given power, raising the gas pressure would then directly increase the neon density [Ne] but also the electron density ne which explains the
quadratic law of the 73.6 nm line intensity. Moreover, at a fixed pressure, increasing the delivered power would here have a linear impact on the electron density ne, while the electronic temperature Te and the
neon concentration remain constant.
We can now focus on the evolution of the 74.3 nm line.
When the 74.3 nm photon flux is plotted versus the pressure for an arbitrary power of 70 W, it looks like it does not follow the same quadratic trend as the 73.6 nm one (Figure 9). In fact, its intensity varies very linearly with the pressure which means that another phenomenon counterbalances the expected quadratic rise of the photon flux.
Figure 8. Photon flux emitted by the neon microwave discharge in different conditions of pressure versus the power.
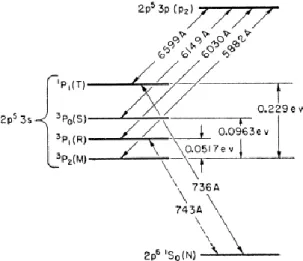
12 In addition to the depopulation of this energy level by radiative photon emission, one lead is to involve a quenching effect. The lifetime of the radiative level 3P
1, that emits the 74.3 nm line, was measured by
(Phelps 1959) in parallel to the two metastable states 3P
2 and 3P0 (Figure 10). These lifetimes are quite
similar (few ms). As the 74.3 nm line is resonant, its level 3P
1 is re-populated and its density is on the
same order of magnitude than the metastable states as (Ricard et al. 1988) has measured in a neon microwave discharge.
The quenching coefficient of the 3P
1 radiative level (at 16.67 eV) due to the transfer towards the 3P2
metastable state, is ku = 4.2×10⁻¹⁴ cm3/s (Phelps 1959). The efficiency of this quenching is related to the
small energy gap of 5.17×10⁻² eV between those two states. After collision, this energy is shared
between the two atoms and corresponds to a temperature of approximately 300 K, which is more or less the gas temperature in the discharge.
Equation (5) gives the intensity of the 74.3 nm line taking into account this potential quenching effect. In this equation,
𝜈
𝐿 corresponds to the inverse of the 3P1 level lifetime. Then, the quenching seems to be
dominant here, this is why the 74.3 nm line intensity increases linearly with the electron density and thus the pressure.
𝐼(74.3 𝑛𝑚) ∝ 𝑛𝑒[𝑁𝑒]𝑘(𝑇𝑒)
𝜈𝐿+ 𝑘𝑄[𝑁𝑒] (5)
Figure 9. Compared photon flux evolution, in function of the pressure, of the two neon emission lines at 73.6 and 74.3 nm for an arbitrary given power of 70 W and their quadratic and linear fits (respectively).
A microwave plasma source for VUV atmospheric photochemistry
13 For the 73.6 nm line, which corresponds to the 1P
1 level, the quenching is less efficient, because the
transfer to the 3P
0 metastable state presents a higher energy gap of 0.133 eV i.e a temperature of 770 K
for each atom, too hot for our experimental conditions. This level is then mainly depopulated by radiative transfer.
To conclude, the pressure at which we are working will determine which line(s) will contribute to our photochemistry experiment. For high pressures (P > 0.7 mbar), the radiative emission from the 73.6 nm line is clearly dominant compared to the steady contribution of the 74.3 nm one. However, when going low in pressure the contribution of both lines have to be taken into account.
2.3 First photochemistry experiment
When the source is coupled to the APSIS reactor, an N2-CH4 mixture (95% N2, 5% CH4) is injected.
First, 4 sccm of neon are injected inside the discharge tube, which corresponds to a discharge pressure P = 1.3 mbar. In a second time, in order not to contaminate the discharge, we inject 2 sccm of N2-CH4
in APSIS for a pressure of 0.9 mbar. This neon flow permits a relevant photon flux for the VUV source but also prevent the reactive N2-CH4 mixture from entering the discharge tube, this is why we chose it
for our first photochemistry experiment. The power delivered to the discharge is Pw = 80 W which
corresponds to a photon flux of 1.9×10¹⁴ ph/s/cm² or 0.95×10¹⁴ ph/s for the tube section of 0.5 cm².
Two effects have to be monitored by mass spectrometry: first, if the reactive signals are getting lower through the experiment, as it would mean that there is an effective consumption due to the photon interaction; and, in a second time, the signals of some hydrocarbon and/or N-bearing species (Titan-like molecules) are followed in the expectation of seeing a production. Here, we focus on the mass m/z = 15 in order to represent the CH4 reactive, through its CH3+ fragment, because the real CH4 mass m/z = 16
can overlap multiple species fragments. In addition, we look at some Titan-like molecules: m/z = 27 for Figure 10. Gotrian diagram of the neon energy levels taken from (Phelps 1959)
14 HCN and m/z = 52 for C2N2. On Figure 11, the red dotted line marks the moment when the VUV source
is turned ON. The signals of the selected products immediately start to increase, while the m/z = 15 signal decreases. After approximately 20 minutes, a quasi-stationary state is reached for the products. The presence of those molecules highlights the incorporation of both C and N atoms coming from the expected dissociation of N2 and CH4. Methane has been identified as a key reactant to initiate efficient
organic growth, in contrast to the other major form of carbon commonly found in planetary atmospheres, carbon dioxide CO2. However, methane chemistry leads to the only production of complex hydrocarbon
molecules, with no heavy heteroatoms of interest for prebiotic chemistry such as nitrogen (Raulin et al. 2012). N2 photolysis leads to reactive forms of nitrogen, atomic or ionized, which react with
hydrocarbons to produce nitrogen containing organic compounds. These nitrogen containing species have a strong interest for prebiotic chemistry (Dutuit et al. 2013). The most abundant gas-phase nitrogen-bearing products in Titan atmosphere are nitriles molecules (R-CN) as the HCN and C2N2 molecules
that we found in our experiment. The goal of the photochemistry experiment is then achieved, which ends to validate the suitability of the VUV source.
3. DISCUSSION
For our atmospheric applications, we compare those data to the solar flux. As a matter of fact, at Titan the solar flux is of 107 ph/s/cm² at 75 nm. This means that our N
2-CH4 reactive medium receives
approximately 107 more 75 nm photons making the chemical reactions more efficient in terms of
kinetics.
It is interesting to compare the photon flux numbers to the ones of the VUV DESIRS beamline at the synchrotron SOLEIL (France) which offers a wide energy range between 5 and 40 eV (or 31 to 248 nm). At approximately 17 eV (~75 nm) and for a resolving power of 1000, between 7×10¹² ph/s/cm² for a 4
mm × 8 mm spot and 1016 ph/s/cm² for a 200 µm×100 µm spot are delivered (Nahon et al. 2012).
Despite providing only one specific wavelength at a time, our source is then competitive to a VUV Figure 11. Time-monitoring mass spectrum in MID mode following the consumption of the reactive CH4 (top) and the production of the HCN and C2N2 molecules (bottom). The red dotted lines mark
A microwave plasma source for VUV atmospheric photochemistry
15 synchrotron beamline regarding the photon flux as it goes from 2 × 10¹³ph/s/cm² up to 4 × 10¹⁴ ph/s/cm².
Regarding the pressures, the one in the photochemical reactor is higher than in Titan’s upper atmosphere but this prevents any undesired wall effect (Carrasco et al. 2013). Moreover, our setup does not requires a differential pumping system between the source and the 1 mbar reactor; which is unavoidable at a synchrotron beamline where the source is under ultra-high vacuum at 10-8 mbar.
4. Conclusion
So, in conclusion, VUV plasma source based on surfatron-driven microwave discharges have proven to be an efficient and reliable tool for VUV atmospheric photochemistry experiments working at low pressure. For the ones using neon, it has been demonstrated here that the only energy source injected inside the reactive medium is the VUV photons from its two resonant lines (73.6 and 74.3 nm). Other sources are indeed possible (neon metastable atoms and electrons from the discharge) but the system has been adapted so that they will not disturb the desired pure photochemistry. In this case, the key parameter appears to be the distance between the end of the discharge and the entrance of the photochemical reactor. Also, always for neon, the behaviours of the two resonant wavelengths have been investigated in order to characterize their contribution in several conditions of pressure and power. The 73.6 nm line is largely dominant in our working conditions, but its intensity decreases with the pressure (quadratic law) and the power (linear law). This behaviour is different from the 74.3 nm line which remains quite stable whatever the pressure or the power are, possibly because of a quenching effect. It results that at low pressure (P < 0.7 mbar) the 74.3 nm one becomes dominant. To further investigate these relative intensities, a complete modelling of the discharge in our conditions taking into account the electron energy distribution function would be required. In fact, according to (Zissis & Damelincourt 1999) and their model with a 10 Torr DC discharge, the 74.3 nm line has a higher intensity than the 73.6 nm one, which is not in agreement with our experimental results.
Moreover, at 73.6 nm, the order of magnitude for the photon flux is 1014 ph/s/cm², which seems largely
comparable to a VUV synchrotron beamline at specific wavelength. The working conditions of the surfatron-based VUV source are quite flexible (regarding the pressures and power), allowing the photon flux to vary from 2 × 10¹³ ph/s/cm² up to 4 × 10¹⁴ ph/s/cm² and offer measurable photochemistry results.
Our new setup, without any window separating the source and the photoreactor, can change the way atmospheric photochemistry experiments have been performed so far, especially for the ones focusing of nitrogen-dominated atmospheres such as the Earth, the Early Earth, Titan or Pluto.
More specifically, our setup showed its ability to simulate the formation of nitriles in Titan’s atmosphere. Those are not correctly predicted by the current photochemical models (Loison et al. 2015). Even the simplest and most abundant nitrile, HCN, is found to be predicted by neutral photochemistry with concentrations three to ten times larger than measured by the Cassini space mission (Hébrard et al. 2012). Such disagreements between model predictions and observations reveal a poor knowledge of the chemistry involving nitrile in general and HCN in particular. Without the constraint of adapting the system to high pressure gradients between the source and the reactor or the low availability of synchrotron beamlines, our experiment will provide the opportunity to explore the chemistry of nitriles and improve our knowledge in this area.
5. Acknowledgments.
S. Tigrine would like to thank the IDEX Paris Saclay for her Phd thesis grant and N. Carrasco thanks the ERC Starting Grant PRIMCHEM, grant agreement n°636829. The Centre National d’Etudes Spatiales (CNES) supported the design of the APSIS reactor. The characterization of the VUV source has been possible thanks to the monochromator available at the Plateforme d’Integration et de Tests (PIT) at the Observatoire de Versailles Saint Quentin (OVSQ). All the authors also wish to thank Dr L. Nahon for his kind support and advices.
6. References
16 laboratory measurements. Journal of Geophysical Research, 108(E8), p.5092. Available at: http://doi.wiley.com/10.1029/2002JE002028.
Anon, NIST Database. Available at: http://physics.nist.gov/PhysRefData/ASD/lines_form.html. Carrasco, N. et al., 2013. VUV photochemistry simulation of planetary upper atmosphere using
synchrotron radiation. Journal of Synchrotron Radiation, 20(4), pp.587–589.
Clarke, D.W., Joseph, J.C. & Ferris, J.P., 2000. The Design and Use of a Photochemical Flow Reactor: A LaboratoryStudy of the Atmospheric Chemistry of Cyanoacetylene on Titan. Icarus, 147, pp.282–291.
Dixon, J.R. & Grant, F.A., 1957. Decay of the triplet p levels of neon. Physical Review, 107(1), p.118. Dutuit, O. et al., 2013. Critical review of N, N +, N + 2, N ++, and N++ 2 main production processes
and reactions of relevance to Titan’s atmosphere. The Astrophysical Journal Supplement Series,
204(2),p.20.Available at:
http://stacks.iop.org/0067-0049/204/i=2/a=20?key=crossref.23de8c3395d21023ed686fde089380fb.
Espinho, S. et al., 2016. Extreme ultraviolet radiation emitted by helium microwave driven plasmas.
Journal of Applied Physics, 119(24), p.243305.
Espinho, S. et al., 2013. Vacuum ultraviolet emission from microwave Ar-H2 plasmas. Applied Physics
Letters, 102(11), pp.1–5. Available at :
http://scitation.aip.org/content/aip/journal/apl/102/11/10.1063/1.4796134.
Es-sebbar, E. et al., 2015. Optimization of a Solar Simulator for Planetary-Photochemical Studies. The
Astrophysical Journal Supplement Series, 218(2), p.19. Available at:
http://stacks.iop.org/0067-0049/218/i=2/a=19?key=crossref.2aa362460a105932a493d88f955dbbb6.
Hébrard, E. et al., 2012. Neutral production of hydrogen isocyanide (HNC) and hydrogen cyanide (HCN) in Titan’s upper atmosphere. Astronomy & Astrophysics, 541, p.A21.
Hébrard, E. & Marty, B., 2014. Coupled noble gas-hydrocarbon evolution of the early Earth atmosphere upon solar UV irradiation. Earth and Planetary Science Letters, 385, pp.40–48. Available at: http://dx.doi.org/10.1016/j.epsl.2013.10.022.
Hnilica, J., Kudrle, V. & Potocnakova, L., 2012. Surface treatment by atmospheric-pressure surfatron jet. IEEE Transactions on Plasma Science, 40(11 PART1), pp.2925–2930.
Imanaka, H. & Smith, M.A., 2010. Formation of nitrogenated organic aerosols in the Titan upper atmosphere: SI. Proceedings of the National Academy of Sciences of the United States of America, 107(28), pp.12423–8. Available at: http://www.pnas.org/content/107/28/12423.short.
Lofthus, A. & Krupenie, P.H., 1977. The spectrum of molecular nitrogen. Journal of physical and
chemical reference Data, 6(1), pp.113–307.
Loison, J.C. et al., 2015. The neutral photochemistry of nitriles, amines and imines in the atmosphere of Titan. Icarus, 247, pp.218–247. Available at: http://dx.doi.org/10.1016/j.icarus.2014.09.039. Moisan, M., Beaudry, C. & Lepprince, P., 1974. A new HF device for the production of long plasma
columns at a high electron density. Physics Letters A, 50(2), pp.125–126. Available at: http://www.sciencedirect.com/science/article/pii/0375960174909037.
Moisan, M., Beaudry, C. & Leprince, P., 1975. A Small Microwave Plasma Source for Long Column Production without Magnetic Field. IEEE Transactions on Plasma Science, 3(2), pp.55–59. Moisan, M. & Pelletier, J., 2006. Physique des plasmas collisionnels (Application aux dcharges hautes
frquences)., EDP sciences.
A microwave plasma source for VUV atmospheric photochemistry
17 surface waves. Journal of Physics D: Applied Physics, 24(7), p.1025. Available at: http://stacks.iop.org/0022-3727/24/i=7/a=001.
Nahon, L. et al., 2012. DESIRS: A state-of-the-art VUV beamline featuring high resolution and variable polarization for spectroscopy and dichroism at SOLEIL. Journal of Synchrotron Radiation, 19(4), pp.508–520.
Northway, M.J. et al., 2007. Demonstration of a VUV Lamp Photoionization Source for Improved Organic Speciation in an Aerosol Mass Spectrometer. Aerosol Science and Technology, 41(9), pp.828–839. Available at: http://www.tandfonline.com/doi/abs/10.1080/02786820701496587. Peng, Z. et al., 2013. Titan’s atmosphere simulation experiment using continuum UV-VUV synchrotron
radiation. Journal of Geophysical Research: Planets, 118(4), pp.778–788. Available at: http://dx.doi.org/10.1002/jgre.20064.
Phelps, A. V., 1959. Diffusion, de-excitation, and three-body collision coefficients for excited neon atoms. Physical Review, 114(4), pp.1011–1025.
Raulin, F. et al., 2012. Prebiotic-like chemistry on Titan. Chemical Society Reviews, 41(16), pp.5380– 5393. Available at: http://dx.doi.org/10.1039/C2CS35014A.
Ricard, A. et al., 1988. Production of Metastable and Resonant Atoms in Rare-Gas (He, Ne, Ar) Radio-Frequency and Microwave-Sustained Discharges. Canadian Journal of Physics, 66(8), pp.740– 748. Available at: <Go to ISI>://A1988R027400015.
Thuillier, G. et al., 2004. Solar irradiance reference spectra for two solar active levels. Advances in
Space Research, 34(2), pp.256–261.
Waite, J.H. et al., 2007. The process of tholin formation in Titan’s upper atmosphere. Science (New
York, N.Y.), 316(5826), pp.870–875. Available at:
http://www.ncbi.nlm.nih.gov/pubmed/17495166\nhttp://www.sciencemag.org/cgi/doi/10.1126/sc ience.1139727.
Yoon, Y.H. et al., 2014. The role of benzene photolysis in Titan haze formation. Icarus, 233, pp.233– 241. Available at: http://dx.doi.org/10.1016/j.icarus.2014.02.006.
Zissis, G. & Damelincourt, J.J., 1999. Influence du mode d’alimentation sur la production du rayonnement VUV des raies de résonance de Ne dans une décharge électrique à basse pression. Le