M
Maassssaacchhuusseettttss IInnssttiittuuttee ooff T
Teecchhnnoollooggyy
E
Ennggiinneeeerriinngg SSyysstteem
mss D
Diivviissiioonn
Working Paper Series
ESD-WP-2009-01
D
OES
G
EOGRAPHIC
C
LUSTERING
S
TILL
B
ENEFIT
H
IGH
T
ECH
N
EW
V
ENTURES
?
T
HE
C
ASE OF THE
C
AMBRIDGE
/B
OSTON
B
IOTECH
C
LUSTER
Thomas J. Allen
1, Ornit Raz
2, and Peter Gloor
31MIT Engineering Systems Division
tallen@mit.edu
2ESD Research Affiliate
ornit@mit.edu
3MIT Center for Collective Intelligence
pgloor@mit.edu
1
Does Geographic Clustering Still Benefit High Tech New
Ventures?
The Case of the Cambridge/Boston Biotech Cluster
Thomas J. AllenOrnit Raz Peter Gloor
ABSTRACT:
An empirical study of scientific communication among biotechnology companies supports the belief that geographic clustering does produce increased scientific exchange among companies. A comparison of companies within a constrained geographic area with those more dispersed shows a significantly higher level of scientific communication among the former. Scientific communication declines rapidly with plupical separation.
Critical of the formation of cluster – based scientific communication networks is the presence of both universities and large firms from the same industry.
2 ACKNOWLEDGMENTS:
The authors would like to acknowledge the support, both financially and in terms of
knowledge and support of the MIT Sloan School Entrepreneurship Center. Without their help and encouragement, this research would have been impossible to conduct.
We must also acknowledge and thank the many companies and scientists, who provided us with data. There are too many for individual acknowledgements, but thank you all!
3
INTRODUCTION
In this age of ubiquitous broadband connectivity, one might expect that the effect of separation distance on communication might have disappeared or at least be
diminished.
If this is true, then one of its effects would be to disarm the arguments for similar firms, especially those newly formed and technology-based to cluster geographically. Now there are many arguments for the benefits of geographic clustering, not the least of which is that a concentration of firms will attract resources, particularly of the human kind into an area. Still, the potential for synergy among like firms is
considered a strong factor for locating in what often becomes a high rent district. It is widely believed that propinquity will stimulate communication and scientific
exchange among firms, especially among small firms formed on the basis of a common technology. This is one of the basic premises supporting the argument for the geographic clustering of newly-formed high technology firms (Powell et. al, 1996). Extensive research in recent years has demonstrated economic benefits for firms sharing a common technology within the same geographic cluster. Researchers identify different benefits to be derived from clustering. It will be easier to attract specialized staff, because the qualified pool of applicants is much larger. It is also easier to find venture capital, suppliers, and support services within a cluster (Saxenian, 2003). Claims have also been made for the synergistic benefits of firms sharing scientific knowledge, especially if there are university laboratories near the cluster (Saxenian, 2003).
Several studies have inferred inter-firm communication from the evidence of co-publishing and co-patenting across firms, (Schilling & Phelps, 2005; Porter, Powell & Porter, Whittington & Powell, 2007). This is certainly a valid and effective way of detecting inter-firm communication, however a good amount of scientific exchange may occur that does not result in such products and does not therefore appear in such publicly accessible records. This less formal scientific exchange across firms while resulting in a patent or paper may still produce value for the communicating
4
Of course, the arguments for communication being related to proximity, in other contexts have been around for a long time. Allen (Allen and Henn, 2006), for example, has shown the probability of regular technical communication among engineers to decline as the inverse square of the distance between their work stations. Of course, this decline was predicated on the need for face to face contact. So it does nothing to dispel the belief that modern media have diminished that need. This is in spite of the fact, that Hauptman and Allen (1987) showed face-to-face to be the preferred medium for complex or abstract messages, such as those typifying scientific communication. We are now in a new millennium and their work is more than twenty years old. Technology has advanced since their time and, probably more importantly, a new generation of scientists, more at home with modern media, has arrived on the scene. So today we may find less need for companies to cluster geographically. Scientists can potentially communicate effectively across firms through media other than face to face.
Many contemporary observers are now telling us that the day has arrived when we can forget about distance in its effect on communication. In fact, an eminent economist, Frances Cairncross has declared (in the title of her book) that distance is dead, "…new communications technologies are rapidly obliterating distance as a relevant factor in how we conduct our business and personal lives…" (Cairncross, 2001).
Does Distance Really No Longer Matter?
If Cairncross and others are really correct, there is no longer a rationale for the geographic clustering of new venture firms. Therefore one of our purposes in this research is to measure the effects of geographic proximity on communication among firms. Allen’s work is both dated and based upon the study of communication among engineers and scientific all working within single organizations. A question remains whether Allen’s observations carry through to communication among scientists in separate firms and living in a new millennium. The availability of an already existing biotechnology cluster in parts of Cambridge and Boston, Massachusetts provides a convenient opportunity to test this question.
5
This biotechnology cluster developed adjacent to MIT in Cambridge, Massachusetts. This so-called ‘cluster’ of mostly newly-formed biotechnology firms has come about over the past 20 to 30 years and continues to grow. Depending upon one’s definition of what a biotech firm is, the number can range from 80 to over 200 firms. The Massachusetts Biotechnology Council, an industry trade association lists over 500 companies as members. We will be a bit more conservative and restrict our selection on the basis of location and the nature of the firm’s principal activity. We thus end up with fewer than 100 companies. Nevertheless, this is a sufficient size for a
meaningful study.
Our Basic Hypothesis:
When firms locate near one another a number of factors potentially influencing communication come into play. First of all, formal intentional communication is easier. Walking across the street is certainly easier than traveling a greater distance by car or plane. Informal communication is also more likely due to chance
encounters. Finally, and influencing chance encounters, is the use of common facilities and locations such as restaurants, coffee shops, fitness centers, etc. As far as we know, measurement similar to what Allen and his colleagues did for person-to-person communication has never been made for inter-firm communication. However, we see no reason that such communication would not be negatively
affected by physical distance. We will in several ways test that hypothesis in this paper:
First we will ask whether those firms located within the geographic bounds of the cluster communicate more themselves and show greater centrality in the
communication network among organizations than do firms in the general region but outside the geographically defined boundaries. Then we will test whether the total amount of scientific communication reported by any organization with other organizations in the study will decline with the mean geographic distance between that organization and those other organizations.
6
Research Method The Geographic Cluster
The geographic extent of the cluster is defined through the use of postal zones (Zip Codes). We choose these on the basis of the concentration of firms shown in the MIT Sloan School of Management Entrepreneurship Center’s map of the location of firms (Figure 1).
Some of these postal zones cover part of Cambridge and others were in the City of Boston. They were generally in the vicinity of Harvard University, MIT, Boston University or Harvard Medical School. Organizations located outside of these regions will be employed as a control group.
Figure 1 A Street Map of Cambridge and Boston, Massachusetts Showing the Locations of Biotech Companies. (Courtesy of MIT Sloan School of Management Entrepreneurship Center).
7
Biotechnology Companies
We were able to create an accurate listing of firms with the kind assistance of the Massachusetts Biotechnology Council and the MIT Entrepreneurship Center. We compiled a database listing of Boston’s’ biotechnology firms, pharmaceutical firms, hospitals and universities. Around 90 firms, hospitals and universities are located within the geographic cluster (Boston and Cambridge) while another 100 firms are located in a variety of suburbs. In order to focus our attention onto those firms working on human therapeuticapplications of biologically-derived pharmaceuticals, we eliminated all companies that were in the agricultural, veterinary, and
environmental products and services fields from the initial listings. We also
eliminated those with a primary focus on diagnostics as opposed to therapeutics. This left us with a final sample of around 70 firms. Of these, we received data from 401
companies. In each of the cooperating companies, we select a random listing of approximately ten percent2of their bench-level scientists. The chosen scientists must have at least a PhD or MD level of education and be actively engaged in research.
Big Pharma
A number of ‘Big Pharma’ or large broadly-based traditional pharmaceutical firms have recently located research operations in the Cambridge/Boston area. The goal of these larger firms is undoubtedly to tap into the scientific communication network that may exist among the smaller, newly-formed firms. Their longer-term goal is probably to acquire new technology and products through licensing from or acquisition of the firms owning the intellectual property. The large pharmaceutical firms are also included in our sample, to determine the degree to which they are successful in attaining this goal3.
1 The failure to reach all 70 companies is not due to low response from the companies. In fact, only one company
declined to participate. It was instead due to our inability to reach all 70. This, in turn, was due to a lack of resources and time. There were only two of us working at that point in the study.
2 In companies with fewer than 10 scientists, we sample all of those engaged in bench level research. Cooperation
is, of course, voluntary and the overall research plan has been reviewed and approved by the MIT Committee on the Use of Human Experimental Subjects.
3 While the presence of the larger firms in many ways is a benefit to the startups, since they bring resources in the
8
A Control Group
Many of the firms, from which we collected data, are located outside of our selected postal zones. These more distant firms provide a convenient control group for comparison with the experimental group located within the selected postal zones.
Universities
There are five large research-based universities located within the selected postal codes. These are included in the study in a less direct way. Instead of asking
scientists in the universities to report their communications, we rely on the reports of those in firms, who communicate with university scientists. Our reasoning for this is nothing more complex than ease of data collection. The initial phase of collecting data only on communication will be followed by a web survey in which we will seek further information on the exact university laboratories with which communication took place, the origins of the contact, etc. In looking at the universities, we hope to find the degree to which firms originating from these universities retain their
connection with their ‘mother’ organizations as well as the degree to which firms born elsewhere are able to develop relations with universities within the region.
Measuring the Structure of Communication Networks; A Web-based Research Method
As noted before, many current studies rely upon patent and publication databases and therefore are unable to detect communication that while significant may not result in such products. To capture this type of communication, we adapted a tool that we had previously used in the study of communication among individual scientists within organizations. In addition to being sensitive enough to capture much of this
additional communication the web-based tool is also easy to use and is able to sense the dynamic aspect of the communication network as it evolves.
light. One entrepreneur described the relationship of firms such as his with ‘Big Pharma’ as “…a bunch of monkeys playing with gorillas”. He was very concerned with protecting his intellectual property or at least getting what he considered a fair price for it.
9
An email message with a link to a web page is sent once each week to each scientist. The web page contains a list of the names of the biotech/ pharmaceutical
organizations (including universities and hospitals) in the area. An example is shown in Figure 2. A scientist has merely to open the page and by mouse-click indicate which organizations (if any) that scientist had contact with on that particular day. This simple exercise, which can be completed in one minute or less, is then repeated on randomly chosen days, approximately once per week for a period of six months. The results collected with this tool provide a measure of the pattern of communication among the organizations and this can be related to measures of success.
The software tool we use to analyze the network is called Condor4. Condor reveals the evolution of interaction patterns in social networks. It provides an environment for the visual identification and analysis of the dynamics of communication in social spaces5. (Gloor, 2006).
4 Formerly TeCFlow.
5 The framework is based on a multi-year research project on Collaborative Knowledge Networks by a global
group of universities under the leadership of the MIT Center for Collective Intelligence and the Center for Digital Strategies at the Dartmouth Tuck School of Management (see http://www.ickn.org/ickndemo/).
10
Figure 2 An Example of the Structure of the Web Page Used in Collecting Communication Data.
Data Analysis
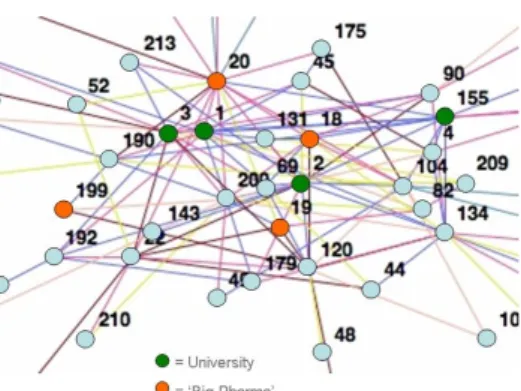
The first step in our data analysis is to plot the network of communication among scientists in the organizations in our sample (Figure 3). In this plot, each organization is represented as a network node. Pairs of nodes are connected if there is any
communication reported between them. The length of each connection is inversely proportional to the amount of communication reported over the six month period of the study6.
The network of Figure 3 exhibits an interesting characteristic. There is a set of organizations in the center, that have a higher than average level of communication,
6 Since it was impossible to visit and recruit all 40 collaborating firms on the same day, we used a sliding window.
Data collection began on a slightly different day for each firm and continued for six months. So the six month period of data collection is slightly different (but overlapping) for each firm. This could have had serious for the study had something critical had affected the industry during the study. Fortunately for the investigators, no such untoward event occurred.
11
among themselves. Thus, there appears to be a sub-cluster, or perhaps a super cluster of high communicating organizations concentrated in the center of the overall
network. It will be interesting to examine the membership of this super cluster (Figure 4).
Figure 3 A View of the Interorganizational Scientific Communication Network as Reported by Scientists in a Sample of Biotech Firms and Organizations in the Area of Eastern Massachusetts, USA.
However, before we get into the task of identifying membership7, let us look at one of our basic hypotheses. If the geographic propinquity of firms in a cluster enables more intense communication, this should be observable in our network. As a first step in testing this, we divided the entire set of organizations into two groupings viz., the previously defined experimental and control groups.
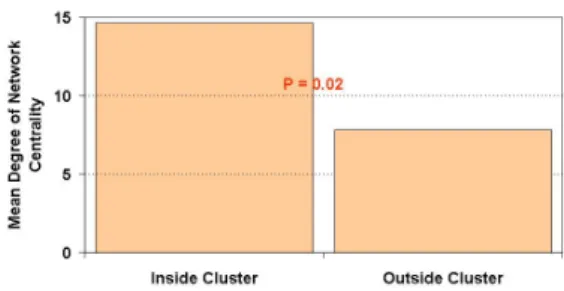
Using the degree of centrality of each node within the network (reference) as a metric for communication, we can compare the two groups (Figure 4). This reveals a
significant difference in their centrality or embeddedness in the network. Those organizations within the geographically defined cluster region have nearly twice as many connections with other organizations (Figure 4). Since centrality indicates the number of other firms with which a given firm may be in contact but not the amount of contact, we also compare the experimental and control firms on the basis of the
7 No organizations, aside from universities will be specifically identified. Understanding what can be the result
when people can identify high and low communicators, for example, we have had a standard policy, for many years of concealing identities. We will therefore identify only classes of organization.
12
amount of communication reported (Figure 5). Here we find that scientists in firms that are within the geographic bounds of the cluster reported that along with
distributing communication across a larger number of firms, they also simply communicated more. Thus we have the first elements of support for our basic hypothesis. Physical propinquity within a cluster may or may not be the cause of greater communication but it certainly correlates very strongly with the amount of inter-organizational scientific communication and assuredly makes it easier to attain greater levels of communication.
Figure 4 Mean Centrality of Organizations in the Experimental and Control Groups.
13
Figure 5. Mean Level of Communication
of Organizations in the Experimental and Control Groups.
With some support for the communication benefits of clustering, let us learn a little more about the nature and makeup of the Cambridge/Boston cluster. We will do this graphically first by
arbitrarily defining an area of concentration within
the network of Figure 3. This will tell us the types of organization to be found within the region of intensive communication seen in the center of Figure 3. We will then turn to physical location and see what types of organization are actually located physically within the formally defined bounds of the cluster.
Figure 6 A View of the Center of the Network
Categories of Organization
Now to complicate things but make the analysis more interesting as well, not all of the organizations in the network of Figure 3 are newly-formed Biotech firms. As previously mentioned, there are also five universities, six8 large scale broad-based (traditional) pharmaceutical firms and five larger, more established biotechnology firms. So let us look at each of these classes of organization separately.
Where are the Universities?
Four of the five universities can be readily identified within the network region that we have arbitrarily labeled a “super cluster” (Figure 6). The remaining two are in the
14
network but further from the center. The two most central universities are Harvard (Medical School) and MIT. These were the two principal sources from which a majority of the new biotech firms originated. It is therefore not at all surprising to find their ‘children’ tightly connected to them. The parent locations are probably the chief reason why the newly formed firms located where they did. In fact, our choice of defining the geographic limits of the cluster by postal codes was based upon the locations of the ‘parent’ universities. We chose postal code zones that included the addresses of the principal universities. In addition, although the communication data cannot tell us this, interviews indicate that proximity to these universities was also a major factor underlying the location decisions of the major pharmaceutical firms.
What about “Big Pharma”?
As stated above, there are five major pharmaceutical companies that have located in or near the experimental region. One of these has R&D activities at two sites about 33 Km apart. So there are really six sites at which these large companies are active in R&D. Certainly, the principal reason for these large firms locating in the Boston area is the presence of so many newly-formed Biotech firms in that region. To put it simply, they want to become members of the scientific communication network. In addition to university contact that their location enables, we would speculate that since most major pharmaceutical firms are working to develop new biologically based drugs, that they see membership in the network as an aid toward that goal. So how successful have they been? One does not have to look very long at Figure 6 to conclude that at least four of these firms have been very successful in at least gaining network membership. They are centrally located in the heart of the super cluster. Their scientists are in close communication with scientists in several smaller firms as well as in the universities.
Figure 7. Center of the Network, Highlighting the Universities.
15
Figure 8. Center of the Network Highlighting the Universities and the 'Big Pharma' Firms.
‘Big Bio’
We designated a subset of the biotechnology firms as ‘Big Bio’ simply on the basis of size and age. Such firms as Biogen, Amgen, Serono, Genzyme and Millennium are no longer new ventures. They are all large firms and have been in existence for more than a few years. Where are they in the network? Even a quick look at Figure 9 indicates that they are at least as central to the network as the larger pharmaceutical firms.
Figure 7. Center of the Network Highlighting the Universities, 'Big Pharma' and 'Big Bio'.
Comparisons on the Basis of Type of Organization.
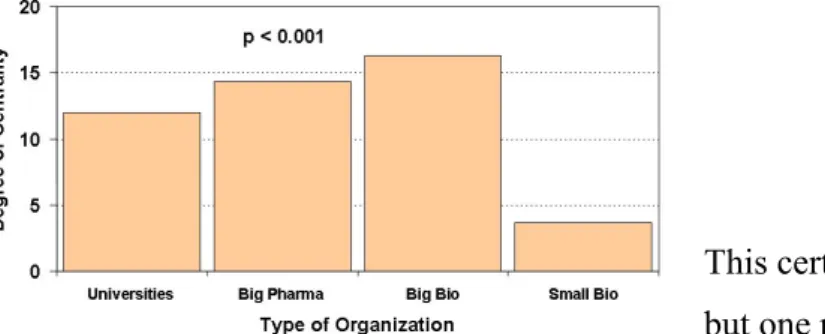
We can see from the network that both ‘Big Pharma’ and ‘Big Bio’ are very well connected into the central core. The universities are as well but that is no surprise since they are the parents out of which most of the new ventures originated. We will now look and see in a more quantitative manner, just how embedded they are. At least in the case of the ‘Big Pharma’, this will be a test of how successful they have
16
been in invading the network originally formed among the new venture firms. That they have been successful can be clearly seen in Figure 10.
Perhaps the most interesting aspect, though, is the low value of mean centrality for the small biotech firms. These are the firms who initially formed the network. Of course the universities were there from the beginning too, so it is no surprise to find them with a high degree of centrality. The larger firms were for the most part later arrival and they are on average more deeply embedded than the startup firms.
Figure 8. Mean Network Centrality for Four Categories of Organization.
This certainly seems strange, but one possible explanation might be that these firms are not as old as we might initially assume. The set might be dominated by newly formed companies that haven’t had sufficient time to embed themselves in the network. However, a closer look at the data shows this explanation to be invalid. Instead of the younger small companies having lower network
centrality, they actually have on average a higher degree of centrality than do the older small firms (r = -0.45, p = 0.05). This significant negative correlation does not occur for the larger firms and universities.9
Network centrality tells us how many organizations, on average, organizations of a particular type communicate with. It does not reveal just how much communication actually occurs. Turning to that measure, we find the smaller firms in a much stronger position (Figure 11). Although the differences that appear in Figure 11 are
9 When the data from the universities, Big Pharma and Big Bio firms are combined the correlation between age
17
not significant statistically, we can say that the smaller firms do not appear to be any less active in interorganizational scientific communication than their larger neighbors. Once again, however, what appear anomalous results for the smaller biotech firms. The older firms in this category report significantly less scientific (r = -0.51, p = 0.02) communication outside of the firm than do the larger firms.
What we seem to be seeing here is that the newly formed firms work harder to
establish scientific exchange with many neighboring organizations (not just with their university parent) and as they grow older, they narrow the number of targets for this activity and increase the amount of communication with this smaller number of organizations.
Figure 9. Interorganizational Scientific Communication Reporte by Organizations in Three
Categories.
Mean Distance & Communication
As a further test of the basic clustering hypothesis, we
measured the physical distances separating each pair of firms.10 Then for each firm, we computed the mean separation distance of that firm from all of the others. In Figure 12, we see that communication frequency is inversely related to inter-company distance. The inter-company distances are expressed in kilometers and were
calculated using the coordinates of latitude and longitude for each company11. Total communication was then plotted for each value of mean inter-company distance. As
10 We did this by obtaining the latitude and longitude of each firm and then computing the straight-line distance.
Of course, there are several inherent in such a calculation. First, the geographic position that we work from is that of the front door of the facility. Second, the distance measured does not take into the indirect paths that one would have to travel to go between firms.
18
in our previous research, it is best expressed by a 1/x2 relationship as communication quickly decays as distance increases.
Figure102. Interorganizational Scientific Communication Reported
as a Function of Mean Separation distance from Other Organizations.
Each point on the graph in Figure 12 represents one company in our sample. The x-axis coordinate is the mean distance between that company and all of the other organizations. In other words, it is how far, on average, this
particular company is from all of the other organizations in our sample. Because of the large concentration of companies in the experimental area, those with low average inter-company distances are in or very close to the geographic center of the biotech cluster. The vertical coordinate is the total amount of communication reported by that given company with all of the others.
This graph shows that companies in the physical center of the biotech cluster
communicate more with other companies. As mean separation distance increases, the total communication with other companies decreases as 1/x2.
Since we did not ask scientists to report the medium used for each communication, this number could include email and telephone as well as face-to-face. Why then would it decay with distance? We do not have a definitive answer for that. However, there is evidence from a study by Allen & Hauptman (1987), that the use of different communication media is positively correlated. Regardless, however, of whether the communications were face-to-face, the important fact is the decline with distance. Those declaring the death of distance are at least in this instance patently wrong. Separation distance does matter in the 21st Century, and these data once again support
19
the idea of clustering high tech new ventures or at least biotechnology firms together geographically.
REFERENCES
Allen, T.J. and O. Hauptman (1987). The influence of communication technologies
on organizational structure, a conceptual model for future research. Communication
Research, 14, (5); pp. 575-578.
Allen, T.J. and G.W. Henn (2006). Organization and Architecture for Innovative
Product Development. New York: Elsevier.
Cairncross, F. (2001). The Death of Distance; How the Communications Industry is
Changing Our Lives. Boston: Harvard Business School Press.
Gloor, P. & Y. Zhao (2004). TeCFlow - A Temporal Communication Flow Visualizer
for Social Networks Analysis. ACM CSCW Workshop on Social Networks. ACM
CSCW Conference, Chicago.
Porter, K.A. & W.W. Powell (2006). Networks and Organizations. in S. Clegg, C. Hardy, T. Lawrence and W. Nord (Eds.) The Handbook of Organization Studies: Ten Years On: 776-799. Thousand Oaks, California: Sage Publishing.
Porter, K.A., K.C. Bunker Whittington, & W.W. Powell (2005). The institutional
embeddedness of high-tech regions: Relational foundations of the Boston
biotechnology community. In S. Breschi & F. Malerba (Eds.), Clusters, Networks, and
Innovation: 261-296. Oxford, UK: Oxford University Press.
Powell, W.W., K.W. Koput, & L. Smith-Doerr (1996). Interorganizational
collaboration and the locus of innovation: Networks of learning in biotechnology.
Administrative Science Quarterly, 41:1, pp. 116-145.
Saxenian, AnnaLee (1994). Regional Advantage: Culture and Competition in Silicon
Valley and Route 128. Cambridge, MA: Harvard University Press.
Schilling, M.A. & C.C. Phelps (2005). Interfirm collaboration networks: the impact
of small world connectivity on firm innovation. Management Science, 53 (7), pp.