HAL Id: hal-00297069
https://hal.archives-ouvertes.fr/hal-00297069
Submitted on 2 Jan 2008
HAL is a multi-disciplinary open access
archive for the deposit and dissemination of
sci-entific research documents, whether they are
pub-lished or not. The documents may come from
teaching and research institutions in France or
abroad, or from public or private research centers.
L’archive ouverte pluridisciplinaire HAL, est
destinée au dépôt et à la diffusion de documents
scientifiques de niveau recherche, publiés ou non,
émanant des établissements d’enseignement et de
recherche français ou étrangers, des laboratoires
publics ou privés.
InSAR processing for the recognition of landslides
B. Riedel, A. Walther
To cite this version:
B. Riedel, A. Walther. InSAR processing for the recognition of landslides. Advances in Geosciences,
European Geosciences Union, 2008, 14, pp.189-194. �hal-00297069�
Germany
Received: 26 July 2007 – Revised: 2 November 2007 – Accepted: 10 November 2007 – Published: 2 January 2008
Abstract. Synthetic Aperture Radar Interferometry (InSAR)
is an established method for the detection and monitoring of earth surface processes. This approach has been most suc-cessful where the observed area fulfills specific requirements, such as sufficient backscattering, flat slope gradients or very slow changes of vegetation. We investigated the capability of two different InSAR techniques and achieved good results for the recognition of landslides in China and Greece that compared well with geodetic derived movement rates. This demonstrates the strong potential of SAR Interferometry for the detection of landslides and earth surface movements.
1 Introduction
Landslides are one of the most dangerous natural hazards in the world, causing high annual death tolls (Sidle and Ochiai, 2006). On average, landslides annually kill twice as many people as earthquakes and result in high annual dam-age costs. In the years 2003 to 2006 the European Union (EU) funded a multidisciplinary international project called OASYS (Integrated optimization of landslide alert systems). The scope of OASYS was to set up an integrated workflow for landslide hazard management. This system should lead the practitioner from data acquisition to suggestions of risk management measures. The emphasis of the project was the development of observation methods that allow:
– detection of potential landslides on large scale
– an efficient and continuous observation of critical areas – a knowledge-based derivation of real time information
about actual risks in order to support an alert system (Kahmen et al., 2007).
Correspondence to: B. Riedel
For spatial optimization of this kind of an alert system a multi scale approach has to be applied, which helps to reduce the area that has to be observed (Niemeier and Riedel, 2006). This multi scale approach or observation concept starts with the processing of remote sensing data, because the early identification of high risk areas is the most important step. On the one hand remote sensed data allow scientists to ex-amine past landslide evidence and on the other hand these data can be used in ongoing and future satellite missions to serve as a base for the detection and monitoring of earth sur-face processes. For the recognition of sursur-face movements we investigated the capability of Synthetic Aperture Radar Interferometry for different test sites in Greece, Germany, Hungary, Romania and China. Examples from Greece and China are described herein.
2 SAR Interferometry
2.1 Basic principles
The use of data acquired from remote sensing systems, es-pecially from active sensor systems like radar, has become of more and more importance in recent years. Since the start of the European Remote Sensing (ERS) satellites ERS 1 in 1991 and ERS 2 in 1995 continuously recording of high quality Synthetic Aperture Radar (SAR) scenes has been ac-complished and an extensive data archive is available today. SAR Interferometry gives us two main possibilities. On the one hand it is possible to generate Digital Elevation Models (DEM) and on the other hand there is the possibility to de-rive changes of the earth surface in the sense of subsidence (vertical displacements) or horizontal displacements, i.e. post seismic movements (Lu et al., 2007).
190 B. Riedel and A. Walther: InSAR processing for the recognition of landslides
Fig. 1. Typical SAR geometry of master and slave scene with a
short baseline for the detection of earth surface changes in the 2-pass processing approach. A movement of the point P downhill results in a distance change to the second data acquisition of the satellite and leads to a phase shift of the radar signal. The third scene with a longer baseline serves in relation to the master scene in the 3-pass processing for the derivation of a height model in SAR geometry.
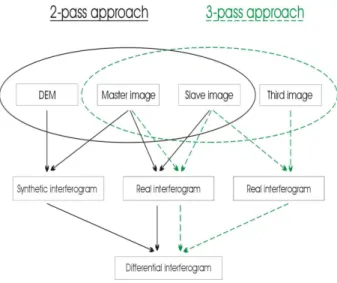
Fig. 2. Flow chart of the main processing schemes of InSAR. The
difference between both approaches lies in the use of an external DEM (2-pass interferometry) or in the use of a third image (3-pass processing) with a long baseline in relation to the master image for DEM generation in SAR geometry. The resulting differential in-terferogram has to be filtered and unwrapped for the derivation of surface displacements.
Generally two SAR data acquisitions, called scenes or im-ages, of the same area are required to generate interference
Fig. 3. The Baota landslide occurred in 1982 on the left bank of the
Yangtze river (visible in the background). The city of Yunyang is located in the middle of the Three Gorges Reservoir.
fringes resulting from phase differences that can be inter-preted as heights or displacements. The typical SAR geom-etry of master and slave scene with a short baseline for the detection of earth surface changes is shown in Fig. 1. The ground resolution of the examined C-band data is 20 m in one direction. A prerequisite is the coherence between the two data acquisitions of the backscattered phase information of the ground pixel. The coherence is measured as the abso-lute value of the correlation between related pixels and varies from 0 to 1. This corresponds from low to high coherence (see examples in Figs. 4 and 5). The higher the coherence the better the final differential interferogram.
The main radar frequency used by SAR satellites, (ERS 1-/2, ENVISAT and RADARSAT), is in the C-band with a nominal frequency of 5.3 GHz corresponding to a wave-length of 5.6 cm. The other frequencies are in the L-band (1-2.6 GHz) used by the Japanese satellites JERS and ALOS and the X-band (8.2-12.4 GHz) for the new German Radar satellite TerraSAR-X. The higher the radar frequency the lower the penetration depth in any type of material. Addi-tionally to this circumstance there is also a dependence on surface roughness and its moisture content. The C-band rep-resents a reasonable compromise between penetration depth in the canopies of trees and bushes and backscattering prop-erties of the soil in relation to the L- and X-band (Henderson and Lewis, 1998; Nolan and Fatland, 2003). The repeat cy-cle between 2 or more scenes depends on the satellite mis-sion and is 35 days for ERS and ENVISAT and 24 days for RADARSAT. The time interval for InSAR processing is lim-ited by the loss of coherence which depends on the vegetation cycle and the growth rate.
The other limiting factor for SAR data processing is the length of the perpendicular baseline between the acquired
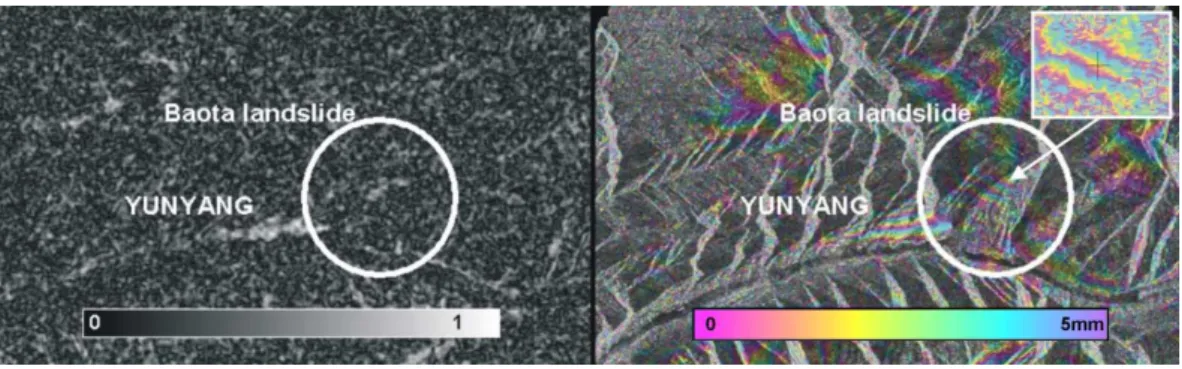
grey/black pixels to low or no correlation. The right side of the figure shows the resulting fringe pattern overlayed on the amplitude radar image from the 2-pass processing. Movement rates are visible for the landslide and for the city of Yunyang. The inlet figure shows the unwrapped phase for the middle part of the landslide in detail with a movement rate of 14 mm per 6 months.
images for data processing. Gens (1998) described the spa-tial distribution of baseline lengths for ERS. Here, the practi-cal limit for InSAR processing is restricted to a perpendicu-lar baseline length up to 600 m. For the generation of DEMs baseline lengths between 150 m and 300 m are most suitable. Baseline lengths between 30 m and 70 m are useful for sur-face change detection and baselines smaller than 30 m are excellent to derive earth surface movements. These limits are also valid for ENVISAT data, because ENVISAT uses the same wavelength as ERS.
2.2 Processing approaches
The image selection has a significant influence on the final results of the interferometric processing. The criteria vary ac-cording to the specific objects of an investigation. The most important parameters are the sensor type and the availabil-ity of data. The temporal and the spatial distribution of the baselines and the terrain characteristics are also parameters that have great influence on the data processing. The spatial slope orientation can be taken into consideration by choosing descending or ascending satellite tracks. The first processing step in the processing chain is the co-registration between two radar scenes. If these scenes are co-registered than it is possible to calculate the interferogram by multiplying the phase signal for each pixel and the coherence. From this real interferogram a synthetic interferogram, representing the to-pographic phase of a Digital Elevation Model for the area of investigation, has to be substracted. To get reasonable input values for data processing it is useful to use precise orbits and a DEM, such as the Space Shuttle Radar Topographic Mis-sion (SRTM) which is available for 90% of the earth surface with a grid resolution of 90 m (Farr et al., 2005). Multiple filter steps are applied to reduce the system and processing noise and to enhance the searched signal, i.e. the change of the earth surface (Wegmueller and Strozzi, 1998; Werner et al., 2002). Thereafter, the phase unwrapping process is
ex-Fig. 5. The coherence map for the Prinotopa area shows good
co-herence for the selected data. The images from January to April 1996 cover the main triggering period from snow melt and heavy spring rainfall and were taken before the vegetation growth period, which starts in June.
ecuted to generate the differential interferogram. This kind of processing is called the 2-pass approach. The topograhic phase can also be removed by using a third image in relation to the master image with a long baseline by generating a sec-ond real interferogram. The result of this 3-pass approach is the final differential interferogram, (Fig. 2).
3 Results from the application of InSAR techniques to landslide monitoring
In the framework of the EU project OASYS, we processed data from test sites in several countries. In general, European Remote Sensing satellite (ERS 1 and 2) data were used. For the processing of the Greek test site in Prinotopa we also used ENVISAT observations. The subsampled 3sec-SRTM DEM of the regions of investigations were imported into the
192 B. Riedel and A. Walther: InSAR processing for the recognition of landslides
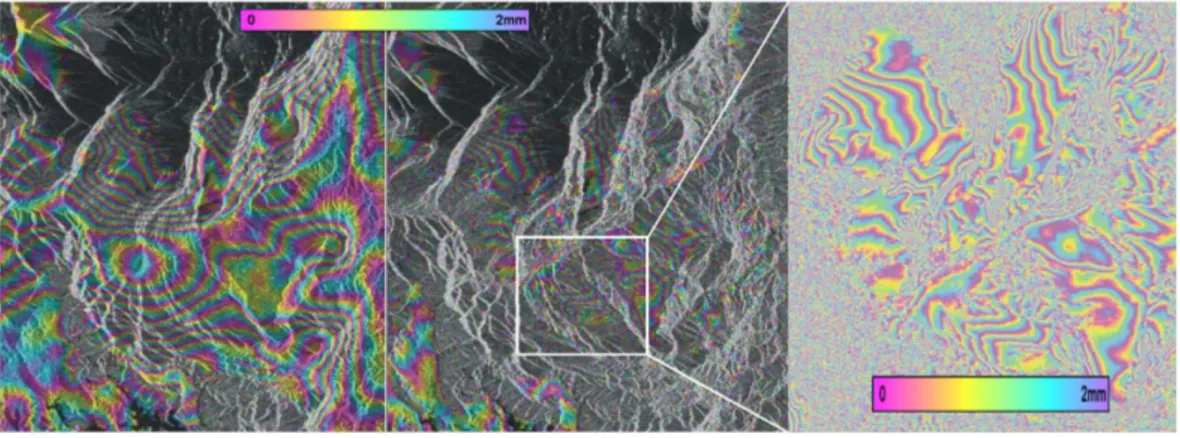
Fig. 6. The left side of the figure shows the fringe pattern for the Prinotopa area overlayed on the amplitude radar image from the 2-pass
processing with the SRTM-DEM. The middle part displays the results of the same area derived from a 3-pass processing. The enlargement, on the right, shows movement rates of 14 mm per 3 months, which are in good agreement with GPS measurements from 2003.
2-pass processing approaches. In most cases of the 3-pass process we used data sets derived from a ERS 1-/2 tandem mission with long baselines for the generation of a height model in SAR geometry. Both types of DEMs can serve as a useful data source for modelling purposes and analyzing functions in Geographic Information System (GIS) within an alert system, e.g. for the derivation of slope parameters. 3.1 Baota landslide, China
The InSAR investigations in China were especially focused on the Baota landslide, (Fig. 3). The site is near the city of Yunyang, located in the middle of the Three Gorges Reservoir, 223 km upstream of the Three Gorges dam, on the left bank of the Yangtze river. The Baota landslide event occurred on the 18 July 1982, triggered from a hun-dred year frequency rainfall and flooding. During this event 2.3 million m3of rock mass slid into the Yangtze (Cui, 2000). 4000 people live on the landslide, which is still moving. The area of investigation has a length of 1900 m, a mean width of 1000 m and 450 m height difference. The mean surface gra-dient is 15 degrees and the thickness of the landslide deposits is 70 m (Cui, 2003).
The ERS 1-/2 data processing for this test site was limited by a small number of acquired images in the ESA archive. This necessitated the processing with the 2-pass approach using the subsampled and interpolated 30 m SRTM-DEM. The 2-pass processing chain was applied to the image pair of frame 2979 with the scenes 23 424 (date of acquisition 07.01.96) of ERS 1 and 06256 (01.07.96) of ERS 2. The perpendicular baseline length is 23 m derived from precise orbits. Further processing was accompanied by manual cor-rections to the standard filter parameters, because two vege-tation growth periods and the steepness of the terrain in this area complicated the InSAR processing, as visible in the co-herence map of the left side of Fig. 4. One can see the strong
difference in coherence as a result of the backscattering prop-erties of the city of Yunyang in relation to the soil and veg-etation surface of the landslide. The resulting interferogram for Baota landslide can be seen in the right side of Fig. 4.
The changes of colour in the interferogram, represented by sequences of colour cycles, show the change of earth sur-face for a time difference of approximately 6 months (07.01.– 01.07.1996). One colour cycle, called fringe, is scaled to 5 mm. The displayed displacements in the line of sight of the sensor achieves a maximum value of 14mm for the mid-dle part of the landslide and 3–5 mm for the accumulation zone at the foot of the slope. Movement rates for the city of Yunyang were also derived.
In 1997 a GPS and terrestrial network was established which consisted of 5 stable control points and 12 monitor-ing points on monuments in the movmonitor-ing landslide. This net-work was measured three times in 1997 using Rogue 8000 receivers for the GPS measurements and EDM from the type Wild DI 2002. Based on these GPS-EDM results for January and November 1997 movement rates between 10–25 mm in the middle of the slope and 5 to 11 mm for the accumula-tion area were derived for a period of 11 months (Zhang and Jiang, 2003). A comparison of our 1996 2-pass InSAR re-sults with the 1997 geodetical derived observations shows a good coincidence under the assumption of linear movement trend for the slope.
3.2 Prinotopa landslide, Greece
The southern part of the Prinotopa landslide area can be seen in Fig. 5. It is situated 20 km north-east of the city of Ioannina. This area is intersected by a national highway, which has to be resurfaced every summer because of numer-ous landslide damages. These landslides are triggered from snow melt, heavy rainfall in spring and additionally from earthquakes. A part of this national road will be enlarged,
bits were used in the processing chain. The steepness of the terrain caused some data gaps in the SRTM data set that were filled by bi-linear interpolation. The final input DEM had a grid width of 30 m. For the InSAR processing we used the 2-pass and 3-pass approaches as mentioned above in the sub-section “Processing Approaches”. The combination of data sets for the different approaches was selected by the baseline length, time difference between the acquisiton and the result-ing coherence. An example of good coherence is displayed in Fig. 5. The displayed coherence map of frame 783 was de-rived from the scenes of the 27.01.1996 and the 06.04.1996 with a 27 m baseline.
The final results in the line of the radar sensor for the 2-pass and 3-2-pass processing can be seen in Fig. 6. The left side of the figure shows the fringe pattern for the Prinotopa area overlayed on the amplitude radar image from the 2-pass pro-cessing with the SRTM-DEM. The middle part of this figure displays the results of the same area derived from 3-pass pro-cessing. Both results were generated with the data set seen in Fig. 5. The perpendicular baseline of the topographic pair used for the 3-pass approach is 157 m and was derived from the scenes of 06.04.1996 and 11.05.1996. The fringe pattern of the left subfigure results from imperfections of the DEM that is overlayed by the deformation pattern. In contrast to this 2-pass result, the middle subfigure shows unique areas of earth surface changes. The right hand enlargement of Fig. 6 clearly shows the fringe pattern and the random noise of the pixels. It also shows that the whole area is covered by nu-merous landslides. The derived movement rates correspond to a fringe cycle of 2 mm and reach 14 mm of displacement per 3 months. These landslide movement rates are in good agreement with observations of the combined GPS and ter-restrial network. Deformations up to 30 mm per year were derived from these observations (Lakakis, 2003).
4 Conclusions
The results demonstrate on the one hand that there is a strong potential for the detection of landslides and possible earth surface movements with SAR Interferometry and on the other hand the high accuracy of interferometric satellite
changes of vegetation.
Acknowledgements. The OASYS project (EVG1-2001-00061)
was supported by the European Commission under the Fifth RTD Framework Program. The satellite data for the InSAR investiga-tions for the Greek test site were supported by the European Space Agency via a category-1 proposal.
Edited by: P. Fabian
Reviewed by: M. Larsen and D. Keefer
References
Cui, Z. Q.: Failure Mechanism and Prediction ideology for nat-ural slopes of the Three Gorges Area of Changjiang, Bureau of Geotechnique of Changjiang Water Resources Commission (CWCR), Wuhan, 2000.
Cui, Z. Q.: Brief introduction of BAOTA Landslide –One of the Ex-amination Spots of OASYS, Bureau of Investigation & Survey, Wuhan, 2003.
Egnatia Odos: Egnatia Motorway –Informative Report, Egnatia Odos A. E., Ministry of Environment, Physical Planning and Public Works, Thessaloniki, 2003.
Farr, T. G., Rosen, P. A., Caro, E., et al.: The Shuttle Radar Topography Mission, Rev. Geophys., 45, RG2004, doi:10.1029/2005RG000183, 2005.
Gens, R.: Quality assessment of SAR interferometric data, Wis-senschaftliche Arbeiten der Fachrichtung Vermessungswesen der Universitaet Hannover, Nr. 226, Dissertation, 86–88, 1998. Henderson, F. M. and Lewis A. J.: Principles and Application of
Imaging Radar, Manual of remote sensing, Vol. 2, 3 ed., John Wiley & Sons, New York, 867 pp., 1998.
Kahmen, H., Eichhorn, A., and Haberler-Weber, M.: A Multi-Scale Monitoring Concept for Landslide Disaster Mitigation, in: Dy-namic Planet Monitoring and Understanding a DyDy-namic Planet with Geodetic and Oceanographic Tools, edited by: Tregoning, P. and Rizos, C., IAG Symposium, Cairns, Australia, 22–26 Au-gust, 2005 Series, International Association of Geodesy Sym-posia, Vol. 130, Springer, 769–775, 2007.
Lakakis, K.: Surface Landslides Deformation Monitoring in Egna-tia Ods S.A. Internal Report of EgnaEgna-tia Odos A.E., Ministry of Environment, Physical Planning and Public Works, Thessaloniki, 2003.
194 B. Riedel and A. Walther: InSAR processing for the recognition of landslides
Lu, Z., Kwoun, 0., and Rykhus, R.: Interferometric Synthetic Aper-ture Radar (InSAR): Its Past, Present and FuAper-ture, Photogramm. Eng. Rem. S., 73, 3, 217–221, 2007.
Niemeier, W. and Riedel, B.: Mehrskaliges geodaetisches Beobach-tungskonzept fuer die Ueberwachung groflaechiger Rutschungs-gebiete, in: Schriftenreihe des Institutes fuer Markscheidewesen und Geodaesie an der Technischen Universitaet Bergakademie, 7. Geokinematischer Tag Freiberg, 23–30, 2006.
Nolan, M. and Fatland, D. R.: Penetration Depth as a DInSAR Ob-servable and Proxy for Soil Moisture, IEEE T. Geosci. Remote, 41, 3, 552–537, 2003.
Riedel, B. and Niemeier, W.: Results of InSAR processing in the Changjiang (Yangtze river) region, Proceedings of APSG Work-shop, Hong Kong, 5 pp., 2005.
Sidle, R. C. and Ochiai, H.: Landslides- Processes, Prediciton and Land Use, AGU Books Board, Washington, 312 pp., 2006. Wegmueller, U. and Strozzi, T.: Characterization of Differential
Interferometry Approaches, European Conference on Synthetic Aperture Radar EUSAR’98, 237–240, 1998.
Werner, C., Wegmueller, U., and Strozzi, T.: Processing strategies for phase unwrapping for INSAR applications, Procs. EUSAR Conf., Cologne, Germany, 4–6 June 2002, 353–356, 2002. Zhang, J. and Jiang, B.: GPS landslide monitoring of Yunyang
Baota, Report of University Wuhan, 14 pp., 2003.