HAL Id: hal-01827810
https://hal.inria.fr/hal-01827810
Submitted on 14 Jul 2018
HAL is a multi-disciplinary open access
archive for the deposit and dissemination of
sci-entific research documents, whether they are
pub-lished or not. The documents may come from
teaching and research institutions in France or
abroad, or from public or private research centers.
L’archive ouverte pluridisciplinaire HAL, est
destinée au dépôt et à la diffusion de documents
scientifiques de niveau recherche, publiés ou non,
émanant des établissements d’enseignement et de
recherche français ou étrangers, des laboratoires
publics ou privés.
Ultra-high-resolution wall-sized displays enable the
visualisation of very large datasets
Emmanuel Pietriga, Fernando del Campo, Amanda Ibsen, Romain Primet,
Caroline Appert, Olivier Chapuis, Maren Hempel, Roberto Muñoz, Susana
Eyheramendy, Andres Jordan, et al.
To cite this version:
Emmanuel Pietriga, Fernando del Campo, Amanda Ibsen, Romain Primet, Caroline Appert, et al..
Ultra-high-resolution wall-sized displays enable the visualisation of very large datasets. SPIE
News-room, Spie, 2016, pp.3. �10.1117/2.1201605.006505�. �hal-01827810�
Ultra-high-resolution wall-sized
displays enable the visualisation
of very large datasets
Emmanuel Pietriga, Fernando del Campo, Amanda Ib-sen, Romain Primet, Caroline Appert, Olivier Chapuis, Maren Hempel, Roberto Mu˜noz, Susana Eyheramendy, Andres Jordan, and Herv´e Dole
Such displays feature a very high pixel density over a large phys-ical surface, which makes them well-suited to the exploratory vi-sualisation of large, heterogeneous datasets. Application areas include scientific data analysis and crisis management. Our ability to acquire or generate, store, process, interlink and query data has increased spectacularly in recent years. This has had a profound impact in many application areas, includ-ing scientific disciplines such as Astronomy, Molecular Biology or Particle Physics. Challenges to address in these increasingly data-driven domains span numerous fields of computer science research: databases, data mining, communication networks, as well as human-computer interaction and more specifically in-teractive data visualisation. Indeed, scientists are faced with large-to-huge amounts of data that are difficult to understand and analyse in depth because of their sheer size and complex-ity. Users require effective tools to freely-yet-efficiently explore, make sense of, and interactively manipulate their data.
As part of our research in the field of data visualisation, we investigate the design, engineering and evaluation of ultra-high-resolution wall-sized displays1. This type of display features a
very high pixel density over a large physical surface. For in-stance, WILD, the first wall display we set up in our labora-tory, has a total resolution of 20,480 × 6,400 = 131 megapixels for a surface area of 5.5m×1.8m. Figure 1 shows part of the GLIMPSE360 image2
displayed on our newer wall, WILDER, which has a somewhat lower resolution (14,400 × 4,800) but fea-tures a touch-sensitive frame and much narrower screen bezels. Platforms such as WILD and WILDER can represent the data with a high level of detail while at the same time retaining context: users can transition from an overview of the data to a
Figure 1. Zooming in GLIMPSE360, Spitzer’s Infrared Milky Way image (540,000 × 15,000 pixels), on WILDER.
detailed view simply by physically moving in front of the wall display. Wall displays also offer good support for collaborative work, enabling multiple users to simultaneously visualise and interact with the data, provided that the right input devices and interaction techniques are made available.
1
Interacting with Wall Displays
Early work on ultra-high-resolution wall displays has mainly focused on the technical aspects of how to make such platforms: how to display complex graphics, how to stream data across the nodes of the computer clusters that drive them. They did not pay much attention to issues related to interacting with these display surfaces, often offering poor capabilities in that respect such as wireless mouse & keyboard on a stand, or in some cases gyroscopic mice.
To make them truly interactive, wall displays are increas-ingly coupled with input devices such as touch frames, motion-tracking systems and wireless multitouch devices, in order to enable multi-device and multi-user interaction with the dis-Continued on next page
played data. Our research is about designing and empiri-cally evaluating novel interaction techniques specifiempiri-cally de-signed for these environments, such as high-precision remote pointing techniques to enable users to interact when they are not within arm’s reach of the display3
, or mid-air panning and zooming techniques for navigating maps, images and datasets that exceed the display capacity of wall displays4
.
Our research is also about the engineering of this specific type of interactive systems. As mentioned earlier, ultra-high-resolution wall displays are often driven by clusters of computers (the above-mentioned WILD platform uses 32 + 1 graphics pro-cessing units in 16 + 1 computers), which causes problems of data sharing and graphics rendering. The multiple input chan-nels from the heterogeneous devices involved in user interaction with a wall display (motion tracker, tablets, smartphones, lap-tops) also add significant complexity to the process. We work on the design and development of software toolkits that ease the rapid prototyping and development of advanced interactive visualisations that can run on cluster-driven display surfaces5, 6
.
2
Application to Astronomy
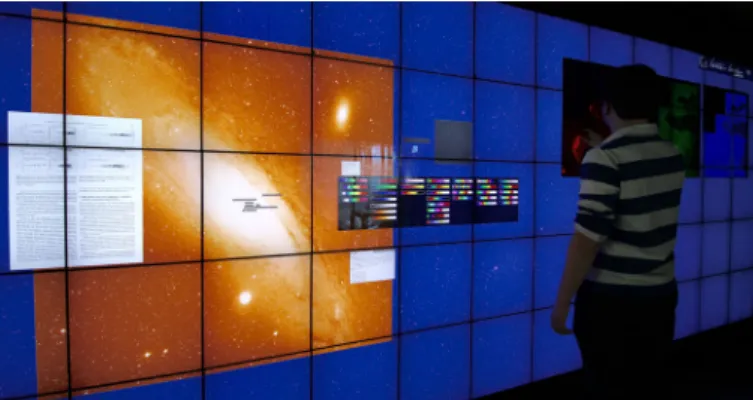
Application areas range from the monitoring of complex infras-tructures and crisis management situations to tools for the ex-ploratory visualisation of scientific data. Our latest application, called FITS-OW7, enables astronomers to visualise and
inter-act with very large FITS images and collections thereof (Fig-ure 2). They can pan and zoom in images that are several hun-dred thousand pixels in width and height, overlay the results of data analyses, fetch and display additional images of a specific object or region in the sky, showing observations in different ranges of the electromagnetic spectrum or at different times. FITS-OW also lets astronomers query databases such as Sim-bad servers, and visualise the results of such queries in-place, right next to the corresponding source in the image. Detailed information can be shown for multiple sources simultaneously, including multiple measurements as well as documents.
Astronomers perform these operations using interaction tech-niques that were designed specifically for wall displays, using di-rect manipulation and gestures performed on the wall’s surface or on handheld tablets8. Details about the specific challenges
addressed in FITS-OW are discussed in our upcoming SPIE As-tronomical Telescopes and Instrumentation conference paper7:
generation of FITS tile pyramids and their multi-scale render-ing; queries to sky catalogs; dynamic adjustment of scale, color mapping and graphics compositing settings, and the underlying input management framework.
Author Information
Figure 2. FITS-OW on WILDER showing multiple FITS im-ages, the result-set of a SIMBAD query restricted to observa-tions about galaxies, basic measurements for galaxy M31, a page of a research paper discussing that particular galaxy, and the color map selector.
Emmanuel Pietriga, Fernando del Campo, Amanda Ib-sen, Romain Primet, Caroline Appert, Olivier Cha-puis, Maren Hempel, Roberto Mu˜noz, Susana Eyhera-mendy, Andres Jordan, and Herv´e Dole
Emmanuel Pietriga is a senior research scientist at INRIA in Saclay, France and Santiago de Chile. His research focuses on interactive visualisation techniques for large datasets, including multi-scale user interfaces and ultra-high-resolution wall-sized displays. He collaborates with the ALMA radio-telescope on user interfaces for operations monitoring and control.
http://pages.saclay.inria.fr/emmanuel.pietriga/
References
1. M. Beaudouin-Lafon, S. Huot, M. Nancel, W. Mackay, E. Pietriga, R. Primet, J. Wagner, O. Chapuis, C. Pillias, J. R. Eagan, T. Gjerlufsen, and C. Klokmose, Multisurface Interaction in the WILD Room, IEEE Computer 45 (4), pp. 48–56, 2012. doi:10.1109/MC.2012.110
2. B. Whitney, R. Benjamin, M. Meade, B. Babler, C. Watson, E. Church-well, T. Robitaille, R. Indebetouw, and GLIMPSE360 Team, Glimpse360: Observing The Outback Of The Galaxy, American Astronomical So-ciety Meeting Abstracts, p. 241.16, Jan. 2011.
3. M. Nancel, E. Pietriga, O. Chapuis, and M. Beaudouin-Lafon, Mid-Air Pointing on Ultra-Walls, ACM Trans. Comput.-Hum. Interact. 22 (5), pp. 21:1–21:62, Aug. 2015. doi:10.1145/2766448
4. M. Nancel, J. Wagner, E. Pietriga, O. Chapuis, and W. Mackay, Mid-air pand-zoom on wall-sized displays, Proceedings of the 2011 an-nual conference on Human factors in computing systems, pp. 177– 186, ACM, 2011. doi:10.1145/1978942.1978969
5. E. Pietriga, S. Huot, M. Nancel, and R. Primet, Rapid develop-ment of user interfaces on cluster-driven wall displays with jBricks, Proceedings of the 3rd ACM SIGCHI symposium on Engi-neering interactive computing systems, pp. 185–190, ACM, 2011. doi:10.1145/1996461.1996518
6. O. Chapuis, A. Bezerianos, and S. Frantzeskakis, Smarties: An Input System for Wall Display Development, Proceedings of the 32nd
ternational conference on Human factors in computing systems, pp. 2763–2772, ACM, 2014. doi:10.1145/2556288.2556956
7. E. Pietriga, F. del Campo, A. Ibsen, R. Primet, C. Appert, O. Cha-puis, M. Hempel, R. Mu˜noz, S. Eyheramendy Duerr, A. Jordan, and H. Dole, Exploratory Visualization of Astronomical Data on Ultra-High-Resolution Wall Displays, Proceedings of the Astronomical Tele-scopes and Instrumentation conference: Software and Cyberin-frastructure for Astronomy IV, SPIE, June 2016. To appear 8. H. Olafsdottir and C. Appert, Multi-Touch Gestures for Discrete and Continuous Control, Proceedings of the International Work-ing Conference on Advanced Visual Interfaces, pp. 177–184, ACM, 2014. doi:10.1145/2598153.2598169