AT HIGH TEMPERATURES
by
HISASHI KOBAYASHI B.E., University of Tokyo
(1970)
S.M., Massachusetts Institute of Technology (1972)
E.M., Massachusetts Institute of Technology (1975)
SUBMITTED IN PARTIAL FULFILLMENT OF THE REQUIREMENTS FOR THE
DEGREE OF
DOCTOR OF PHILOSOPHY
at the
MASSACHUSETTS INSTITUTE OF TECHNOLOGY
June, 1976
Signature of Author
Mrartment of Mechanical EntM ering, April ,1976
Certified by
Thesis Supervisor
Certified by
* .n 1
X/I
Thesis
Supervisor
v X
v-Accepted by
Chairman, Department Committee on Graduate Students
ARCHIVES
DEVOLATILIZATION OF PULVERIZED COAL AT HIGH TEMPERATURES
by
HISASHI KOBAYASHI
Submitted to the Department of Mechanical Engineering in May 1976, in partial fulfillment of the requirement for the degree of Doctor of Philosophy.
ABSTRACT
Weight losses and changes in the elemental composition in char during devolatilization of pulverized coal were measured for a wide range of experimental conditions, thus extending existing information on the kine-tics of devolatilization from a previous upper temperature of 1700°K to 21000K.
Data on the devolatilization kinetics were obtained in a laminar flow furnace for a lignite and a bituminous coal, under rapid heating L04-2xI05~
°K/sec), at high temperatures (1000-21000°K), short residence times (0-200 msec) and rapid quenching (106°K/sec) conditions with time resolutions down to 3 mseco Weight losses of both coals increased significantly with temperature (about 30% at 1250°K and 200 msec to about 65% at 2100°K and 25 msec on d.a.f. basis) and reached different final values at different temperatures within residence times between 30 and 250 msec.
Devolatilization in crucibles under slow heating (1-100K/sec), but with the same peak temperature, showed that weight loss reaches an asymptotic value close to that of the ASTM proximate test at around 1200°K and further heating to 21000K resulted in only a slight increase in weight loss. The effect on the weight loss of changing the bed depth of coal in the crucible from 1 to 200 layers was shown to be negligible under the present conditions.
Use of ash as a tracer in determining the weight loss was critically assessed and the range of its applicability was determined.
From the ultimate analysis of char it was found that more carbon, less hydrogen and less oxygen are retained in chars from the crucible experiment than in those from the flow experiment at the same weight loss.
Kinetic parameters based on a single firsj order reaction (about 25 Kcal for activation energy and 6.6x10⁴ sec for frequency factor) was in general agreement with the extrapolation of available data at
lower temperatures.
A model based on two competing overall reactions was found to provide an adequate empirical correlation of the present data and that previously reported at lower temperatures for the same coal.
A possible mechanism for increases in volatile yield under rapid heating and high temperature conditions was proposed.
Thesis Supervisors: Jack B. Howard Professor of
Chemical Engineering Adel F. Sarofim Professor of
ACKNOWLEDGMENTS
The author is glad to have the opportunity to express his sincere appreciation to his thesis supervisors for their guidance throughout the course of this research. Professor A. F. Sarofim's enthusiasm and
understanding of the problem, and many discussions late at night have provided valuable educational experience and encouragement. Constructive
criticism and patience of Professor J. B. Howard helped improve the understanding of the problem. Thanks are due to Professor J. B. Heywood and Professor J. F. Louis who served on the committee and provided
useful suggestions. Special mention is due to Dr. D. B. Stickler of AVCO Everett Research Laboratory, who initiated the topic for my Master's thesis and provided valuable comments since then.
The author is very grateful to John H. Pohl for his cooperation in the later stage of the experiment and suggestions through his experience in the field of reaction kinetics. Some of the results and figures are made through the joint efforts and Appendix I is prepared by him.
Thanks are also due to Dr. Jerzy Chomiak of Instytut Lotnictwa for building a two-color pyrometer system to measure particle temperatures.
Dr. Ashok S. Padia, as my former colleague, provided much assistance in building the experimental apparatus. His cooperation is highly
acknowledged. Thanks are extended to Jerry Mandel for his experimental help and to Lisa Chan for preparing SEM pictures.
Gerrard F. Power is to be thanked for his assistance in many aspects of the experiment and for reading some part of the manuscript.
James Waletzka,of Thermo Systems Inc., offered a laser doppler anemometer system which made it possible to measure particle velocities. Thanks are also due to Mrs. Gabriele Ivey for her excellent typing.
Personal financial support from the Murata Scholarship Foundation of Kyoto is gratefully acknowledged. This research was funded by ERDA Contract No. E(49-18)-2215.
Finally, I am deeply indebted to my wife, Miyako. Her understanding, help and patience in the rather limited life of a student's wife provided
TABLE OF CONTENTS Chapter No.
1 INTRODUCTION
1.1 Background
1.2 Literature Review
1.2.1 Enhanced Volatile Yields and Experimental Techniques 1.2.2 Devolatilization Mechanism 1.2.3 Devolatilization Models 1.3 Objectives
1.4 Scope of the Study
2 EXPERIMENTAL APPARATUS AND PROCEDURES 2.1 Selection of Apparatus
2.1.1 Shock Tube
2.1.2 Irradiation Heating 2.1.3 Flow Furnace
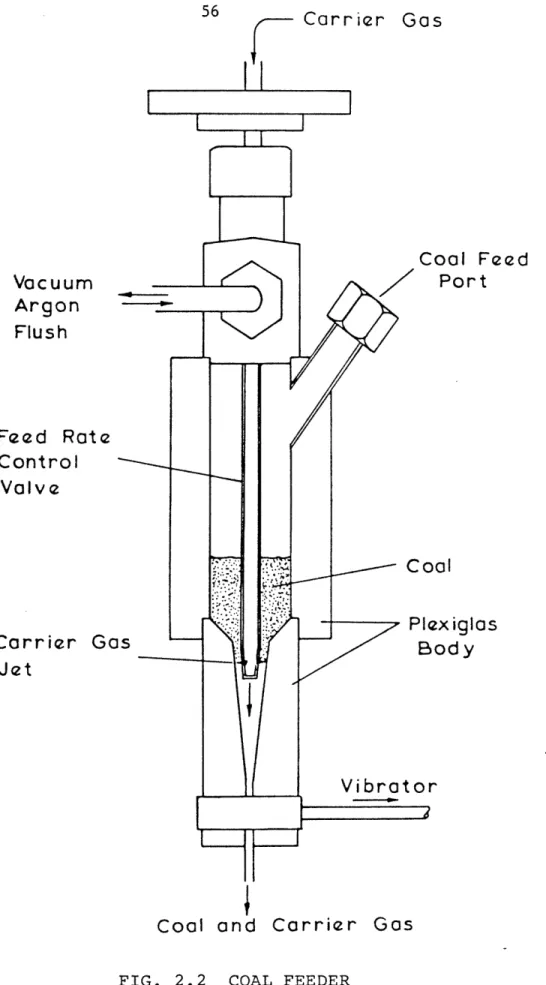
2.2 Laminar Flow Experiment 2.2.1 Coal Feeder
2.2.2 Particle Collector 2.2.3 Gas Preheater 2.2.4 Suction System
2.2.5 Experimental Procedure
2.3 Free Fall Experiment with Bronze Collector 2.3.1 Experimental Procedure
2.4 Free Fall Experiment with Alumina Collector 2.4.1 Experimental Procedure
2.5 Crucible Experiment
2.5.1 Experimental Procedure 2.6 ASTM Proximate Analysis Equipment 2.7 Coal Characterization
2.7.1 Electron Micrographs
2.7.2 Particle Size Distribution 2.7.3 Ultimate and Proximate Analyses
Page No. 17 17 19 19 27 36 46 48 51 51 51 51 52 53 55 57 59 59 59 61 64 65 65 68 70 70 72 72 77 82
3 ANALYSIS OF EXPERIMENTAL SYSTEM AND DATA REDUCTION 87 3.1 Velocities of Coal Particles Measured by a 89
Laser Doppler Anemometer
3.1.1 Initial Velocities of Coal Particles 93 3.1.2 Acceleration of Particles in Laminar 95
Flow Experiment
3.1.3 Particle Velocities in Free Fall 95 Experiments
3.2 Analysis of Temperature and Velocity Fields 98
3.3 Determination of Weight Loss 118
4 RESULTS 127
4.1 Weight Loss 127
4.1.1 Weight Loss of Coals 127
4.1.2 Weight Losses Determined by Using Ash 142 as a Tracer and Ash Losses
4.1.3 Effects of Sample Size on Weight Loss in 155 Crucible Experiment
4.2 Loss of Major Elements 162
5 DISCUSSIONS 181
5.1 Temperature-Time History of Coal Particles and 181 Effects of Heating Rates on Volatile Yields
5.1.1 Temperature-Time Histories of Coal 181 Particles in Laminar Flow Experiment
5.1.2 Heating Rates and Average Reaction 187 Temperature
5.2 Secondary Char Forming Reactions in the Gas 195. Phase and on the External Surface of Coal
5.2.1 Parameters Affecting the Secondary 195 Reactions
5.2.2 Implications from Crucible Experiments 1g9 with Different Bed Depth
5.3 Changes in Elemental Composition of Char and 201 their Implications to the Devolatilization
Mechanism
5.3.1 Comparison with Previous Observations 202 5.3.2 Possible Mechanisms of the Rapid 206
Chapter No.
5.4 Effects of the Transport Process of Volatile Matter in the Pores of Coal on Secondary Char Forming Reactions
5.5 Problems in Weight Loss Measurements Using Ash as a Tracer
5.6 Comparison of the Enhanced Volatile Yields with Those Reported in Previous Studies 5.7 Concluding Remarks
6 KINETICS OF DEVOLATILIZATION
6.1 First Order Arrhenius Parameters 6.2 Comparison with Previous Results
6.3 Comparison with the Rates of Decomposition of Pure Hydrocarbons 7 DEVOLATILIZATION MODELS 8 CONCLUSIONS Page No. 216 225 230 236 239 239 241 251 261 277 Appendices
A Characteristic Heat Transfer Times of Particles 280
B Results of Laminar Flow Experiment 285
C Results of Free Fall Experiments 295
D Results of Crucible Experiments 304
E Results of Ultimate Analysis of Char 312 F Particle Velocities Measured by a Laser Doppler 334
Anemometer
G Physical Changes of Coal During Devolatilization 338 H Enhanced Volatile Yield under Rapid Heating Conditions346
I Coal Characterization
357-J Listings of Computer Programs and Data Cards 379 REFERENCES
BIOGRAPHICAL NOTE
412
LIST OF FIGURES Figure No.
1.1 Enhanced Volatile Yields Observed by Different Investigators
1.2 Variation of Q with Temperature
1.3 Comparison of Devolatilization Rate Constants 2.1 Laminar Flow Furnace System
2.2 Coal Feeder
2.3 Water Cooled Collector
2.4 Free Fall Experiment with Bronze Collector 2.5 Free Fall Experiment with Alumina Collector and
Crucible Experiment
2.6 Axial Temperature Profiles in Free Fall and Crucible Experiments
2.7 Typical Temperature Time Histories in Crucible Experiment
2.8 Proximate Analysis Equipment and a Typical Temperature Distribution
2.9 Raw Montana Lignite 2.10 Polished Montana Lignite
2.11 Raw Pittsburgh Seam #8 Bituminous Coal 2.12 Polished Pittsburgh Seam #8 Bituminous Coal 2.13 Raw Lignite Rosin-Rammler Distribution
2.14 Raw Lignite Frequency Distribution
2.15 Raw Bituminous Coal Rosin-Rammler Distribution 2.16 Raw Bituminous Frequency Distribution
3.1 Conceptual Diagram of Main Flow Development in Laminar Flow Furnace
3.2 Laser Doppler Anemometer System for Velocity Measurement of Coal Particles
3.3 Typical Velocity Distributions of Coal Particles in Laminar Flow Furnace
3.4 Average Particle Velocities at Injector Tip
3.5 Average Coal Particle Velocities in Laminar Flow Furnace at Different Locations
Page No. 24 25 38 55 57. 59. 64 67 68-70 72 74 75 76 77 79 80 81. 82 89 91 93 95 97,
Figure No.
3.6 Average Coal Particle Velocities under "Free Fall" Conditions
3.7 Conceptual Diagram of Thermal Boundary Layer at Injector Tip
3.8 Schematic Diagram of Boundary Layers and Approximated Velocity Profile
3.9 Calculated Temperatures and Velocities 3.10 Calculated Temperatures and Velocities
3.11 Calculated Particle Temperatures and Residence Times 3.12 Flow Diagram of Devolatilization Experiments
4.1 Results of Laminar Flow Experiment, Montana Lignite 4.2 Results of Laminar Flow Experiment, Pittsburgh
Seam Bituminous Coal
4.3 Weight Loss at Different Temperatures, Lignite 4.4 Weight Loss at Different Temperatures, Bituminous 4.5 Maximum Weight Losses Observed under Different
Experiments, Lignite
4.6 Maximum Weight Losses Observed under Different Experiments, Bituminous Coal
4.7 Comparison of Directly Measured Weight Loss with Weight Loss Measured by Using Ash as a Tracer in Free Fall and Crucible Experiments, Montana Lignite 4.8 Comparison of Directly Measured Weight Loss with
Weight Loss Measured by Using Ash as a Tracer in Free Fall and Crucible Experiments, Pittsburgh Seam Bituminous Coal
4.9 Ash Loss in Crucible Experiments, Lignite
4.10 Ash Loss in Crucible Experiments, Bituminous Coal 4.11 Comparison of Directly Measured Weight Loss with
Weight Loss Measured by Using Ash as a Tracer in Laminar Flow Experiment, Montana Lignite
4.12 Comparison of Directly Measured Weight Loss with Weight Loss Measured by Using Ash as a Tracer in
Laminar Flow Experiment, Pittsburgh Seam Bituminous Coal
4.13 Comparison of Directly Measured Weight Loss with Weight Loss Measured by Using Ash as a Tracer in
Laminar Flow Experiment, Montana Lignite
Page No. '98 101 103 114 115 117 120 128 129 132 133 138 139 143 144 147 148 149, 150 153
Figure No. 4.14 4.15 4.16 4.17 4.18 4.19 4.20 4.21 4.22 4.23 4.24 4.25 4.26 4.27 4.28 4.29 4.30 4.31 5.1 Page No. Comparison of Directly Measured Weight Loss with 154 Weight Loss Measured by Using Ash as a Tracer in
Laminar Flow Experiment, Pittsburgh Seam Bituminous Coal
Weight Loss of Different Sample Sizes in Crucible 157 Experiments, Lignite
Weight Loss of Different Sample Sizes in Crucible 158 Experiments, Bituminous Coal
Weight Loss of Different Sample Sizes in Crucible 159 Experiments, Bituminous Coal
Percent of Element Retained in Char, Montana Lignite 163 Percent of Element Retained in Char, Pittsburgh 164 Seam #8 Bituminous Coal
Elements Retained in Char in Crucible Experiment, 166 Montana Lignite
Element Retained in Char in Crucible Experiment, 167 Pittsburgh Seam Bituminous Coal
Elements Retained in Char at Different Weight Losses, 169 Montana Lignite
Elements Retained in Char at Different Weight Losses, 170 Pittsburgh Seam Bituminous Coal
Changes in Elemental Ratios in Char with Time, 172 Montana Lignite
Changes in Elemental Ratios in Char with Time, 173 Pittsburgh Seam Bituminous Coal
Changes in Elemental Ratios in Volatile Matter with 175 Time, Montana Lignite
Changes in Elemental Ratios in Volatile Matter with 176 Time, Pittsburgh Seam Bituminous Coal
Changes in Elemental Ratios in Char with Weight Loss 177 Montana Lignite
Changes in Elemental Ratios in Char with Weight Loss 178 Pittsburgh Seam Bituminous Coal
Changes in Elemental Ratios in Volatile Matter with 179 Weight Loss, Montana Lignite
Changes in Elemental Ratios in Volatile Matter with 180 Weight Loss, Pittsburgh Seam Bituminous Coal
Weight Loss Versus Calculated Particle Temperature 183 Montana Lignite
Figure No.
5.2 Weight Loss Versus Calculated Particle Temperature Pittsburgh Seam Bituminous Coal
5.3 Schematic Diagrams of Weight Loss-Temperature Curves under Different Conditions
5.4 Effects of Heating Rate on the Average Devolatilization Temperature
5.5 Estimated Weight Loss-Temperature Histories Montana Lignite
5.6 Weight Loss Versus Initial Weight of Coal
in Crucible (Portal and Tan, 1974; Gray, et al.1974) 5.7 Loss of Elements During Carbonization
(Van Krevelen, 1961)
5.8 H/C Versus O/C Diagrams for Coalification and Carbonization (Van Krevelen 1961)
5.9 Change with Coal Devolatilization
5.10 Behavior of Hydrogen During Devolatilization, Montana Lignite
5.11 Behavior of Hydrogen During Devolatilization, Pittsburgh Seam Bitumimous Coal
5.12 Comparison of Enhancement in Volatile Yield
5.13 Different Coals and Enhancement in Volatile Yield 6.1 First Order Arrhenius Plot for Weight Loss,
Montana Lignite
6.2 First Order Arrhenius Plot for Weight Loss, Pittsburgh Seam Bituminous Coal
6.3 First Order Arrhenius Plot for Retention of
C, H, O. Montana Lignite
6.4 First Order Arrhenius Plot for Retention of C, H, O. Pittsburgh Seam Bituminous Coal 6.5 Comparison of Devolatilization Rate Constants 6.6 Variation of Devolatilization Rate Constants
for Different Coals
6.7 Variation of Devolatilization Rate Constants for Different Stages if Devolatilization 6.8 Comparison of Devolatilization rate Constants 6.9 Comparison of Devolatilization Rate Constants
for Pittsburgh Seam HVBituminous Coal
.Page No. 184 186 192 194 200 204 207 208 213 .214 231 234 241 242 244 245 246
248
250
252253
Figure No. Page No. 6.10 Comparison of First Order Devolatilization 254
Rates with Those for Decomposition of Pure Hydrocarbons
6.11 Apparent First Order Rates Approximated 256 for Hypothetical Three First Order
Parallel Reactions
6.12 First Order Arrhenius Rates Evaluated at 258 Same Weight Loss Levels.
Montana Lignite
6.13 First Order Arrhenius Rates Evaluated at 259 Same Weight Loss Levels.
Pittsburgh Seam Bituminous Coal
7.1 Comparison of Model Curve Fit with Experimental 270 Data for Montana Lignite
7.2 Comparison of Model Curve Fit with Experimental 27.1 Data for Pittsburgh Seam Bituminous Coal
7.3 Comparison of a Single Overall Reaction Model 273 with Experimental Results
7.4 Comparison of Model Curve Fit with Experimental 274 Data for Pittsburgh Seam Bituminous Coal
7.5 Comparison of Calculation H/C and O/C Ratios 275 with Experimental Data for Pittsburgh Seam
re No. P;
A.1 Characteristic Heat Transfer Times to a Particle B.1 Illustration for Residence Time Correction
C.1 Schematic Diagram of the Distribution of Char and Condensed Material in the Bronze Filter
E.1 Elements Retained in Char at Different Weight Losses Pittsburgh Seam Bituminous Coal
E.2 Changes in Elemental Ratios in Char with Weight Loss, Pittsburgh Seam Bituminous Coal
E.3 Changes in Elemental Ratios in Volatile Matter with Weight Loss, Pittsburgh Seam Bituminous Coal G.1 Bubble Development, Pittsburgh Seam #8 Bituminous
Coal
G.2 Void Development with the Pittsburgh Seam #8 Bituminous Coal
G.3 Electromicrograph of a Devolatilized Bituminous Coal Particle
G.4 Photomicrographs of a Devolatilized Coal: A Single Bituminous Coal Particle; A Collection of Lignite Particles
G.5 Void Development with Temperature, Pittsburgh Seam #8 Bituminous Coal, Free Fall to Cup
G.6 Agglomeration, Pittsburgh Seam #8 Bituminous Coal
Figui age No.
284 286 300 331 332 333 340 341 342 343 344 345
LIST OF TABLES
Table No. Page No.
1.1 Coal Types and the Sources of the Data Shown 38 in Fig. 1.3
1.2 General Hypothetical Scheme for Coal Pyrolysis 45
2.1 Summary of Operating Conditions 62
2.2 Particle Size Distribution 82
2.3 Coal Characterizations 83
2.4 Characterization of Montana Lignite 84
2.5 Bituminous Coal 85
2.6 Results of Proximate Analyses 86
3.1 Calculated Heating Times of Particles 117 4.1 Measured Weight Loss of Different Sample Sizes 160
in Crucible Experiments at 1220°K
5.1 Estimated Weight Loss of Coal by Loss of 210 Functional Groups
7.1 Classification of Possible Kinetic Models 262 for Devolatilization
B.1 Results of Laminar Flow Experiment, Montana Lignite 287 B.2 Results of Laminar Flow Experiment, Pittsburgh 291
Seam Bituminous Coal
C.1 Results of Free Fall Experiment with Alumina 296 Collector, Sample Predried at 105°C for 2-48 Hours
C.2 Results of Free Fall Experiment with Alumina 297 Collector, Montana Lignite
C.3 Results of Free Fall Experiment with Alumina 298 Collector, Pittsburgh Seam Bituminous Coal
C.4 Measured Weight Loss in Free Fall Experiment with 302 Bronze Collector (d.a.f.)
D.1 Results of Crucible Experiment 305
D.2 Results of Crucible Experiment, Montana Lignite 306 D.3 Results of Crucible Experiment, Effects of Bed 308
Depth, Montana Lignite
D.4 Results of Crucible Experiment, Pittsburgh 309 Seam Bituminous Coal
Table No.
D.5 Results of Crucible Experiment, Effects of Bed Depth, Pittsburgh Seam Bituminous Coal
E.1 Results of Ultimate Analysis of Char, Montana Lignite
E.2 Results of Ultimate Analysis of Char, Pittsburgh Seam Bituminous Coal
E.3 Results of Ultimate Analysis, Pittsburgh Seam Bituminous Coal
F.1 Results of Particle Velocity Measurements H.1 Weight Loss of Various Coals in a Laminar Flow
Furnace
H.2 Weight Loss of Coals at Different Temperatures in a Laminar Flow Furnace
H.3 Weight Loss of an Elkol Coal in a Transport Reactor H.4 Weight- Loss of a High-Volatile A Bituminous Coal
in an Argon Plasma
H.5 Weight Loss of Various Coals in a Hydrogen Plasma H.6 Weight Loss of a High-Volatile B Utah Coal
in an Entrained Flow Reactor with Hydrogen-Oxigen Combustion Gases
H.7 Weight Loss of Various Coals by Pulse-Heating in a Wire-Screen Heating Element
H.8 Weight Loss by an Eletrically Heated Wire Screen under Various Atmospheres
H.9 Weight Loss of Various Coals by Microsample Strip Furnace
H.10 Weight Loss of Various Coal in an Electrically Heated Wire Screen
I-1 ASTM Coal Rank
I-2 Ash Characterization
I-3 Functional Group Analysis of a Lignite
I-4 Functional Group Analysis of a High Volatile Bituminous Coal Page No. 311 3-I3 320 335 347 348 349 350 351 35Z 353 354 355-356 358-366; 368 33_75 I
CHAPTER I
INTRODUCTION
1.1 Background
Coal is one of the only viable options for supplying increased energy requirements in the near future. Currently about 20 percent of the total
energy supply in the United States comes from coal. Some studies (Nail, et al., 1975) project that a substantial portion of the total energy may be supplied by coal at the turn of the century. The dwindling reserves of oil and gas, difficulties in developing nondepletable and clean energy sources, and large capital investments required for new systems, make coal the most important source of energy in the middle range energy policy. Currently the main use of coal is the generation of high temperature high pressure steam in industrial boilers. The proposed uses of coal include
gasification, liquefaction and advanced combustion systems such as coal-fired magnetohydrodynamic (MKD) power generation and fluidized bed
combustors (Hottel and Howard, 1972). In most of the systems, coal is pulverized and injected into a hot environment. The volatile matter in coal particles comes out at a significant rate upon rapid heating.
The total amount of volatile matter produced by devolatilization depends mainly on the type of coal, the temperature of the surrounding gas and the size of coal particles. Under conventional laboratory heating conditions such as those of the ASTM proximate analysis test, a typical high-vola- i tile bituminous coal yield 30 to 40 percent by weight volatiles by
thermal decomposition. In contrast to this behavior, volatile yields significantly larger than the proximate volatile matter obtained under
certain conditions. For example, some data of the British Coal Utiliza-tion Research AssociaUtiliza-tion (BCURA) Kimber and Gray, 1967) indicate the volatile yield may be as high as 70 percent when finely ground coal particles are injected into hot combustion gases of 2000°K or more.
Although the total burning time or gasification time of coal particles is dominated by the relatively slow char gasification, the amount of char to be consumed and therefore the residence time is determined by the devola-tilization step. Any increase in volatile yield would shorten the overall burning time. This is particularly important for coal fired MHD
combustors, where the attainment of high temperatures through efficient combustion and minimal heat loss to the wall is critically required. Also, the ignition mechanism of the coal particles is closely related to
the devolatilization process (Howard and Essenhigh, 967; Nettleton and Stirring, 1967). Therefore the informations on the rate of volatile yield under various conditions are indispensable for proper designs of combustion chambers.
Enhanced volatile yield could improve the efficiency of synthetic gas production from coal. The Garrett flash pyrolysis process (McMath, et al., 1973; Adam, et al., 1973) does indeed achieve increased volatile yields. The rapid reaction is achieved by mixing pulverized coal with hot recycled char, yielding both gas and char as products. The volatile field reported at 17000F was about 41 percent (on a dry basis) of volatile yield, as compared to 30 percent proximate volatile matter. In Synthane (Bureau of Mines), Hydrane (Bureau of Mines), and Bigas (Bituminous Coal Research,
dispersed phases by mixing with hot gases (Hottel and Howard, 1971). Larger yields in volatile matter, therefore, would reduce the amount of char which has to be gasified in the succeeding steps. Other applications of rapid devolatilization reactions include coal gasification in a
chemical regenerative MHD cycle (Gannon, et al., 1974), where the thermal energy of the hot MHD exhaust gas is transformed into chemical energy of
the fuel gas through gasification of coal.
In spite of these practical interests, little research has been carried out at high temperatures, and the mechanism of rapid devolatili-zation is still poorly understood. More extensive research is needed in order to confirm the observed enhanced volatile yield and to clarify the conditions required to achieve the effect in practice.
1.2 Literature Review
1.2.1 Enhanced Volatile Yields and Experimental Techniques
Augmentation in volatile yield under rapid heating conditions has been observed by different researchers using various experimental techniques. These include entrained flow reactors (Coates, et al., 1974; Stickler, et al., 1974; Badzioch and Hawksley, 1970; Kimber and Gray, 1967; Eddinger, et al., 1966) and electrical screen heating (Mentser,
et al., 1974; Anthony, et al., 1974; Loison and Chauvin, 1964).
Badzioch and Hawksley (1970) measured the extent of thermal decomposition of size graded coal particles in the pulverized-fuel size range using a laminar flow vertical furnace for 11 different coals.
Coal particles are injected with cold carrier gas along the axis of the preheated nitrogen stream in a cylindrical alumina tube. The ambient gas temperature ranged from 400°C to 10000C and the particle residence time
from 30 to 100 milliseconds. They determined the weight loss and the change in volatile matter using ash as a tracer. The experimental data were correlated by the following empirical equations. (Symbols are
changed to conform with the notation in this thesis.)
E
AV = V (l-D)[1-exp(-Be t)] (1.1)
AW = Q AV (1.2)
D exp[-K1(T-K2) (1.3)
where V is the proximate volatile matter of original coal, determined by the standard proximate analysis test, on a dry ash-free (d.a.f.) basis and AV, AW, T and t denote change in volatile matter (d.a.f.), weight loss
(d.a.f.), temperature of a coal particle (°K) and decomposition time (sec.) respectively. D is the fraction of volatile matter remaining in char and K1, K2, B and E are constants depending on the kind of coal. As a ratio of weight loss to the differences between proximate volatile matter in original coal and that in char they found a constant Q for each kind of coal ranging from 1.3 to 1.8. For weakly-swelling coals, D did not depend on temperature appreciably and could be set equal to 0.14.
Kimber and Gray (1967-a, 1967-b) measured weight loss and change in volatile matter using the same kind of vertical furnace. The reactor temperature ranged up to 22000K. They found that for the low-rank coal
(N.C.B. Coal Rank Code No. 902) Q varied between 1.3 to 1.95 for a single kind of coal depending on the furnace temperature. The maximum yield reached more than 70 percent (d.a.f.) at 21700K.
Although the factor Q is a convenient tool to estimate weight loss under rapid heating conditions, by performing the proximate volatile test for char, it is not necessarily a good measure of the enhancement in volatile matter. The ratio of the asymptotic value of weight loss
measured at very long reaction time at a particular set of devolatiliza-tion condidevolatiliza-tions to the proximate volatile matter may be defined as the enhancement factor, fE'
AW
E V (1.4)
0
where AW is the asymptotic weight loss. In practical cases, however, asymptotic values of weight loss may not be reached within the experi-mental reaction time. When this is the case, the proximate volatile matter of char may be added to the measured weight loss to give an
approximate enhancement factor
ff = AW+D
E V0 (1.5)
The true enhancement factor may or may not be greater than f, depending on the specific conditions. It should be noted that the factor Q becomes equal to the true enhancement factor only when the same ratio of enhance-ment occurs to the remaining volatile matter in char (i.e., if yield of volatile matter from char, when the experimental reaction time is
extended long enough, becomes Q · D). The ratio of measured weight loss to the proximate volatile matter of coal may be used as an enhance-ment factor in the absence of the proximate volatile matter test of char.
(1.6)
In using R as a measure of enhancement, the remaining volatile matter in char has to be small compared to the original volatile matter. It should be noted that
>9 f > R (1.7)
holds in general.
In Appendix H, these enhancement factors are calculated for weight losses observed under various experimental conditions and summarized in Tables H.1 to H.10. Figure 1.1 shows R versus the proximate volatile matter of coal. Badzioch and Hawsley's results appear to indicate larger
enhancement with smaller proximate volatile matter. But Mentser's
results, which were measured using an electrically heated wire-screen in vacuum, do not exhibit such trend. Since the amount of volatile matter
remaining in char is not known for Mentser's coals, any conclusion can not be drawn (see Tables H.1, H.7 and H.8 for details). Figure 1.2 shows
the temperature dependence of the Q factor. Both Kimber and Gray (1967-a) and Eddinger, et al. (1916) used entrained flow reactors (see Tables H.2 and H.3). but Eddinger reported significant interactions between the volatile products and the reactor wall, which caused an apparent decrease in weight loss at higher temperature through the formation of solid
carbon by thermal cracking of the volatile matter. If a 60 percent weight loss is used at 15700K furnace temperature (as estimated by Eddinger), all the data points follow the dotted line. The rapid increase in Q with temperature should be noted.
Large volatile yields at high temperatures were also observed by the injection of coal particles into hot combustion gases. Coates, et al.,
23
4
0
OE
0
0
O I O0
o
0
0
a00
0
0
0
* O30
0
0
C H Z;VF
0 X0
H
0.
OO D C r ) WI-O <(
O -Oo
x
a- Z° M Cjo 0 0 *eo 0Co
o (C' .N · _83i11
VV
311V10A
31VAW
IXOld
01
SSO1
1JH913M
dO
OlI
V
I-0
I)
O0 N mo
[
U b 0 oo
O t: I', O -0O4 CM c-o § cN C& C0
1.,
0
c
. E + + eO _ _0
r4:
I I I I III I I I I I I I I I ! I !24' E
0
\0
EE E_
(0 A3 0--OOOO
M C i C O.. ., ' 6000
+'
'{3O
Qw
\
0. C O 0 .D L. 0 Lo
0 U I-O UQ / <3 o Io
o
o
(n w O ElO
to
.
0 X . EH w -a: : z E Wu
H
< >Z
Z
o
O _e CN H H H 444 OOO
O ' (0 c 0 0 _I: _9_-311VVt
311V10A
NI
3N'VHD
01
SSO-1
HI3M
.O
OlVt
.0 (,0
O'O
.0 EO
0
Or
(CV O NM0
I 1 I I I Iir
Lt. 41 I I I I1974, studied rapid revolatilization and product composition using a hydrogen-oxygen flame (Table H.6). Weight losses in excess of 60
per-cent were reported for a coal with 39 perper-cent d.a.f. proximate volatile matter. Stickler, et al., 1974, reported more than 70 percent weight loss for a coal injected into the combustion products of a benzene/air mixture. In both cases contributions of heterogeneous reactions were estimated to be small. The trend in Fig. 1.2 indicates further increase in weight loss at higher temperatures. Graves, et al., 1966, injected pulverized coal into argon plasma in an attempt to achieve high yield of acetylene. Though the average plasma temperature ranged up to 90000K, the particle temperature was much lower due to the heat transfer limita-tion and the maximum value of Q obtained was 1.73 (Table H.4). In a hydrogen arc, Stickler, et al., 1974, reported values as high as 2.22 (Table H.5). But the volatile matter in the char was high so that the corresponding value of R was only 1.34. The maximum amount of weight loss they obtained was 71.7 percent from a high volatile coal with 41.4 percent proximate matter.
Despite the fact that many researchers have observed enhanced volatile yields, only few of them were able to provide data on the kine-tics of the rapid devolatilization. Experimental difficulties in
achieving rapid quenching as well as rapid heating under the well con-trolled conditions made it very difficult to study the transient behavior of the rapid devolatilization. Among the experiments with flow reactors (Coates, et al., 1964; Badzioch and Hawksley, 1970; Kimber and Gray, 1967-A; and Eddinger, et al., 1966), only Badzioch and Hawksley measured
weight losses during transient periods of devolatilization. In their study, however, weight losses were calculated using ash as a tracer, because of the particle loss to the collector wall occurred as a
conse-quence of the softening of coal under transient devolatilization stages. Since ash is neither a well defined material, nor is it a mixture of pure metal oxides, accuracy of the ash tracer method is somewhat
questionable even at temperatures below 10000C. The temperature of the coal particles was assumed to reach the main gas temperatures in 20 msec after the injection, which was estimated from a separate experiment measuring the "diffusion" time of carrier gas (02) into the main gas
(N2 ) in simulated experimental conditions. Such an estimation is open
to doubt, since the exact similarity between the concentration and the temperature did not exist because of differences in boundary conditions
(i.e., thermal boundary layer development on the insulation of the water cooled injector and effects of particles). Also, they did not account for the cooling period, which might have been as important as the heating period. Therefore the accuracy of the kinetic parameters derived from their results is somewhat questionable.
Fixed sample techniques such as electrically heated wire screens normally give better control in monitoring the temperature of coal particles during devolatilization. Anthony (1974) measured weight losses under transient stages of devolatilization by an electrically heated wire screen, and kinetic parameters were obtained by a noniso-thermal technique using measured temperature-time histories of coal particles. Although the temperatures of coal particles are more
reliable than those of Badzioch and Hawksley, his system has its inherent problems. Heat and mass transfer mechanisms are quite different from actual systems, where particles are injected into hot gases, and inter-actions of coal particles and volatile matter with the hot screen is unavoidable. Thus, applications of the results to actual systems require special interpretations. Another problem was the slow quenching times
(typically a few seconds), compared to the fairly high heating rates (up to 10,000°K/sec). The transient weight losses he obtained, there-fore, were limited to those of low temperatures (below 7000C) and long reaction times (more than 1 sec).
In view of the limitations mentioned above, there is a need for experimental studies in weight loss of coal under well controlled atmosphere, in a temperature range applicable both to gasification and combustion systems with a good time resolution in order to provide the better understanding of the kinetics of rapid devolatilization.
1.2.2 Devolatilization Mechanism
Devolatilization of coal is a very complicated phenomenon involving numerous chemical reactions coupled with physical escape of volatile matter through the micropores in coal. One of the difficulties in studying coal is that the chemical structure of coal itself is not well defined, which tends to obscure the true mechanism of any physico-chemical phenomena associated with coal. Hence a brief review on the structure of coal may help understand the devolatilization mechanism.
The chemical structure of coal varies widely depending on the original plant structure and the geological conditions during the
coalification process. Because of its complexity and nonuniformity, efforts have been made to describe coal in terms of statistical average quantities such as the fraction of aromatic carbon (carbon aromaticity), the fraction of hydrogen bonded to aromatic carbon (hydrogen aromaticity) the size of the aromatic cluster and the average number of rings per structural unit (Van Krevelen, 1961). Various physical and chemical methods have been used to elucidate the structure, but completely satis-factory results have not yet been obtained. The general consensus
(Tingey and Morrey, 1973) is: (1) that coal consists of an aromatic-aliphatic lamellar structure with only three to five condensed rings per lamella, (2) that sulfur and nitrogen are incorporated into hetero-cyclic rings, and (3) that oxygen exists mainly as hydroxyl and carbonyl groups. About 70-85 percent of total carbon in the bituminous range is reported to be aromatic, 10-25 percent is hydroaromatic, and 4-5 percent is aliphatic. Aromatic carbon increases with increase in rank, but the sum of the aromatic and hydroaromatic fractions is almost constant in coals of 80-90 percent carbon content (on a d.m.f. basis). (Mazumdar, et al., 1966.) More recently, Chakrabartty and Berkowitz (1974) proposed a structural model of coal as a modified bridged tricycloalkane system. The theory was based on oxidation studies of coal with sodium hypo-chlorite (Chakrabartty and Kretschmer, 1972, 1974), which indicated that coal is largely made up of nonaromatic structures. The authors claimed that such a model is not inconsistent with the experimental evidence now regarded as pointing to aromatic structure, since data are generally
Although the possibility of the predominant non-aromatic structure of coal may not be excluded, the evidence for it is not strong. The claim that sodium hypochlorite oxidation is exclusively restricted to
non-aromatic carbon structures has been seriously questioned by other investigators. (Ghosh, et.al., 1975; Landolt, 1975) In the present study coal will be viewed as a predominantly aromatic substance in interpreting the experimental results.
Much of the past studies on devolatilization mechanism were done in relation to industrial coking operations, where heating rates were slow (less than 100C/min) and final temperatures were relatively low (mostly below 1000°C). Although quantitative extrapolations of these results to rapid heating conditions encountered, for instance, in
pulverized coal flames may lead to significant deviations from observed behavior unless a proper model is employed in the extrapolation,
fundamental mechanisms found under the low temperature slow heating conditions may still play important roles under high temperature rapid heating conditions. A brief summary of the slow devolatilization studies may be worthwhile. More extensive reviews may be found elsewhere. (Badzioch, 1967, Yellow, 1965, Jones, 1964, and Howard, 1963.)
Van Krevelen et al. (1951) observed two different stages of devolatilization by heating coals at 2C/min, 'primary' reactions which took place between 400 and 500°C producing mainly tar and 'secondary' reactions (above 5000C) producing gases rich in hydrogen. For caking coals, the primary stage is coupled with physical softening of the coal.
Through extensive studies of coal model compounds, Van Krevelen (1961) concluded that the two stages are governed by the numerical content of aliphatic and aromatic hydrogen in coal. The primary devolatilization is a depolymerization process in which aliphatic bridges are ruptured with simultaneous transmission of hydrogen (disproportionation). The
structual units to which this hydrogen is transmitted evaporate as tar, or recondense and yield semi-coke. The formation of tar terminates completely when the original aliphatic hydrogen atoms in the reaction mixture have been used up. Reactive oxygen groups such as OH groups, which are richer in low rank coals, decrease tar yield by consuming
available hydrogen through dehydration thus promoting condensation of aromatic nuclei. Low tar yields of high rank coals are explained by physical limitation of the structual units being too large to evaporate. This mechanism agreed well with other studies. Den Hertog and Berkowitz (1960) concluded from their data on coal carbonization in the presence of nitric oxide that free radical mechanisms occur during the primary devolatilization. Depp, et. al. (1956), through studies of coal model compounds, concluded that free radical rupture of week carbon-carbon linkage such as methylene bridge linking aromatic units is an important step in pyrolysis of coal at low temperatures. Importance of physical factors during carbonization was stressed by many researchers.
Carbonization under reduced pressure typically yields larger amount of tar containing high molecular weight products, while the reverse is
true under high pressures (Howard, 1963). Such phenomenon was
interpreted as the result that rapid escape of the primary tar under reduced pressure diminish the chance of secondary reactions such as
condensation or polymerization of the tar within the coal (Jones, 1964). Different explanations exist on the origin of the high molecular weigh volatile matter. Orning and Greifer (1956) suggested distillation of some portion of coal without changing the original structure, based on the close resemblance. of the infra-red spectra of the primary tar obtained under high vacuum and those of the parent coal. The other possibility is that small fragments, such as the smaller free radicals
and unsaturated compounds broken off from larger molecules by pyrolysis, polymerize to form large molecule weigh products. (Billington, et. al.
1952). Berkowitz (1960) concluded that pore diffusion of the volatile matter is the rate controlling factor, from thermogravimetric
measurements of about 600 to 2000 size coal at temperatures between 253°C and 524°C. Deviations of measured weight loss curves from a first order reaction model were explained in terms of internal pressure build-up (as high as 200 atm) of volatile matter. Peters (1963) suggested that the heat transfer limitation caused by the latent heat of
evaporation of volatile matter is the controlling factor for 1.5 mm coal particles devolatilized with heated sand.
Evolution of gases during pyrolysis has been studied to elusidate the mechanism of devolatilization in relation to the structure of the coal. Fitzgerald and Van Krevelen (1959) measured the rates of
evolution of hydrogen, methane, hydrocarbones up to C4, and the oxides
of carbon, from samples of coal heated from 300°C to 7000C at a constant rate (1.8°C/min) in a static bed under reduced pressure. Assuming a first order reaction for each gas, Arrhenius plots were derived, which indicated more than one reaction contributed to the formation of some of
gases. From the analyses of the Arrhenius plots the authors linked the evolution of the gases to the structure of the coal as follows.
"Hydrogen -- Each hydrogen molecule originates from two peripheral sites, upon breaking of a C-H bond, followed by hydrogen molecule formation. The molecule formation is assumed to be faster than the bond breaking process.
Hydrocarbons -- Each hydrocarbon molecule originates from two peripheral sites, upon breaking of the appropriate carbon-radical bond, and the breaking of a C-H bond, followed by molecule formation. A portion of the methane is formed by autohydrogenation, for which the necessary hydrogen comes from four peripheral sites.
Carbon monoxide -- The carbon monoxide appearing below 500°C is thought to be derived from oxygen replacing carbon in the periphery of lamellae, so that no peripheral sites are vacated.
Carbon dioxide -- Carbon dioxide comes from a carboxyl group, without vacating a peripheral site.
Water -- Water comes from hydroxyl groups and hydrogen, thus vacating two peripheral sites."
-- Berkowitz and den Hertog (1962) investigated the kinetics of hydrogen evolution in some depth. In order to avoid the formation of hydrogen by secondary reactions, the tar was removed by preheating the coal prior to the measurement of hydrogen. The reaction was assumed to be first order with respect to the remaining hydrogen, and activation energies around 8-15 Kcal/mol were obtained. The observed low
a bimolecular process which occurs whenever two contiguous carbon lamellae move into an appropriate configuration.
JUntgen, Van Heek and their coworkers (JUntgen and Van Heek, 1970, 1969, 1968; Hanbaba et al., 1968) investigated gas release from coal and other substances at constant heating rates between 10-2 and 10 5C/min. From the detailed analyses of gas evolution rates - temperature curves combined with mathematical techniques, they suggested that hydrogen evolution can be interpreted as a combination of numerous overlapping first-order reactions with statistical distribution of the activation energy. The shape of the methane release curve was characteristic of a mixture of different reactions, Higher hydrocarbons mostly had simple curves which could be explained by a first-order reaction. (JUintgen and Van Heek, 1968). However, in the later publications the apparently simple curves are shown to be results of many overlapping reactions. Importance of pore diffusion and nonisothemality for large particles was stressed as it could influence the gas release significantly.
The mechanism of rapid devolatilization in a dispersed phase was first investigated by Russian researchers, (Chukhanov, 1954; Shapatina et al., 1960). Finely ground particles were dropped in a vertical furnace tube in an inert atomosphere collected in a dish and kept at a known temperature (about 250-5500C) for a certain duration (0.15-2 hours),
followed by rapid quenching by water. Shapatina divided the rapid devolatilization into three stages:
(1) Rapid carbonization proceeding at a very high rate in the initial 0.1 sec (1-2 order of magnitude greater than the 2nd stage).
(2) Principal thermal decomposition proceeding at a relatively low rate during 2-3 min.
(3) "Degassing" of coal proceeding at a long time (hours). Interpretations of each step in relation to the structure of coal were not given. But it was noted that pyrogenic water was the main product in the initial 0.1 sec. Chukhanov, in modeling the devolatilization by five sets of independent reactions, assumed that the decomposition of oxygen groups in coal is responsible for the rapid stage, characterized by the evolution of carbon dioxide and water. The initial rapid
evolution of volatile matter under rapid heating conditions was also observed by injecting coal particles into a fluidized sand bed. (Stone
et al., 1954).
The enhanced volatile yields discussed in section 1.2.1 have been explained in several different ways.
(1) Rapid escape of the initial volatile products minimizes further reactions inside the coal which could produce involatile residue.
(2) Rapid heating to a high temperature causes rupture of the bonds in the coal structure, producing a considerable number of large radicals. (Chukhanov, 1954).
(3) Under slow heating conditions, the structure of coal changes to a more ordered one through crosslinking, which binds a material that could escape under rapid heating.
(Gray et al., 1974).
(4) Secondary cracking of the volatile matter on the external surface of coal diminishes overall yields in a dense
packed bed of particles, which is a typical experimental condition for slow heating.
The first explanation was most commonly used (Badzioch, 1967, Yellow, 1965, Jones, 1964). Loison and Chanvin (1964) assumed that some of the initial products are too large to evaporate, which are ejected or escape in some other way from the coal before they can decompose. Van Krevelen and coworkers (1959) noted that some of the "metaplast" is carried away as a tar mist by gaseous products, which increases with the rate of gas evolution. Larger volatile yields observed under a reduced pressure
(Dryden and Toy, 1961) also favors the explanation. More recently Anthony (1974) reached the same conclusion from an experimental study involving rapid heating of coal in an electrically heated wire screen under different atomospheres. For the hvA bituminous coal, volatile yields increased under reduced pressures and further increase was obtained under high pressure hydrogen atomosphere. Hydrogen was considered to interrupt the secondary reactions leading to char
formations. For the lignite, however, no effect of pressure was observed in inert atomoshperes. Although much experimental evidence appears to support the hypothesis, the effects of rapid heating on the
secondary char forming reactions have been neglected almost completely. Rapid devolatilization requires rapid heating, which increases the effective devolatilization temperature and hence the rates of the
secondary reactions. Rapid production of volatile matter could increase the partial pressure of reactive species inside the coal, which also could enhance the secondary reactions. In view of these facts the simple qualitative interpretation that "rapid devolatilization causes
rapid escape" requires a critical examination.
Hypotheses (2) and (3), although possible, lack experimental support. The external cracking of volatile matter, hypothesis (4), was observed by various investigators (Gregory and Littlejohn, 1965; Gray et al., 1974; Anthony, 1974). However, the extent of this external effect is not enough to explain the large enhancements.
In summary, the proposed mechanisms for the enhanced volatile yields contain several unresolved questions, especially the detailed
analyses on the transport mechanism of the volatile matter.through coal pores and the influences of rapid heatings on the secondary reactions. Both experimental and theoretical analyses are required to establish more satisfactory mechanisms.
1.2.3 Devolatilization Models
The simplest and the most commonly used model for correlating the kinetics of volatile yield is a first order overall reaction with Arrhenius rate constants. The rate of volatile yield was assumed to be proportional to the remaining volatile matter.
dV
= k(V - V) (1.8)
k = B - E /RT (1.9)
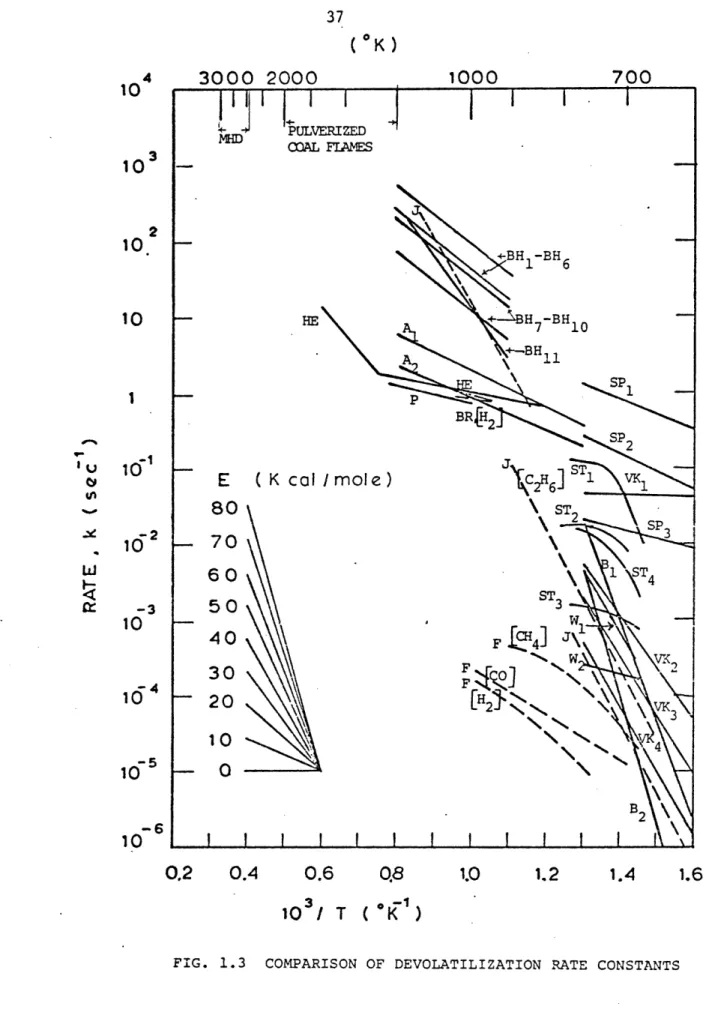
where V, V , B and E denote volatile matter, total amount of volatile matter evolved at a long reaction time, frequency factor and activation energy. In Fig. 1l3 some of the Arrhenius parameters obtained under various experiments in the past are shown. The sources of the data are
tabulated in Table 1.1. Wide discrepancies of several order of magnitude in rates are evident. Some of them may be attrbuted to the differences
10
1c
IC10
I4
3000 2000
3 2 1tO
-2
10
-310
10 4-5
10
1-6
10
0.2
0.4
0.6
0.8
10
3/ T ( K
)
1.0 1.2FIG. 1.3 COMPARISON OF DEVOLATILIZATION RATE CONSTANTS
( K)
1000
700
'vIn
i-1.4
1.6
ITABLE 1.1
COAL TYPES AND THE SOURCES OF THE DATA SHOWN IN FIG. 1.3
Anthony (1974)
Al: Pittsburgh Seam Bituminous Coal A2: Montana Lignite Boyer (1952) B1: Dourges Coal B2: St. Fontaine Coal VM(%d.a. f.) 46.2 46.2 22.5 36.0
Badzioch and Hawksley (1970)
BH -BH6: Coal "E" - "K" ighly swelling
1 6~ bituminous coals)
BH 7-BH : Coal "A" - "D" (eakly swelling
7 10 bituminous coals) BH l: Coal "L" (semi-anthracite)
17.7 - 35.3
36.1 - 42.0
11.5
BR : Berkowitz and Den Hertog (1962)
"No 1" (a low volatile bituminous coal
from the Cascade area of Southern Alberta) (H2 evolution from devolatilized coal)
F : Fitzgerald (1956)
(CH4, CO, H2 evolution)
"Coal E" (vitrinite of coking coal)
HE : Howard and Essenghigh (1967)
Pittsburgh Seam Bituminous Coal
J : JUntgen and Van Heek (1967)
23.3
37.4
Ethane evolution at three different heating rates 19.1
Al, A2:
B1, B2:
P : Peters and Bertling (1965)
"From Fig. 8."
SP1-SP3:
ST1- ST4 :
Shapatina, et al. (1960) Moscow District Brown Coal
(Three different stages of devolatilization)
Stone, et al. (1954)
ST1-ST3: Pittsburgh Seam Bituminous Coal
ST4 : Colorado Coal
Van Krevelen, et al. (1951) VK1 : Brown Coal
VK2 : Bituminous Coal, low rank
VK3 : Bituminous Coal, high rank VK4 : Semi-anthracite
W1, W2: Wiser, et al. (1967)
Utah High Volatile Bituminous Coal (W1: first 60 min; W2: 60-160 min)
47.5 (% dry) 50.2 42.2 41.5 51.0 39.5 18.8 14.2
in the structure of coal and physical factors such as the particle size. However, the extent of the discrepancies both in rates and activation
energies appeared to be too large to be explained solely by these factors. Above 1250K the only kinetic data available are those of Howard and Essenghigh (1967), which was obtained from a pulverized coal
flame. Since the devolatilization proceeded with simultaneously oxida-tion of char by heterogenous reacoxida-tions, the reducoxida-tion of the data
required special assumptions on the nature of the heterogenous reaction. Hence the reliability of the parameters is open to question. Considering
these facts, (1) close examination of the relatively low temperature data with an attempt to explain some of the discrepancies, and (2) dependable experimental measurements of rapid devolatilization above 1250K appeared to be very important.
More complicated models involving more than one reaction have been developed in order to describe different aspects of devolatilization phenomena. Van Krevelen and his coworkers (Fitzgerald and Van Krevelen,
1959; Chermin and Van Krevelen, 1957; Van Krevelen et al., 1956;
Fitzgerald, 1956; Van Krevelen et al., 1956, 1951) developed a model for carbonization describing both placiticity of coal and volatile yields by consecutive reactions (Fitzgerald and Van Krevelen, 1959).
k Secondary Tar Primary Tar 4+
k
k
Coal Metaplast (lo)Gas
(Sem + oke[i)-C=
w(Semi)
-Coke
41
fluidity of coal. Quantitative evaluation of the first three rate constants, kl, k2 and k3 were done for some coals assuming first order reactions (Chermin and Van Krevelen, 1957) and good agreements with the experimental results were obtained. For the gas evolution, k3, the activation energy was assumed to increase with the progress of "degassing," arguing that weaker bonds rupture initially leaving stronger bonds gradually. Although the model was developed for slow carbonization conditions, the authors noted that some of the metaplast was carried away as a tar mist, the amount of which was assumed to be proportional both to the amount of metaplast present and to the rate of degasification obtained at the moment (Chermin and Van Krevelen, 1957).
In this model, the final yields differ by the amount of metaplast carried away under different conditions, predicting larger volatile yield under rapid heating conditions. However, such concept may not be valid in explaining the increased volatile yield observed for non-caking
coals (Kimber and Gray, 1967; Eddinger et al., 1966).
Instead of the consecutive reactions, multiple parallel inde-pendent reactions have been used by several investigators. Chukhanov
(1954) postulated five first order reactions with different activation energies and frequency factors, each representing a certain product of devolatilizationo Recognition of numerous reactions associated with raptures of various bonds with different energy levels led Pitt (1962)
to employ a large number of independent reactions with a particular distribution of activation energies. His method involved a curve fit of
distribution curve assuming a constant frequency factor of 1015 min -1 . JUntgen and Van Heek (1970, 1969, 1968) advanced a mathematical technique of analyzing reaction kinetics under non-isothermal conditions with
applications to coal devolatilization at various heating rates. The proposed mechanism consists of four steps.
-- ACTIVATED STABLE (pore diffusion)
COAL -k RADICALS - ESCAPE
CO COAL MOLECULES
(1.11) The "coal molecule" is thermally activated, ruptures of bonds produce many radicals which react inside the pores of coal to produce stable molecules. The stable molecules escape through the pores by diffusion. Although the overall scheme was not applied to any experiments, kinetics of gas evolution under slow to medium heating conditions (10- 2 to 105 c/min) was studied in detail. Evolution of each gas (hydrocarbons, CH4 to C4) was modeled by many independent reactions having a Gaussian
distribution of activation energies and a log-normal distribution of frequency factors (Hanbaba et al., 1968). Anthony (1974) also employed a Gaussian distribution of activation energies with a constant frequency factor to model the overall volatile yield under rapid heating conditions. One of the important aspects of the mutiple reaction models with
statistical distribution of rate constants is that these models could explain the low activation energies obtained using the single overall reaction (see Fig. 1.3). JUntgen and Van Heek (1970) demonstrated that eight parallel first order reactions with a common frequency factor of
15 -1
10 15min and activation energies ranging from 48 to 62 Kcal/mol can be closely approximated by a single reaction with a frequency factor of
43
4 -1
10 min and an activation energy of 20 Kcal/mol. Although the fact that coal devolatilization involves numerous reactions may be better represented by statistical approaches, they require additional
parame-ters and the parallel independent scheme, as it is, predict the same asymptotic yield under long reaction times.
Kobayashi (1972) tested several models consisting of two overall reactions against the data of Kimber and Gray (1967) and
Badzioch and Hawksley (1970), in an effort to model the enhanced volatile yield under high temperature rapid heating conditions. He suggested
that two bulk competing first order reactions of the type
k COAL
k SIDUE 1 + VOLATILE 1
COAL
k2 RESIDUE 2 + VOLATILE 2 (1.12)
best describe the observed volatile yields. One of the reactions is dominant at relatively low temperatures yielding small amount of volatile matter rich in hydrogen. At higher temperatures, the second reaction becomes competitive leading to higher volatile yields.
-In spite of the fact that many researchers pointed out the importance of the secondary reactions in relation to the enhanced volatile yields observed under rapid heating conditions, very little
theoretical analysis has been done. Anthony (1974) modeled the secondary char forming reaction to be competing with diffusional escape of the reactive volatile matter, the flow rate of which was assumed to be proportional to the product of the concentration of the volatile matter
inside the pore and the overall mass transfer coefficient. He obtained a limited solution for the volatile yield under a steady-state isothermal condition and explained that the higher yields under reduced pressures occur through an increase in the overall mass transfer coefficient which was assumed to be inversely proportional to the total pressure. Although the model predicted the observed effect of the ambient pressure on the volatile yield well, the detailed transport mechanism is concealed in the assumed mass transfer coefficient. More realistic models on the volatile evolution, based on the bubble transport process through plasticized coal, have been developed recently (Lewellen, 1975, and Miller et al., 1975). These models allow parametric studies on the effects of the heating rate, the particle size and others. However, lack of experimental data on the physical change of coal particles and large uncertainty in the fundamental physico-chemical properties such as viscosity and surface tension prevented the drawing of any quantitative conclusions.
Reidelbach and Summerfield (1975) extended the existing coal models by incorporating a competing chemical scheme leading to tar or gases and other reactions. Table 1-2 shows the proposed general scheme. Numerical calculations were performed for the first five reactions, and
the results agreed with some of the experimental data such as changes of relative amount of tar and gases with temperature. However, the number of parameters used in the model (e.g., five reaction rates) compared with limited amount of existing data makes the model of little practical use. Models with large numbers of reactions should be more closely related
TABLE 1-2
GENERAL HYPOTHETICAL
SCHEME FOR COAL PYROLYSIS
(Reidelbach and Summerfield, 1975)
AC
x
2PTL
+
(1 - x
2 )S 1Activation Step (high E)
low E
x
3PG
2+
(1
- x
3 ) S 2+
(1
- x4)S
3x
5PG
3+
(1
- x
5 )S
4DAC
x
7SG
1+ Y7S5
PTG
x9SG2 + Y9S6
x
1 0SG
3+Y10S7
Primary
Decomposition
medium E
high E high EDeactivation Step (DAC
C)
Polymerization in the liquid
phase inside the particle
Vaporization (depending on
heat and mass diffusion)
Polymerization in the as
phase
Cracking in the gas phase
C = Initial coal
AC = Activated coal
PT
L= Liquid primary tar
PT
G=
Gaseous primary tar
PG = Primary gas
SG = Secondary gas
S
= Solid intermediate or residue
x,y = Stoichiometric coefficients
AE = Activation energy
C AC k3AC
S1
AC
PTL
PTL
PTG
PTG
where
k1x4PG
2S
2to the actual chemical mechanisms, which could allow evaluations of the rate constants from the fundamental structure of coal. Cheong et al.
(1975) analyzed devolatilization by assuming a certain chemical struc-ture of coal and then postulating dominant reactions. In their analysis the rate constants are determined theoretically from the assumed struc-ture of coal. Although such activities are important in the long run, the present lack of adequate knowledge of chemical structure and the uncertainties with which the theoretical values of the rate constants are known diminishes its value for engineering applications.
1.3 Objectives
There is a serious need for reliable data on the kinetics of rapid devolatilization of coals for purposes of improving the design of
gasifiers and combustors and for testing models of coal pyrolysis. The short reaction times and rapid heating rates of interest impose severe experimental constraints particularly at high temperatures. The only data available are, under these conditions, those based on pulverized coal flames (Howard and Essenhigh, 1968) and on flow experi-ments (Coates et al., 1974; Stickler et al., 1974; Badzioch and Hawksley,
1970; Kimber and Gray, 1967, and Eddinger et al., 1966). In the former, problems result from the need to separate contributions to weight loss of oxidation and pyrolysis. The data obtained from the flow experiments, although providing useful information, are questionable for the following reasons:(l)in the low temperature range(Badzioch &Hawksley, 1970), weight losses were derived using ash as a tracer, neglecting variations in the ash weight loss, an assumption which is not always valid as will be
shown, (2) the temperature-time history of the particles were not defined with precision, (3) at temperatures above 12500K only asymptotic weight
losses were obtained because of the inability to sample at short times. The detailed data are needed in order to evaluate existing models
developed to explain the increases in volatile yield with increasing temperature under rapid heating conditions. In particular, models are needed that can be utilized to determine the conditions under which volatile yields are maximized. Additionally, the data may be used to evaluate various physico-chemical mechanisms proposed for coal pyrolysis.
In view of the above considerations, the following goals were selected for the present study:
1. The measurement of the overall weight losses and elemental losses of coal under well-controlled, high-temperature, rapid-heating conditions. The following variables are studied over the indicated ranges:
Coal Type A high-volatile bituminous coal and a lignite Particle Size Narrowly size graded fraction below 100 micron
Temiperature 1000 - 2200 °K Reaction Time 1 - 200 msec Time Resolution 1 - 10 msec Heating Rate 10 - 106 K/sec
2. The development of experimental techniques for rapid heating and for rapid quenching under high-temperature conditions.
3o The critical assessment of the validity of the use of ash as a tracer and the development of the methods for measuring weight