HAL Id: hal-03020351
https://hal.archives-ouvertes.fr/hal-03020351
Submitted on 24 Nov 2020
HAL is a multi-disciplinary open access
archive for the deposit and dissemination of
sci-entific research documents, whether they are
pub-lished or not. The documents may come from
teaching and research institutions in France or
abroad, or from public or private research centers.
L’archive ouverte pluridisciplinaire HAL, est
destinée au dépôt et à la diffusion de documents
scientifiques de niveau recherche, publiés ou non,
émanant des établissements d’enseignement et de
recherche français ou étrangers, des laboratoires
publics ou privés.
of the porpoises (Phocoenidae) across the speciation
continuum.
Yacine Ben Chehida, Julie Thumloup, Cassie Schumacher, Timothy Harkins,
Alex Aguilar, Asunción Borrell, Marisa Ferreira, Lorenzo Rojas-Bracho, Kelly
Robertson, Barbara Taylor, et al.
To cite this version:
Yacine Ben Chehida, Julie Thumloup, Cassie Schumacher, Timothy Harkins, Alex Aguilar, et
al.. Mitochondrial genomics reveals the evolutionary history of the porpoises (Phocoenidae) across
the speciation continuum.. Scientific Reports, Nature Publishing Group, 2020, 10 (1), pp.15190.
�10.1038/s41598-020-71603-9�. �hal-03020351�
Mitochondrial genomics
reveals the evolutionary history
of the porpoises (phocoenidae)
across the speciation continuum
Yacine Ben chehida
1, Julie thumloup
1, cassie Schumacher
2, timothy Harkins
2,
Alex Aguilar
3, Asunción Borrell
3, Marisa ferreira
4,5, Lorenzo Rojas‑Bracho
6,
Kelly M. Robertson
7, Barbara L. taylor
7, Gísli A. Víkingsson
8, Arthur Weyna
9,
Jonathan Romiguier
9, phillip A. Morin
7& Michael c. fontaine
1,10*Historical variation in food resources is expected to be a major driver of cetacean evolution, especially for the smallest species like porpoises. Despite major conservation issues among porpoise species (e.g., vaquita and finless), their evolutionary history remains understudied. Here, we reconstructed their evolutionary history across the speciation continuum. Phylogenetic analyses of 63 mitochondrial genomes suggest that porpoises radiated during the deep environmental changes of the pliocene. However, all intra-specific subdivisions were shaped during the Quaternary glaciations. We observed analogous evolutionary patterns in both hemispheres associated with convergent evolution to coastal versus oceanic environments. This suggests that similar mechanisms are driving species diversification in northern (harbor and Dall’s) and southern species (spectacled and Burmeister’s). in contrast to previous studies, spectacled and Burmeister’s porpoises shared a more recent common ancestor than with the vaquita that diverged from southern species during the Pliocene. The low genetic diversity observed in the vaquita carried signatures of a very low population size since the last 5,000 years. Cryptic lineages within Dall’s, spectacled and Pacific harbor porpoises suggest a richer evolutionary history than previously suspected. These results provide a new perspective on the mechanisms driving diversification in porpoises and an evolutionary framework for their conservation.
Most cetaceans possess a tremendous potential for dispersal in an environment that is relatively unobstructed by geographical barriers. This observation begs the question of how do populations of such highly mobile pelagic species in such an open environment split and become reproductively isolated from each other and evolve into
new species. Recent micro- and macro-evolutionary studies showed that changes in environmental conditions1–6,
development of matrilineally transmitted cultures7, and resource specialization8–10 are major drivers of population
open
1Groningen Institute for Evolutionary Life Sciences (GELIFES), University of Groningen, PO Box 11103 CC, Groningen, The Netherlands. 2Swift Biosciences, 674 S. Wagner Rd., Suite 100, Ann Arbor, MI 48103, USA. 3IRBIO and Department of Evolutive Biology, Ecology and Environmental Sciences, Faculty of Biology, University of Barcelona, Diagonal 643, 08071 Barcelona, Spain. 4MATB-Sociedade Portuguesa de Vida Selvagem, Estação de Campo de Quiaios, Apartado EC Quiaios, 3080-530 Figueira da Foz, Portugal. 5CPRAM-Ecomare, Estrada Do Porto de Pesca Costeira, 3830-565 Gafanha da Nazaré, Portugal. 6Comisión Nacional de Áreas Naturales Protegidas (CONANP), C/o Centro de Investigación Científica y de Educación Superior de Ensenada, Carretera Ensenada-Tijuana 3918, Fraccionamiento Zona Playitas, 22860 Ensenada, BC, Mexico. 7Southwest Fisheries Science Center, National Marine Fisheries Service, NOAA, 8901 La Jolla Shores Dr., La Jolla, CA 92037, USA. 8Marine and Freshwater Research Institute, Fornubúðum 5, 220 Hafnarfjörður, Iceland. 9Institut Des Sciences de L’Évolution (Université de Montpellier, CNRS UMR 5554), Montpellier, France. 10Laboratoire MIVEGEC (Université de Montpellier, CNRS 5290, IRD 229) et Centre de Recherche en Écologie et Évolution de la Santé (CREES), Institut de Recherche Pour Le Développement (IRD), 911 Avenue Agropolis, BP 64501, 34394 Montpellier Cedex 5, France. *email: michael.fontaine@cnrs.fr
differentiation and speciation in cetacean species. Yet, the processes that link these two evolutionary timescales are still not fully understood and empirical examples are limited1, 10.
Several cetacean taxa display an antitropical distribution where the distribution of closely related taxa occurs
on either side of the equator but are absent from the tropics11–13. Multiple mechanisms have been proposed to
explain such a peculiar distribution14. In cetaceans, the predominant hypothesis implies dispersal and
vicari-ance of temperate species enabled by oceanographic, climatic and geologic fluctuations during the Miocene, Pliocene and early Pleistocene epochs1,12,15,16. It has been hypothesis that during cold periods, cold adapted taxa
extended their range into the tropics and possibly crossed the equator. In the subsequent warmer interglacial periods, these taxa would shift their range to higher latitudes. This geographic isolation in both hemispheres promoted allopatric divergence of conspecific taxa, resulting in their antitropical distribution. A closely related scenario suggests that the rise of the overall sea temperature during interglacial periods would have altered the wind’s direction and upwelling strength, leading to a redistribution of feeding areas for cetaceans toward higher
latitudes, which in turn promoted their antitropical distribution12. Another plausible hypothesis implies that
broadly distributed species, such as several cetacean species, were outperformed in the tropics by more
competi-tive species14. A combination of these different mechanisms is also possible.
The porpoises family (Phocoenidae) displays one of the best known example of antitropical distribution13.
Porpoises are among the smallest cetaceans and represent an interesting evolutionary lineage within the
Del-phinoidea, splitting from the Monodontidae during the Miocene (~ 15 Myr)1,17. Gaskin18 suggested that
por-poises originated from a tropical environment and then radiated into temperate zones in both hemispheres.
In contrast, based on the location of the oldest fossils, Barnes13 suggested that they arose in a more temperate
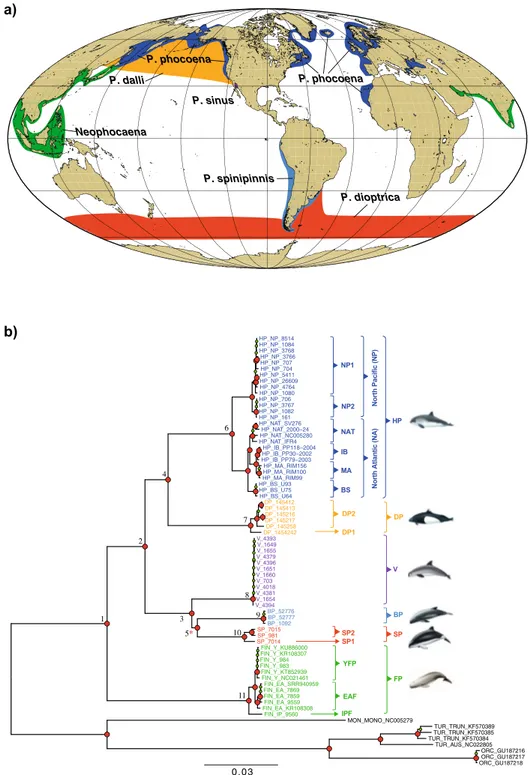
environment of the North Pacific Ocean and subsequently colonized the southern hemisphere, the Indian and Atlantic Oceans. Porpoises consist of seven extant species that occur in both hemispheres in pelagic, coastal, and riverine habitats (Fig. 1a). The family includes primarily cold-water tolerant species, but two sister species of
finless porpoises (Neophocoena phocaenoides, N. asiaeorientalis)19 inhabit the tropical waters of the Indo-Pacific
preferring mangrove zones. They are also found in the Yellow Sea, East China Sea, Sea of Japan and in estuaries and large river systems of the Indus, Ganges, and Yangtze rivers. The long pectoral fins of these porpoises
rep-resent a potential adaptation to warm water20. The remaining species are considered cold-water tolerant. They
are antitropically distributed and the short body appendices of most of these species are believed to represent
an adaptation that limits thermal exchanges in colder environment20. In the Northern Hemisphere, the harbor
porpoise (Phocoena phocoena) inhabits the coastal waters of the North Pacific and North Atlantic, while the Dall’s porpoise (Phocoenoides dalli) occupies the oceanic waters of the North Pacific. The large heart and high blood-oxygen of the Dall’s porpoises suggest that this species is adapted to deep diving and so probably to the
oceanic environment21. This neritic-oceanic habitat segregation is mirrored in the southern hemisphere with
the Burmeister’s porpoise (Phocoena spinipinnis), occupying the coastal waters of South America and the poorly known spectacled porpoise (Phocoena dioptrica) occupying the circum-Antarctic oceanic waters. The vaquita departs from the other species with an extremely localized geographical distribution in the upper Gulf of Cali-fornia and is now critically endangered22.
With the exception of vaquitas, all species of porpoises exhibit a relatively broad distribution range that appear fairly continuous at a global scale. Nevertheless, despite having the ability to disperse over vast distances in an open environment, many include distinct sub-species, ecotypes, or morphs. For example, the finless porpoises
not only include two recognized species, but also an incipient species within the Yangtze River19,25; the harbor
porpoise also displays a disjunct distribution with three sub-species officially recognized and an additional one
suggested by Fontaine et al.8; at least two forms of Dall’s porpoise have been described26; and the Burmeister’s
porpoise also shows evidence of deep population structure27. Many of these subgroups show specific ecological28,
physiological19 and morphological29 adaptations to their respective environments. For instance, Zhou et al.19
identified several genes under selection in the Yangtze finless porpoise associated with the renal function and urea cycle, reflecting adaptations to the freshwater environment. Likewise, morphological, stomach content and stable isotopes differences exclusive to Mauritanian and Iberian harbor porpoises are likely adaptations to the
upwelling related environment30. Such intraspecific subdivisions, also observed in killer whales (Orcinus orca)10
and bottlenose dolphins (Tursiops truncatus)31, illustrate the evolutionary processes in action, and can, in some
cases, eventually lead to new species. Porpoises are thus an interesting model to investigate the evolutionary processes at both micro- and macroevolutionary time scale to better understand present and historical mecha-nisms driving population structure, adaptation to different niches, and speciation.
From a conservation perspective, the coastal habitat of many porpoise species largely overlaps with areas where human activities are the most intense. These have dramatic impacts on natural populations. For example,
the vaquita lost 90% of its population between 2011 and 2016 leaving about 30 individuals in 201732, and less
than 19 in 201933. This species is on the brink of extinction and currently represents the most endangered marine
mammal. Finless porpoises also face major conservation issues, especially the lineage within the Yangtze River (N.
a. asiaeorientalis) in China, also critically endangered due to human activities34,35. Similarly, several populations
of harbor porpoises are highly threatened36,37. Little information about the spectacled and Burmeister’s porpoises
is available. While anthropogenic activities are an undeniable driver of the current threats to biodiversity, the
evolutionary context can be also informative when assessing their vulnerability38. For example, knowledge on
population or species evolutionary history is useful to characterize population dynamics, identify evolutionary significant units relevant for conservation, recent or historical split related to environmental variation, evolu-tionary or demographic trends, and evoluevolu-tionary processes that could explain, enhance, or mitigate the current threats experienced by a species39,40.
To date, porpoise evolutionary history and biogeography remains contentious and superficial41. Previous
phylogenetic studies led to incongruent results, as there are disagreements regarding some of their relation-ships, in particular about the position of the vaquita, Dall’s, Burmeister’s and spectacled porpoises13,41,42. So far,
MON_MONO_NC005279 TUR_AUS_NC022805 TUR_TRUN_KF570384TUR_TRUN_KF570385 TUR_TRUN_KF570389 FIN_IP_9560 FIN_Y_NC021461 FIN_Y_KT852939 FIN_Y_983 FIN_Y_984FIN_Y_KR108307 FIN_Y_KU886000 FIN_EA_KR108308FIN_EA_9559 FIN_EA_7859 FIN_EA_7869 FIN_EA_SRR940959 V_4394 V_1654 V_4381 V_4018V_703 V_1660V_1651 V_1655 V_1649 V_4393 V_4396 V_4379 BP_1092 BP_52777 BP_52776 SP_7014SP_981 SP_7015 DP_1454242DP_145258 DP_145217 DP_145216 DP_145413 DP_145412 HP_BS_U64 HP_BS_U75 HP_BS_U93HP_MA_RIM99 HP_MA_RIM100HP_MA_RIM156 HP_IB_PP79−2003 HP_IB_PP30−2002HP_IB_PP118−2004 HP_NAT_IFR4HP_NAT_NC005280 HP_NAT_2000−24 HP_NAT_SV276 HP_NP_161 HP_NP_1082 HP_NP_3767 HP_NP_706HP_NP_1080 HP_NP_4764 HP_NP_26609 HP_NP_5411HP_NP_704 HP_NP_707 HP_NP_3766 HP_NP_3768 HP_NP_1084 HP_NP_8514 ORC_GU187216 ORC_GU187217 ORC_GU187218 b) EAF YFP IPF FP DP2 DP1 DP SP1 SP2 SP BS MA IB NAT NP1 NP2
North Atlantic (NA)
HP North Pacif ic (NP) BP V P. dalli Neophocaena P. sinus P. spinipinnis P. phocoena P. phocoena P. dioptrica a) 0.03 1 2 3 4 6 5* 11 7 8 9 10
Figure 1. (a) Geographical range of each species in the Phocoenidae family. Map generated using ArcGIS 10.3 software using the open source data from the ETOPO1 Global Relief Model23 (https ://www.ngdc.noaa.gov/mgg/globa l/) and adapted from
Gaskin18 and Berta et al.24. (b) Maximum-likelihood mitochondrial phylogeny. The external branches and the tip labels are
colored by species. The tree is rooted with eight sequences from four closely related Odontoceti species (in black). Numbers at the nodes are discussed in the text. The nodes indicated in red and green represent nodes with bootstrap support ≥ 90% and ≥ 70%, respectively. The red star indicates a node with a 63% bootstrap support in the Neighbor-joining tree (Fig. S1b). The lineage code includes the vaquita (P. sinus, V), Burmeister’s porpoise (P. spinipinnis, BP), spectacled porpoise (P. dioptrica, SP), Dall’s porpoise (P. dalli, DP), harbor porpoise (P. phocoena, HP) and finless porpoise (N. phocaenoides + N. asiaeorientalis, FP). Some species have been also further subdivided into distinct groups: harbor porpoises are divided into North Pacific (NP) and North Atlantic (NA), and within each of these groups, further subdivisions are recognized. Four groups are recognized within NA: NAT (North Atlantic), IB (Iberian), MA (Mauritanian), BS (Black Sea). NP is divided into two subgroups: NP1 and NP2. Three sub-species or species are also recognized among the finless porpoises: Indo-Pacific (IPF), Yangtze finless (YFP) and East Asia finless (EAF). Spectacled porpoise subgroups are designated as SP1 and SP2. Dall’s porpoise subgroups as DP1 and DP2. The scale bar unit is in substitution per site.
molecular phylogenetic relationships among porpoises have been estimated using short sequences of the D-loop
and cytochrome b17,42. However, the D-loop can be impacted by high levels of homoplasy that blurs the resolution
of the tree43 and the Cyt-b may have limited power to differentiate closely related taxa44.
In this study, we sequenced and assembled the whole mitogenome from all extant porpoise species, includ-ing most of the known lineages within species to resolve their phylogenetic relationships and reconstruct their evolutionary history. More specifically, (1) we assessed the phylogenetic and phylogeographic history of the porpoise family based on the whole mitogenomes including the timing and tempo of evolution among line-ages; (2) we assessed the genetic diversity among species and lineages and (3) reconstructed the demographic history for some lineages for which the sample size was suitable. (4) We placed the evolutionary profile drawn for each lineage and species into the framework of past environmental changes to extend our understanding of porpoise biogeography. Finally, (5) we interpreted the IUCN conservation status of each taxa in the light of their evolutionary history.
Material and methods
taxon sampling and data collection.
Porpoise tissue samples from 56 live-biopsies, bycaught, orstranded animals (Table 1 and Table S1) were stored in salt-saturated 20% DMSO or 95% Ethanol and stored at
− 20 °C until analyses. All samples were collected under appropriate Marine Mammal Protection Act permits within the US, or appropriate permits elsewhere, following the relevant guidelines and regulations, and trans-ferred internationally under CITES permit. Genomic DNA was extracted from tissues using the PureGene or
DNeasy Tissue kits (Qiagen), following the manufacturer’s recommendations. DNA quality and quantity were
assessed on an agarose gel stained with ethidium bromide, as well as using a Qubit-v3 fluorometer. Genomic libraries for 44 porpoise samples including three spectacled porpoises, three Burmeister’s porpoises, 12 vaquita, six Dall’s porpoises, three East Asian finless porpoises, two Yangtze finless, one Indo-Pacific finless and 14 North Pacific harbor porpoises. Libraries were prepared by Swift Biosciences Inc. using either the Swift Biosciences Accel-NGS double-strand 2S (harbor porpoises) or single-strand 1S Plus DNA Library Kit (all other species), following the user protocol and targeting an insert-size of ~ 350 base-pairs (bps). The libraries were indexed and pooled in groups of 2–12 for paired-end 100 bps sequencing in five batches on an Illumina MiSeq sequencer at Swift Biosciences. Additional libraries for 12 samples of North Atlantic harbor porpoises were prepared at BGI Inc. using their proprietary protocol, indexed and pooled for paired-end 150 bps sequencing on one lane of HiSeq-4000 at BGI Inc. The total sequencing effort produced reads for 56 individuals (Table S2). Previously published reads from one additional finless porpoise sequenced with a Hiseq-2000 were retrieved from NCBI (Table S2). For this individual, we down-sampled the raw FASTQ files to extract 0.5% of the total reads and used the 5,214,672 first reads to assemble the mitogenome. The subsequent data cleaning and mitogenome assemblies were thus performed for a total of 57 individuals.
Data cleaning.
The quality of the reads was first evaluated for each sample using FastQC v.0.11.545.Trim-momatic v.0.3646 was used to remove low quality regions, overrepresented sequences and Illumina adapters.
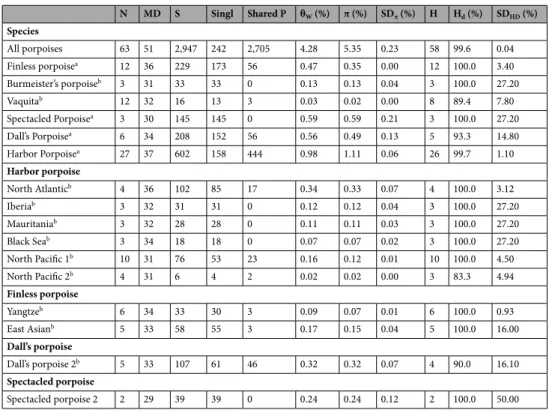
Dif-Table 1. Taxon sample size (n) and descriptive statistics for the shotgun sequencing and mitochondrial assembly per species and mitochondrial lineage. The statistics include the total number of reads before and after filtering (Rb and Ra), the sequencing coverage depth, the size of the mitochondrial assembly (in base-pairs), and the GC content in percent (%GC). The mean value and the standard deviation are shown.
Lineage n Rb Ra Depth Assembly size % GC
Harbor porpoise (HP) 27 30.8 ± 28.3 28.5 ± 25.9 1,323.9 ± 1,800.0 16,383.8 ± 0.8 40.6 ± 0.1
North Pacific 1 (NP1) 10 5.1 ± 1.8 5.0 ± 1.7 99.6 ± 92.6 16,384.3 ± 0.5 40.7 ± 0.0
North Pacific 2 (NP2) 4 5.9 ± 1.3 5.6 ± 1.2 97.2 ± 119.8 16,384.0 ± 0.0 40.7 ± 0.0
North Atlantic (NAT) 4 56.9 ± 3.4 52.2 ± 2.9 1656.3 ± 1,058.9 16,383.3 ± 0.6 40.6 ± 0.0
Mauritania (MA) 3 59.8 ± 5.4 54.9 ± 5.2 1,431.0 ± 648.1 16,384.0 ± 0.0 40.6 ± 0.0 Iberia (IB) 3 65.2 ± 8.2 60.5 ± 7.6 3,169.7 ± 1882.6 16,384.0 ± 0.0 40.5 ± 0.0 Black Sea (BS) 3 60.0 ± 2.2 54.8 ± 1.3 4,755.3 ± 1,376.9 16,382.0 ± 0.0 40.6 ± 0.0 Dall’s porpoise (DP) 6 2.8 ± 0.9 2.7 ± 0.9 49.5 ± 14.5 16,367.5 ± 0.8 40.5 ± 0.1 Dall’s porpoise 1 (DP1) 1 4.5 ± 0.0 4.4 ± 0.0 74.0 ± 0.0 16,369.0 ± 0.0 40.6 ± 0.0 Dall’s porpoise 2 (DP2) 5 2.5 ± 0.5 2.4 ± 0.5 44.6 ± 9.0 16,367.2 ± 0.4 40.5 ± 0.0 Vaquita (V) 12 5.8 ± 5.7 5.7 ± 5.5 113.3 ± 108.6 16,370.0 ± 0.0 39.8 ± 0.0 Burmeister’s porpoise (BP) 3 2.3 ± 0.3 2.3 ± 0.3 125.0 ± 121.2 16,378.7 ± 8.1 40.1 ± 0.0 Spectacled porpoise (SP) 3 2.4 ± 0.2 2.3 ± 0.2 55.0 ± 30.5 16,371.0 ± 0.0 39.7 ± 0.1 Spectacled porpoise 1 (SP1) 1 2.2 ± 0.0 2.1 ± 0.0 41.0 ± 0.0 16,371.0 ± 0.0 39.6 ± 0.0 Spectacled porpoise 2 (SP2) 2 2.5 ± 0.0 2.4 ± 0.0 62.0 ± 39.6 16,371.0 ± 0.0 39.7 ± 0.1 Finless porpoises (FP) 12 2.7 ± 1.1 2.6 ± 1.1 92.9 ± 74.9 16,383.1 ± 5.8 40.8 ± 0.0 Indo-Pacific (IPF) 1 2.3 ± 0.0 2.2 ± 0.0 77.0 ± 0.0 16,385.0 ± 0.0 40.8 ± 0.0
East Asian (EAF) 5 3.0 ± 1.5 2.9 ± 1.4 53.2 ± 22.8 16,381.2 ± 7.5 40.0 ± 0.0
ferent filters were applied according to the type of Illumina platform used (see Text S1 for details). Only mated reads that passed Trimmomatic quality filters were used for the subsequent analyses.
Mitogenome assembly.
Porpoises mitogenome assemblies were reconstructed using two differentapproaches. First, we used Geneious v.8.1.847 to perform a direct read mapping to the reference mitogenome of
the harbor porpoise (accession number AJ55406348). We used default settings except the minimum mapping
quality set to 20 and the number of iterations set to 5. This step was followed by a reconstruction of the
consen-sus sequences (Table S2). The second approach implemented in MITOBIM49 is a hybrid approach combining
a baiting and iterative elongation procedure to perform a de-novo assembly of the mitogenome (see details in Text S2). We visually compared the assemblies provided by the two methods in Geneious to assess and resolve inconsistencies (Text S2 and Table S2).
In addition to the 57 assembled individuals, we retrieved six porpoise mitogenomes from Genbank (Table S2).
We also added eight complete mitogenomes from four outgroup species: one narwhal (Monodon monoceros)48,
three bottlenose dolphins6, one Burrunan dolphin (Tursiops australis)6 and three orcas50.
Sequences alignments.
We performed the alignment of the 71 mitogenomes with MUSCLE51 usingdefault settings in Geneious. A highly repetitive region of 226 bps in the D-loop was excluded from the final alignment (from position 15,508 to 15,734) because it was poorly assembled, and included many gaps and ambi-guities. We manually annotated the protein-coding genes (CDS), tRNA and rRNA of the final alignment based
on a published harbor porpoise mitogenome48. Contrary to the remaining CDSs, ND6 is transcribed from the
opposite strand52. Therefore, to assign the codon positions in this gene, we wrote a custom script to reverse
com-plement ND6 in the inputs of all the analyses that separates coding and non-coding regions of the mitogenomes. This led to a 17 bps longer alignment due to the overlapping position of ND5 and ND6.
phylogenetic relationships.
We estimated the phylogenetic relationships among the assembled mtDNAsequences using three approaches: a maximum-likelihood method (ML) in PHYML v3.053; a distance based
method using the Neighbour-Joining algorithm (NJ) in Geneious; and an unconstrained branch length Bayesian
phylogenetic tree (BI) in MrBayes v3.2.654. We used the Bayesian information criterion (BIC) to select the
sub-stitution model that best fits the data in jModelTest2 v2.1.1055. The best substitution model and parameters were
used in the ML, NJ and BI approaches. For the ML approach, we fixed the proportion of invariable sites and the gamma distribution parameters to the values estimated by jModelTest2. The robustness of the ML and NJ tree at
each node was assessed using 10,000 bootstrap replicates. For the Bayesian inference, a total of 1 × 10⁶ MCMC
iterations was run after a burn-in of 1 × 10⁵ steps, recording values with a thinning of 2,000. We performed
ten independent replicates and checked the consistency of the results. Runs were considered to have properly explored the parameter space if the effective sample sizes (ESS) for each parameter was greater than 200 and by
visually inspecting the trace plot for each parameter using Tracer v1.656. We assessed the statistical robustness
and the reliability of the Bayesian tree topology using the posterior probability at each node.
Finally, the four phylogenetic trees were rooted with the eight outgroup sequences and plotted using the R package ggtree v1.457.
Divergence time estimate.
We estimated the divergence time of the different lineages using atime-cali-brated Bayesian phylogenetic analysis implemented in BEAST v2.4.358. We assumed two calibration points in the
tree: (1) the split between the Monodontidae and Phocoenidae, node calibrated with a lognormal mean age at
2.74 Myr17 (sd = 0.15) as a prior and (2) the split between the Pacific and Atlantic harbor porpoise lineages, node
calibrated with a uniform distribution between 0.7 and 0.9 Myr as a prior2.
Divergence times were estimated using a relaxed log-normal molecular clock model for which we set the parameters ucldMean and ucldStdev to exponential distributions with a mean of 1 and 0.3337, respectively. We used a Yule speciation tree model and fixed the mean of the speciation rate parameter to 1. The BIC was used in
jModelTest2 to identify the substitution model best fitting to the data, using the empirical base frequencies. We
assumed a substitution rate of 5 × 10⁻⁸ substitutions per-site and per-year. This mutation rate was estimated by
Nabholz et al.59 for cetacean mitogenomes and was previously used on harbor porpoise8,60. A total of 1.2 × 10⁹
MCMC iterations were run after a burn-in length of 1.2 × 10⁸ iterations, with a thinning of 5,000 iterations. We
performed eight independent replicates and checked for the consistency of the results among replicates. A run was considered as having converged if the ESS values were greater than 200, and if they produced consistent trace plots using Tracer v1.6. Subsequently, we combined all runs together after a burn-in of 98% using
LogCom-biner58. The best supported tree topology was the one with the highest product of clade posterior probabilities
across all nodes (maximum clade credibility tree), estimated using TreeAnnotator58. We also calculated the 95%
highest posterior density for the node ages using TreeAnnotator. The final chronogram was rooted with the eight
outgroups sequences and plotted using FigTree v.1.4.361.
Genetic diversity within species and sub-species.
We subdivided each species into their distinct line-ages in order to compare their genetic diversity at the different taxonomic level. Specifically, we divided the har-bor porpoise into five subgroups, North Pacific (P. p. vomerina), Black Sea (P. p. relicta), Mauritanian—Iberian (P.p. meridionalis) and North Atlantic (P. p. phocoena) in accordance with the subdivisions proposed for this spe-cies in the literature30. Finless porpoise was split into Indo-Pacific finless (N. phocaenoides; IPF), East Asianfin-less (N. a. sunameri; EAF) and Yangtze finfin-less porpoises (N. a. asiaeorientalis; YFP). For simplicity, we refer here to finless porpoises as a single group of species and IPF, EAF and YFP as the distinct lineages throughout this paper. Additionally, we subdivided the other groups into lineages that were as divergent or more divergent than
the sub-species that were described in the literature. This includes splitting the North Pacific harbor porpoises into NP1 and NP2, Dall’s porpoises into DP1 and DP2 and spectacled porpoises into SP1 and SP2 to reflect the
deep divergence observed in the phylogenetic tree within these three lineages (Fig. 1b and Fig. S1).
For each species and subgroup, several statistics capturing different aspects of the genetic diversity were cal-culated for different partitions of the mitogenome, including the whole mitogenomes, the non-coding regions (i.e. inter-gene regions and D-loop) and the 13 protein coding genes (e.g. CDS) excluding tRNAs and rRNA. The number of polymorphic sites, nucleotide diversity (π), number of singletons, number of shared polymorphisms, number of haplotypes, haplotype diversity and Watterson estimator of θ were calculated. For CDSs, we also
esti-mated the number of synonymous (#Syn) and non-synonymous mutations (#NSyn), π based on synonymous (πS)
and non-synonymous mutations (πN), and the ratio πN/πS. All these statistics were computed in DnaSP v.5.10.0162. Since we only have a unique sample for IPF, DP1 and SP1 we did not estimate these statistics for these lineages. Differences in sample sizes can influence some of these statistics. As our sample size ranged from three to 26
individuals per group, we used a rarefaction technique63 to account for the differences in sample size. We assumed
a sample size of three individuals in order to compare the genetic diversity among lineages that have different sample sizes. For each lineage, we randomly subsampled 2,500 times a pool of three sequences and estimated the median, mean and 95% confidence interval for π.
test for selective neutrality.
We tested for evidence of natural selection acting on the mitogenomes usinga McDonald–Kreitman test64 (MK-tests). This test infers deviation from the neutral theory by comparing the
ratio of divergence between species (dN/dS) versus polymorphism within species (πN/πS) at synonymous (silent)
and non-synonymous (amino acid-changing) sites in protein coding regions using the so-called neutrality index (NI). NI is 1 when evolution is neutral, greater than 1 under purifying selection, and less than 1 in the case of positive selection. MK-tests were conducted on the 13 CDS regions of the mitogenome using DnaSP. We conducted this test in two different ways: first comparing all the interspecific lineages to a same outgroup, the killer whale for which multiple mitogenome sequences were available, and second comparing all interspecific lineages to each other in order to assess how the MK-tests were affected by the outgroup choice. The significance of the NI values was evaluated using a G-tests in DnaSP. Furthermore, the distribution of NI values for each
lineage were compared among each other using a PERMANOVA with the R package RVAideMemoire v.0.9-7765.
Pairwise comparisons were assessed with a permutation tests and were adjusted for multiple comparisons using
the false rate discovery method66. The PERMANOVA and pairwise comparisons were conducted using 9,999
permutations. The neutral theory predicts that the efficacy of purifying selection increases with Ne67. Under
these assumptions, Ne is expected to be proportional to NI68,69. To test this hypothesis, we assessed the
correla-tion between values of NIs and π derived by rarefaccorrela-tion as a proxy of Ne. However, MK-test is also known to be impacted by demographic changes in some specific cases. For instance, an increase in Ne could mimic the effect
of positive selection70 while recent reduction in Ne could prevent the detection of positive selection and lead to
an artefactual signal of purifying selection71. This problem is exacerbated in species with very low Ne and the
results of MK-tests should be interpreted accordingly.
In addition to the MK-tests, we quantified the branch-specific non-synonymous to synonymous substitution
ratios (dN/dS) to infer direction and magnitude of natural selection along the phylogenetic tree. To estimate the
branch-specific ratio we first counted the number of synonymous (#S) and non-synonymous (#NS) substitutions
for the 13 CDSs. Then #S and #NS were mapped onto a tree using the mapping procedure of Romiguier et al.72.
Next, we divided #S and #N by the number of synonymous and nonsynonymous sites to obtain an approximation
of dS and dN, respectively. More specifically, we first fitted the YN98 codon model using the BPPML program73,
then we mapped the estimated dN/dS values onto the branches of the ML tree using the program MAPNH of the
TESTNH package v1.3.074. Extreme d
N/dS ratio (> 3) are often due to branches with very few substitution (dN or dS)72 and were discarded. We compared the distribution of dN/dS among species (i.e., across all the branches) using a PERMANOVA. Finally, the estimated ratios were correlated with π values obtained by rarefaction using
a Pearson’s correlation tests in R75. To do so, we pooled the signal from each lineage as a single data point as
suggested by Figuet et al.76. We considered the intraspecific and interspecific lineages, except for those where no
non-synonymous substitutions were observed (ex. NP2). Within a lineage, π was summarized as the mean of
the log10-transformed value of its representatives and the dN/dS was obtained by summing the non-synonymous
and synonymous substitution counts across its branches and calculating the ratio76.
inference of demographic changes.
We investigated changes in effective population size (Ne) through time for the lineages that included a sample size ≥ 10 to conduct reliable demographic inferences. This includes the vaquitas and North Pacific NP1 harbor porpoise lineage. We first tested for deviations from neutral modelexpectations using three statistics indicative of historical population size changes: Tajima’s D77, Fu and Li’s D*
and F*78 in DnaSP. The p-values were assessed using coalescent simulations in DnaSP using a two tailed test as
described in Tajima77. We then reconstructed the mismatch distributions indicative of population size changes
using Arlequin v.3.5.2.279. Mismatch distributions were generated under a constant population size model and
a sudden growth/decline population model80. This later model is based on three parameters: the population
genetic diversity before the population size change (θi); the population genetic diversity after the population
size change (θf), and the date of the change in population size in mutational units (τ = 2.µ.t, where µ is the
mutation rate per sequence and generation and t is the time in generations). These parameters were estimated in Arlequin using a generalized non-linear least-square approach. The 95% confidence interval was obtained
using 10,000 parametric bootstraps80. Finally, we used the coalescence based Bayesian Skyline Plot (BSP)81 to
estimate demographic changes in Ne back to the TMRCA . BSP analysis was performed in BEAST v2.4.3 using the
evaluate the best substitution models. We assumed a substitution rate of 5 × 10⁻⁸ substitutions per site and per
year59 in order to obtain the time estimates in years. We conducted a total of ten independent runs of 108 MCMC
iterations following a burn-in of 1 × 10⁷ iterations, logging every 3,000 iterations. We constrained Ne between
0 and 150,000 individuals and between 0 and 380,000 individuals for the vaquita and the NP1 harbor porpoise lineage, respectively. This upper boundary on Ne was empirically set to encompass the entire marginal posterior distribution. All other parameters were kept at default values. The convergence of the analysis was assessed by checking the consistency of the results over ten independent runs. For each run, we also used Tracer to inspect the trace plots for each parameter to assess the mixing properties of the MCMCs and estimate the ESS value for each parameter. Runs were considered as having converged if they displayed good mixing properties and if the
ESS values for all parameters were greater than 200. We discarded the first 10% of the MCMC steps as a burn-in
and obtained the marginal posterior parameter distributions from the remaining steps using Tracer. Ne values
were obtained by assuming a generation time of 10 years36. To test whether the inferred changes in Ne over time
were significantly different from a constant population size null hypothesis, we compared the BSP of both
line-ages with the ‘Coalescent Constant Population’ model (CONST)58,82 implemented in BEAST v2.4.3 using Bayes
Factors83. We thus conducted ten independent CONST runs using 108 MCMC iterations after a burn-in of 10%,
logging every 3,000 iterations. We assessed the proper mixing of the MCMC and ensured ESS were greater than 200. We then used the Path sampler package in BEAST v2.4.3 to compute the log of marginal likelihood (logML)
of each run for both BSP and CONST. We set the number of steps to 100 and used 108 MCMC iterations after a
burn-in of 10%. Bayes Factors were computed as twice the difference between the log of the marginal likelihoods
(i.e. 2[LogMLBSP − LogMLCONST]) and were performed for pairwise comparisons between BSP and CONST runs.
As recommended, Bayes Factors greater than 6 were considered as a strong evidence to reject the null hypothesis (i.e. CONST)83.
Results
porpoise mitogenomes assemblies.
A total of 57 mitogenomes of the seven species of porpoise (Table S1) were newly sequenced and assembled using Illumina sequencing. After read quality check, trimming,and filtering (Table 1 and Table S2), between 1,726,422 and 67,442,586 cleaned reads per sample were used
to assemble the whole mitogenomes. The two methods used to assemble the mitogenomes delivered consist-ent assemblies with an average sequencing depth coverage ranging from 15 to 4,371X for Geneious and 17 to
4,360X for MITOBIM (Table 1 and Table S2). In total, 35 of the 57 mitogenome assemblies were strictly identical
with both methods. The 22 remaining assemblies included between 1 and 4 inconsistencies which were visu-ally inspected and resolved (Text S2 and Table S2). Augmented with the 14 previously published mitogenome sequences, the final alignment counted 71 mitogenome sequences of 16,302 bps and included less than 0.2% of missing data. The alignment was composed of 627 singletons and 3,937 parsimony informative sites defining 68 haplotypes (including the outgroup sequences). Within the 63 ingroup porpoise sequences, we observed 2,947 segregating sites, including 242 singletons and 2,705 shared polymorphisms defining 58 distinct haplotypes with
a haplotype diversity of 99.6% (Table 2, Tables S3 and S4).
phylogenetic history of the porpoises.
A Hasegawa–Kishino–Yano (HKY + G, Gamma = 0.19) model was selected as the best-fitting nucleotide substitution model. Phylogenetic inferences using amaximum-likeli-hood (ML) approach (Fig. 1b and Fig. S1a), a distance-based neighbor-joining method (Fig. S1b), and a
Bayes-ian approach (Fig. S1c) all produced concordant phylogenies (i.e., similar topologies and statistical supports). All phylogenies were fully resolved with high statistical support at the inter- and intra-specific levels (bootstrap supports ≥ 93% or node posterior probability of one). One exception was the node 5 grouping the Burmeister’s and spectacled porpoises in the neighbor-joining tree (Fig. S1b) as it displayed a slightly lower bootstrap support
of 61% (red star in Fig. 1b and Fig. S1b), but it was fully supported by the ML and Bayesian approaches (Fig. 1b
and Fig. S1).
The resulting phylogenetic reconstruction (Fig. 1b) showed that all porpoises formed a monophyletic group
(node 1). The most basal divergence in the tree split the more tropical finless porpoises from the other temperate to subpolar porpoises. Then, the temperate species split into two clades (node 2) composed of two reciprocally monophyletic groups. The first is composed of the southern hemisphere species (spectacled and Burmeister’s porpoises) and vaquitas (node 3). The second is composed of the porpoises from the northern hemisphere (harbor and Dall’s porpoises, node 4). In contrast with a previous phylogenetic study based on control region
sequences42, the phylogenetic tree based on the whole mitogenome suggested that vaquitas split from a common
ancestor to the spectacled and Burmeister’s porpoises (node 3), and thus that the two species from the southern hemisphere are more closely related to each other (node 5) than they are to vaquitas. Finally, the mitogenome tree supported the monophyly of each recognized species (nodes 6–11).
Intraspecific subdivisions were also evident from the mitogenome phylogeny in some species, such as in the
harbor and finless porpoises (Fig. 1b). In the harbor porpoises, the split between the North Atlantic and North
Pacific sub-species constituted the deepest divergence of all intraspecific subdivisions across all species. Within the North Atlantic harbor porpoises, further subdivisions were also observed and corresponded to the three
previously described ecotypes or sub-species30. These included the relict population in the Black Sea, the harbor
porpoises from the upwelling waters with two closely related but distinct lineages in Iberia and Mauritania, and the continental shelf porpoises further north in the North Atlantic. Finally, within the North Pacific, two cryptic
subgroups were also observed (NP1 and NP2; Fig. 1b). Among the finless porpoises, the three taxonomic groups
currently recognized19, including IPF and the two closely related species of narrow-ridged finless porpoises,
sampling, Dall’s (node 7) and spectacled porpoises (node 10) each also displayed distinct lineages (DP1/DP2
and SP1/SP2, respectively; Fig. 1b and Fig. S1) as divergent as those observed in the harbor and finless porpoises.
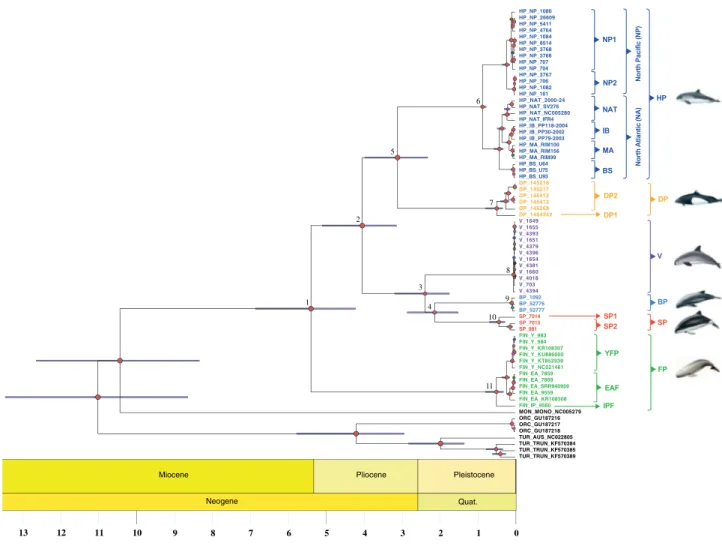
The time-calibrated Bayesian mitochondrial phylogeny (Fig. 2 and Table S5) suggested that all extant
por-poises find their common ancestor ~ 5.42 M years ago (95% Highest Posterior Density, HPD, 4.24–6.89; node 1). This time corresponds to the split between the finless and the other porpoise species. Spectacled, vaquita and Burmeister’s porpoises diverged from harbor and Dall’s porpoise ~ 4.06 Myr ago (95% HPD, 3.15–5.12; node 2). The split between vaquitas, spectacled and Burmeister’s porpoises was estimated at ~ 2.39 Myr (95% HPD, 1.74–3.19; node 3) and between spectacled and Burmeister’s at ~ 2.14 Myr (95% HPD, 1.51–2.86; node 4). The Dall’s and harbor porpoises split from each other ~ 3.12 Myr ago (95% HPD, 2.31–3.98; node 5). Finally, the common ancestor of the subdivisions observed within each species was dated within the last million years (nodes 6–11).
Genetic diversity of the mitogenome.
Mitochondrial genetic diversity varied greatly among speciesand lineages within species (Table 2, Tables S3, S4 and Fig. 3). The highest values of π were observed in the
harbor porpoises (π = 1.15%), followed by the spectacled (π = 0.60%), Dall’s (π = 0.50%), finless (π = 0.35%), and Burmeister’s porpoises (π = 0.13%), while vaquitas displayed the lowest values (π = 0.02%). The variation among species was strongly related to the occurrence of distinct mitochondrial lineages within species that corresponds
to ecologically and genetically distinct sub-species or ecotypes (Table 2, Tables S3, S4 and Fig. 3). Once the
lineages that included more than three sequences were compared to each other while accounting for the
dif-ference in sample size using a rarefaction procedure63 (Fig. 3), π values were more homogeneous among
line-ages and species, with however some variation. The most diversified lineline-ages included DP2 in Dall’s porpoise (π = 0.32%) and the North Atlantic (NAT) lineage in harbor porpoise (π = 0.33%). In contrast, the vaquita lineage (π = 0.02%), harbor porpoise North Pacific lineage NP2 (π = 0.02%) and Black Sea lineage (BS) (π = 0.07%), and the Yangtze finless porpoise YFP lineage (π = 0.06%) displayed the lowest nucleotide diversity. The other lineages displayed intermediate π values.
Molecular evolution of the mitogenome.
The nucleotide diversity also varied greatly along the mitoge-nome. It was lowest in the origin of replication, tRNA and rRNAs, intermediate in the coding regions and highest in non-coding regions (Fig. S2, Tables S3 and S4). This result indicates different levels of molecular constraints along the mitogenome.Table 2. Summary statistics describing the genetic diversity of the mitochondrial genomes among porpoise species and their distinct lineages. The statistics includes the sample size (N), number of sites with missing data in number of gaps (MD), segregating sites (S), singletons (Singl.), shared polymorphism (Shared P.),
Watterson’s theta (θW), average nucleotide diversity per site (π) and its standard deviation (SDπ), number
of haplotypes (H), haplotypic diversity (Hd) and its standard deviation (SDHD). a Species including multiple
distinct mitochondrial lineages. b Species with a single mitochondrial lineage.
N MD S Singl Shared P θW (%) π (%) SDπ (%) H Hd (%) SDHD (%) Species All porpoises 63 51 2,947 242 2,705 4.28 5.35 0.23 58 99.6 0.04 Finless porpoisea 12 36 229 173 56 0.47 0.35 0.00 12 100.0 3.40 Burmeister’s porpoiseb 3 31 33 33 0 0.13 0.13 0.04 3 100.0 27.20 Vaquitab 12 32 16 13 3 0.03 0.02 0.00 8 89.4 7.80 Spectacled Porpoisea 3 30 145 145 0 0.59 0.59 0.21 3 100.0 27.20 Dall’s Porpoisea 6 34 208 152 56 0.56 0.49 0.13 5 93.3 14.80 Harbor Porpoisea 27 37 602 158 444 0.98 1.11 0.06 26 99.7 1.10 Harbor porpoise North Atlanticb 4 36 102 85 17 0.34 0.33 0.07 4 100.0 3.12 Iberiab 3 32 31 31 0 0.12 0.12 0.04 3 100.0 27.20 Mauritaniab 3 32 28 28 0 0.11 0.11 0.03 3 100.0 27.20 Black Seab 3 34 18 18 0 0.07 0.07 0.02 3 100.0 27.20 North Pacific 1b 10 31 76 53 23 0.16 0.12 0.01 10 100.0 4.50 North Pacific 2b 4 31 6 4 2 0.02 0.02 0.00 3 83.3 4.94 Finless porpoise Yangtzeb 6 34 33 30 3 0.09 0.07 0.01 6 100.0 0.93 East Asianb 5 33 58 55 3 0.17 0.15 0.04 5 100.0 16.00 Dall’s porpoise Dall’s porpoise 2b 5 33 107 61 46 0.32 0.32 0.07 4 90.0 16.10 Spectacled porpoise Spectacled porpoise 2 2 29 39 39 0 0.24 0.24 0.12 2 100.0 50.00
HP_NP_706 HP_NP_4764 HP_IB_PP79-2003 HP_NAT_SV276 FIN_EA_KR108308 FIN_Y_983 SP_981 V_1651 V_1655 HP_NP_704 V_4396 HP_IB_PP30-2002 ORC_GU187217 HP_NAT_IFR4 SP_7014 HP_NP_5411 HP_NP_1082 HP_NP_3766 V_1654 FIN_EA_9559 MON_MONO_NC005279 V_4379 V_4394 HP_NAT_NC005280 HP_NP_1080 FIN_EA_SRR940959 DP_145216 V_4381 HP_NP_26609 BP_52776 ORC_GU187216 V_4018 TUR_TRUN_KF570389 FIN_Y_NC021461 HP_NP_161 HP_IB_PP118-2004 HP_MA_RIM99 V_1660 BP_1092 V_703 DP_145258 V_4393 HP_NAT_2000-24 HP_MA_RIM156 HP_NP_707 TUR_TRUN_KF570384 HP_NP_3767 FIN_Y_KU886000 HP_BS_U93 HP_NP_1084 DP_145412 BP_52777 DP_145413 FIN_EA_7869 TUR_TRUN_KF570385 V_1649 FIN_IP_9560 TUR_AUS_NC022805 HP_BS_U64 FIN_Y_984 DP_145217 FIN_Y_KT852939 DP_1454242 SP_7015 FIN_Y_KR108307 HP_MA_RIM100 HP_BS_U75 ORC_GU187218 HP_NP_8514 HP_NP_3768 FIN_EA_7859 1 2 3 4 5 6 7 8 9 10 11 EAF YFP IPF FP DP2 DP1 DP SP1 SP2 SP BS MA IB NAT NP1 NP2 HP BP V nalt A h tr oN )A N( cit fic aP htr oN )P N( ci 0 1 2 3 4 5 6 7 8 9 10 11 12 13
Miocene Pliocene Pleistocene
Neogene Quat.
Figure 2. Bayesian chronogram of the porpoise family. The tree represents the maximum clade credibility tree. Red node labels indicate posterior probabilities of 1; node position indicates median node age estimates and the error bars around the node indicate the 95% highest posterior density of the estimated node age. Time is in
millions of years. Numbers at the nodes are discussed in the text. The acronyms are provided in Fig. 1.
Figure 3. Nucleotide diversity (π) among species and lineages within species of porpoise. The median and mean π values are represented respectively by the colored line in the boxplot and the black dot. The whiskers represent the 95% confidence interval. The boxes represent the upper and lower quartile. No overlapping boxplots are significantly different. The species are represented by a pictogram on the top of the figure. The names of the distinct lineages are provided at the bottom of the plot in the black boxes. The acronyms are provided in Fig. 1 and Table 1.
The πN/πS ratio in the 13 CDSs, displaying the relative proportion of non-synonymous versus synonymous nucleotide diversity, was lower than one in all the lineages. This is consistent with purifying selection acting on the coding regions. At the species level, the ratio πN/πS ranged from 0.04 in Dall’s and spectacled to 0.10 in finless
porpoises (Table S3). The vaquita displayed an intermediary value of 0.06. Within each species, πN/πS also varied
markedly across lineages: in the harbor porpoise, πN/πS ratios ranged from 0 in the North Pacific NP2 lineage to
0.21 in the Black Sea BS lineage; in the finless porpoises from 0.14 in EAF to 0.17 in YFP; 0.05 in the DP2 Dall’s porpoise lineage; and 0.06 in SP2 spectacled porpoise lineage (Table S3).
The branch-specific non-synonymous to synonymous substitution rates (dN/dS, Fig. S3a) were fairly
con-served across the phylogenetic tree and ranged from 0 in the finless porpoise to 1.08 in the harbor porpoise,
with a median value at 0.12. A dN/dS lower than one implies purifying selection. Thus, similar to πN/πS, the
branch-specific dN/dS suggested that the porpoise mitogenomes were mostly influenced by purifying selection.
Furthermore, the dN/dS ratios did not differ significantly among species (PERMANOVA, p-value = 0.49).
Inter-estingly, the dN/dS ratio was negatively correlated with the nucleotide diversity (Fig. S3b; Pearson’s r = − 0.64,
p-value = 0.01) suggesting that purifying selection removes deleterious mutations more effectively in genetically
more diversified lineages.
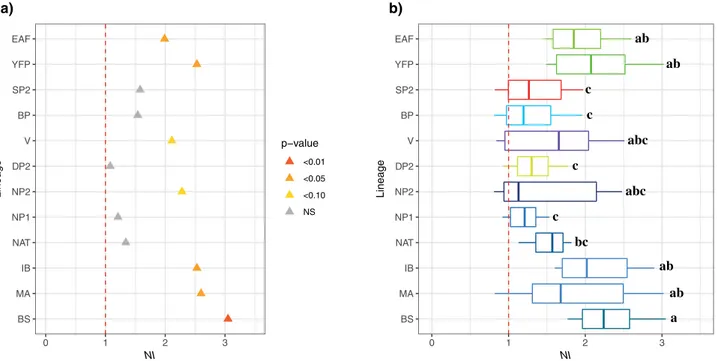
The Mcdonald–Kreitman (MK) tests using first the orca as an outgroup showed that all the lineages for each
species had neutrality index (NI) values greater or equal to one (Fig. 4a). In particular, some lineages displayed
NI values significantly higher than one (G-tests, p-value < 0.05), consistent with a signal of purifying selection.
These included the EAF and YFP lineages in the finless porpoises and the MA, IB and BS in the harbor porpoises
(Fig. 4a). Vaquitas and NP2 harbor porpoises also displayed marginally significant NI values (NI > 2, p-value
≤ 0.10; Fig. 4a). The remaining lineages showed NIs close to one suggestive of selective neutrality. The MK tests
applied to all pairs of interspecific lineages showed NI values often higher than one (Fig. 4b and Fig. S4a). The
values were especially high (Fig. S4a) and significant (Fig. S4b) when comparing the harbor porpoise lineages (MA, IB, and BS) with the finless porpoise lineages (YFP and EAF). The variation in the distribution of NI
among interspecific lineages (Fig. 4b) showed that these same lineages displayed significantly larger NI values
compared to spectacled SP2 and Dall’s DP2 porpoise lineages (PERMANOVA, p-value < 0.001 and all pairwise comparisons have a p-value < 0.04 after False Rate discovery adjustment). We observed a significant negative correlation between π and NI (Pearson’s r = − 0.28, p-value = 0.003), suggesting that purifying selection could be stronger in lineages with small Ne or that demographic events impacted the polymorphism of these lineages.
Demographic history.
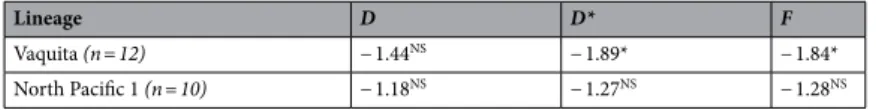
The vaquita displayed significant departure from neutral constant population size expectations with significant negative values for Fu and Li’s D* and F*, and Tajima’s D, even if this latter statisticwas not significantly different from zero (Table 3). This result indicates a significant excess of singleton
muta-tions compared to a neutral expectation, consistent with a bottleneck or a selective sweep. In contrast, the harbor
BS MA IB NAT NP1 NP2 DP2 V BP SP2 YFP EAF 0 1 2 3 NI Lineage p−value <0.01 <0.05 <0.10 NS BS MA IB NAT NP1 NP2 DP2 V BP SP2 YFP EAF 0 1 2 3 NI Lineage ) b ) a a ab ab bc c abc c abc c c ab ab
Figure 4. Mcdonald–Kreitman tests on the 13 protein coding regions of the mitogenome among porpoise subgroups. (a) Neutrality index (NI) estimated using the orca as outgroup. (b) NI distributions per mitochondrial lineages, calculated using various outgroups, including orca and all possible interspecific comparisons. The letters on the right of the boxplots indicate significant differences in the mean NI between the different lineages (i.e. boxplot with different letters are statistically different from one another). The red dashed lines represent the limit at which NI reflects positive (NI < 1), neutral (NI = 1), or purifying (NI > 1) selection. NS not significant. The acronyms are provided in Fig. 1.
porpoise NP1 lineage did not show any such significant deviation, even though all the statistics displayed nega-tive values.
The mismatch distribution and the coalescent-based BSP also captured this contrast (Fig. 5). For the North
Pacific harbor porpoise NP1 lineage, the mismatch distribution was consistent with an ancient population
expan-sion (Fig. 5a) with a modal value close to 20 differences on average between pairs of sequences. Despite the ragged
distribution and large 95% CI, the best fitted model suggested an ancient increase in genetic diversity (θ = 2·Ne·µ) by a factor of 40 after a period (τ = 2·t·µ) of 18 units of mutational time. This old expansion was also detected by
the BSP analysis (Fig. 5c). Indeed, NP1 displayed an old steady increase in Ne with time since the most recent
common ancestor (TMRCA ) 16,166 years before present (years BP) (95% CI 12,080–20,743), with a median Ne
increasing from 1,660 to 6,436 (Fig. 5c). This model was strongly supported over the null hypothesis of a constant
population size with all Bayes factors greater than 6.4. For the vaquita lineage, the mismatch distribution and the
BSP analyses both supported a much more recent expansion than in NP1. The mismatch distribution (Fig. 5b)
showed an increase of θ by a factor of 1,000 after a τ of four units of mutational time. The mode of the bell shape distribution for the best fitted model was around three differences among pairs of sequences, which is
consist-ent with a recconsist-ent population expansion. The BSP analysis (Fig. 5d) captured this expansion and explained the
data significantly better than a constant population size model (Bayes factors > 8.7). This expansion was dated Table 3. Neutrality tests based on the site frequency spectrum. The neutrality tests were only applied to lineages where at the sample size (n) was at least 10. The statistics include the Tajima’s D, Fu and Li’s D*, and Fu and Li’s F. NS Not significant. *p-value < 0.05.
Lineage D D* F Vaquita (n = 12) − 1.44NS − 1.89* − 1.84* North Pacific 1 (n = 10) − 1.18NS − 1.27NS − 1.28NS 0 5 10 15 0 1 2 3 4 5 6 7 8 9 10 Pairwise differences Number of pairs Vaquita Observed 95% CI Expansion Constant ) b ) a V 1 P N c) d) 0 2 4 6 0 4 8 12 16 20 24 28 32 Pairwise differences Number of pairs North Pacific 1 Observed 95% CI Expansion Constant 1 10 100 1000 10000 0 1500 3000 4500 6000 7500 9000 10500 12000 Time (Years) Ne 1 10 100 1000 10000 0 1500 3000 4500 6000 7500 9000 10500 12000 Time (Years) Ne ) d )
c North Pacific 1 Vaquita
Figure 5. Mismatch distributions (a, b) and Bayesian Skyline Plots (BSPs) (c, d) for the North Pacific harbor porpoise 1 (NP1) lineage and the vaquita. The BSPs (c, d) show the temporal changes in mitochondrial diversity. The y-axis of the BSPs shows the genetic diversity expressed as the effective female population size (Ne). The bold line inside each BSPs represents the median value and thin lines the 95% HPD intervals. For both BSPs, the null hypothesis of a constant population size was rejected with a high confidence (Bayes Factors > 6).
back to 3,079 years BP (95% CI 1,409–5,225), with median Ne increasing from 613 (95% CI 45–5,319) to 1,665
(95% CI 276–9,611). Thus, the estimated current Ne was 3–6 times lower than in NP1 (Fig. 5d).
Discussion
The phylogeny of the Phocoenidae has been debated for decades, in part due to the lack of polymorphism and
statistical power that came from the analyses of short fragments of the mitochondrial genome17,42. Using massive
parallel sequences technologies, the analyses of newly sequenced and assembled whole mitogenomes from all the species and sub-species of porpoises provide a robust comprehensive picture of the evolutionary history of
the porpoises. The phylogenetic relationships estimated here delivered a fully resolved evolutionary tree (Fig. 1b
and Fig. S1). While most of the phylogenetic relationships were suggested previously17,42, the resolution and
statistical support recovered here was maximal. Our results support the monophyly and branching of each spe-cies and sub-spespe-cies. Moreover, the comparative view of the mitochondrial polymorphism within and among species provides one of the first attempts to bridge macro- to micro-evolutionary processes in a cetacean group
(see also Ref.84). This perspective across evolutionary time-scales can shed light on the isolation dynamics and
their drivers across the speciation continuum of the Phocoenidae.
New insights into the biogeography of the Phocoenidae.
The biogeographical history of cetacean species has been hypothesized to results of a succession of vicariant and dispersal events influenced bygeologi-cal, oceanic, and climatic reorganization during the Late Miocene, Pliocene and early Pleistocene1,17. Changes
in climate, ocean structure, circulation, and marine productivity opened new ecological niches, enhanced indi-vidual dispersal and isolation, and fostered specialization to different food resources. All these factors promoted
the adaptive radiation in cetaceans which led to the extant species diversity in the odontocete families85. For
example, the Monodontidae and Delphinidae are the closest relatives to the Phocenidae. They originated dur-ing the Miocene and displayed an accelerated evolution marked with the succession of speciation events durdur-ing 3 Myr, leading to the extant species diversity in these groups1,17. The time calibrated phylogeny of the
Phocoeni-dae (Fig. 2) suggests that porpoises also diversified following similar processes during the late Miocene until
the early-Pleistocene (between 6 and 2 Myr). This timing is about 2–3 Myr more recent than those proposed by
McGowen et al.17 and Steeman et al.1. It is worth mentioning that recent estimates proposed by McGowen et al.86
included four of the six porpoise species and were more in line with our estimates. The increase of the genetic information, node calibrations and number of sequences per species are known to influence phylogenetic
infer-ences and divergence time estimates6,87,88. The use of complete mitogenomes, two node calibrations (instead of
one), and several sequences per species in our study likely explain the difference compared to previous studies. Consistent with previous findings17,41,42, the finless porpoises were the first species to split among the
Phoc-oenidae. As the vast majority of the porpoise fossils found so far come from tropical or subtropical regions41,
and considering their current predominant affinity for warm waters, the finless porpoises seem to be the last members of a group of porpoise species that adapted primarily to tropical waters. Interestingly, finless porpoises
further diversified and colonized more temperate waters of the Yellow Sea and Sea of Japan (Fig. 1a). The five
remaining porpoise species diverged ~ 4.0 Myr ago and all but the vaquita occupy temperate regions with an
antitropical distribution (Fig. 1a). Harbor and Dall’s porpoises inhabit the cold water of the Northern hemisphere
whereas spectacled and Burmeister’s porpoises are found in the Southern hemisphere. This result is consistent with the hypothesis that antitropically distributed cetaceans have evolved with the deep environmental changes that occurred during the late Pliocene and as a response to the fluctuations in surface water temperatures in the
tropics, concomitant with the changes in oceanographic currents, marine productivity, and feeding areas1,12,15.
About 3.2 Myr ago, the formation of the Panama Isthmus altered the tropical currents and water temperatures in coastal regions of the Pacific, and throughout the world oceans. It promoted the dispersion of numerous taxa
from the Northern to the Southern Hemisphere89. This process is also a plausible driver that led to the
antitropi-cal distribution of the modern porpoises41.
During the porpoises’ evolutionary history, a symmetric evolution took place approximatively at the same time in both hemispheres resulting in analogous ecological adaptations. In the Northern hemisphere, the split between Dall’s and harbor porpoises ~ 3.1 Myr ago led to offshore versus coastal specialized species, respectively. This pattern was mirrored in the Southern hemisphere with the split between the spectacled and Burmeister’s porpoises ~ 2.1 Myr ago which led also to the divergence between offshore versus coastal specialized species. Such a symmetric habitat specialization likely reflects similar ecological opportunities that opened in both hemispheres and triggered a convergent adaptation in the porpoises. Interestingly, this possible parallel offshore evolution observed in Dall’s and spectacled porpoises would have been accompanied by a convergent highly contrasted countershading coloration pattern with a white ventral side and black dorsal back side in both species. This color
pattern is thought to be an adaptation to the offshore environment serving as camouflage for prey and predators90.
Resources and diet specializations are known to be a major driver of cetacean evolution as their radiation is
linked to the colonization of new vacant ecological niches in response to past changes85. As small endothermic
predators with elevated energetic needs associated with their cold habitat and small size, limited energy storage capacity and a rapid reproductive cycle, porpoises are known for their strong dependency on food availability91,92.
These characteristics reinforce the hypothesis that their adaptive radiation has been strongly shaped by historical variation in food resources and should also be visible at the intraspecific level.