HAL Id: hal-01456980
https://hal.archives-ouvertes.fr/hal-01456980
Submitted on 6 Feb 2017
HAL is a multi-disciplinary open access archive for the deposit and dissemination of sci-entific research documents, whether they are pub-lished or not. The documents may come from teaching and research institutions in France or abroad, or from public or private research centers.
L’archive ouverte pluridisciplinaire HAL, est destinée au dépôt et à la diffusion de documents scientifiques de niveau recherche, publiés ou non, émanant des établissements d’enseignement et de recherche français ou étrangers, des laboratoires publics ou privés.
Authigenic 10Be/9Be ratios and 10Be-fluxes
(230Thxs-normalized) in central Baffin Bay sediments
during the last glacial cycle: Paleoenvironmental
implications
Quentin Simon, Nicolas Thouveny, Didier Bourlès, Laurence Nuttin, Claude
Hillaire-Marcel
To cite this version:
Quentin Simon, Nicolas Thouveny, Didier Bourlès, Laurence Nuttin, Claude Hillaire-Marcel. Authi-genic 10Be/9Be ratios and 10Be-fluxes (230Thxs-normalized) in central Baffin Bay sediments during the last glacial cycle: Paleoenvironmental implications. Quaternary Science Reviews, Elsevier, 2016, �10.1016/j.quascirev.2016.03.0270277-3791�. �hal-01456980�
Authigenic 10Be/9Be ratios and 10Be-fluxes (230Thxs-normalized) in central Baffin Bay
1
sediments during the last glacial cycle: paleoenvironmental implications
2
Quentin Simon,1,*, Nicolas Thouveny1, Didier L. Bourlès1, Laurence Nuttin2, Claude Hillaire-3
Marcel2, Guillaume St-Onge2,3 4
1
Aix-Marseille Université, CNRS, IRD, CEREGE UM34, 13545 Aix en Provence, France 5
2
GEOTOP Research Center, H3C3P8 Montréal, Canada 6
3
Institut des sciences de la mer de Rimouski (ISMER), Canada Research Chair in Marine 7
Geology, Université du Québec à Rimouski 8
*simon@cerege.fr
9
Abstract
10
Authigenic 10Be/9Be ratios and 10Be-fluxes reconstructed using the 230Thxs normalization,
11
proxies of the cosmogenic radionuclide 10Be production rate in the atmosphere, have been 12
measured in a sedimentary core from Baffin Bay (North Atlantic) in order to reconstruct the 13
geomagnetic dipole moment variations during the last ca. 136 ka BP, and for comparison with 14
the relative paleointensity (RPI) record derived from paleomagnetic measurements. Our study 15
revealed that the exchangeable (authigenic) 10Be measured includes a strong climatic 16
component related to the glacial dynamics that characterized the circum Baffin Bay during the 17
last glacial period. Despite normalization applied on the authigenic 10Be concentrations using 18
both the scavenged 9Be and 230Thxs approaches, a strong climatic signal still prevails. Both
19
normalization methods yield equivalent results that are both strongly correlated with 20
sedimentological parameters (grain-size and mineralogy). The lower 10Be/9Be ratio values are 21
associated with coarse-grained carbonate-rich layers while the higher 10Be/9Be ratio values 22
are found with fine-grained felspar-rich sediments. This variability is due to both i) sediment 23
composition control over beryllium-scavenging rates, ii) the glacial history that contributed to 24
modify the 10Be concentration in the oceanic realm and notably boundary scavenging 25
conditions. No pristine geomagnetic field intensity can thus be derived from 10Be 26
measurements in such a high-variability glacio-marine environment. These results also 27
*Manuscript
indicate that the straightforward interpretation of 10Be-concentration variations as a proxy of 28
the Interglacial/Glacial (or major interstadials) cycles in Arctic and sub-Arctic regions must 29
be considered with caution and rather propose to relate 10Be variations to higher-frequency 30
paleoclimatic changes and glacial dynamics. 31
1. Introduction
32
The cosmogenic nuclide Beryllium-10 (10Be) is produced in the stratosphere (~65%) and the 33
troposphere (~35%) by spallation reactions when highly energetic galactic cosmic rays 34
interact with nitrogen and oxygen atoms (Lal and Peters, 1967; Dunai and Lifton, 2014). Its 35
production rate is linked to the Sun and Earth magnetic fields variabilities by a non-linear 36
inverse relationship (Elsasser et al., 1956; Lal, 1988; Beer et al., 1990; Masarik and Beer, 37
2009; Kovaltsov and Usoskin, 2010). After its production in the atmosphere, 10Be is quickly 38
scavenged onto aerosol particles themselves precipitated (or thrown) within ca. 1-3 years into 39
ocean/continent reservoirs by wet or dry deposition processes (Raisbeck et al., 1981; Beer et 40
al., 1990; Baroni et al., 2011). Previous studies have shown that -while solar activity inflects 41
the production rate on shorter timescales- 10Be flux measured along ice and marine sediment 42
sequences reflect long term signatures of the geomagnetic dipole moment (Raisbeck et al., 43
1981, 1985; Yiou et al., 1985; Wagner et al., 2000; Frank et al. 1997; Carcaillet et al., 2003, 44
2004, Muscheler et al. 2004, 2005). The exchangeable-10Be concentrations (i.e., fraction 45
adsorbed onto settling particles) measured in the sediments, henceforth referred to the 46
authigenic 10Be, are not only reflecting the atmospheric production at the time of their 47
deposition but also depend on the scavenging rates from the overlying water column, to 48
advected 10Be fraction due to oceanic mixing and/or to inherited 10Be fraction scavenged 49
during the terrestrial/glacial/meltwater cycling of the carrier particles. Therefore, 50
normalization of the authigenic 10Be concentration is a first step in order to remove these 51
environmental biases and compare 10Be records with geomagnetic variability. 52
Two methods of normalization have been used in literature: (1) normalization of the 53
authigenic 10Be cosmogenic nuclide by the authigenic stable 9Be isotope supplied by 54
terrigenous material entering the ocean (i.e., originating from the dissolution of detrital, 55
aeolian, riverine and glacier inputs). This method relies on the similar behavior of both 56
isotopes once homogenized in seawater (Bourlès et al., 1989; Brown et al., 1992). The 57
authigenic 10Be/9Be ratio method reliably corrects for ocean/continent secondary 58
contributions and provides robust results clearly demonstrating an inverse relationship with 59
the geomagnetic field (Henken-Mellies et al., 1990; Robinson et al., 1995; Carcaillet et al., 60
2003, 2004a, 2004b; Thouveny et al., 2008; Ménabréaz et al., 2011, 2012, 2014; Valet et al., 61
2014). The second normalization process (2) uses the 230Th-excess method proposed by 62
Bacon (1984) to calculate vertical fluxes of any sedimentary component deposited during the 63
Late Quaternary (see François et al., 2004 for a review) and has been used successfully to 64
calculate 10Be-fluxes in numerous studies (e.g., Franck et al., 1997, 2000; Christl et al., 2007, 65
2010). All these studies notably demonstrate that during periods characterized by low dipole 66
strength (i.e., corresponding to episodes of collapsed field during reversals or excursions), the 67
atmospheric 10Be production rates were significantly larger than during periods with high 68
dipole strength. Accordingly, the reconstruction of atmospheric 10Be production rate signals 69
from marine sedimentary sequences constitutes a complementary approach, independent from 70
paleomagnetism, to decipher past geomagnetic dipole moment variations. Furthermore, the 71
comparison between the 10Be signals from mid-to-low-latitude sites (Ménabréaz et al., 2012, 72
2014) as well as with recent simulations using general circulation models (GCMs; Heikkilä et 73
al., 2009, 2013) demonstrate a rapid zonal atmospheric mixing of 10Be before its deposition in 74
geological archives. 75
In the Arctic Ocean where most dating methods encounter serious limitations, the radioactive 76
decay rates of the 10Be measured in marine sediments have been used to establish a Neogene 77
chronostratigraphic framework (assuming a near constant supply of 10Be in first 78
approximation) of the ACEX long sedimentary sequence (Frank et al., 2008). Besides, 79
variations in 10Be concentrations in Arctic and sub-Arctic sediments have also been used in 80
order to constrain the stratigraphy of Late Quaternary sedimentary records assuming that 81
variations of 10Be concentrations roughly represent Glacial/Interglacial cycles or major 82
Interstadial periods (Spielhagen et al., 1997, 2004; Sellén et al., 2009; Alexanderson et al., 83
2014). In this mechanism, the low 10Be concentrations corresponding to glacial periods are 84
caused by a combination of: (1) low inputs of 10Be due to increased sea ice cover and, (2) 85
10
Be dilution related to higher accumulation rates of ice rafted debris (IRD); and vice versa 86
for interglacial (major interstadial) periods. 87
In this study, we present new authigenic 10Be/9Be ratios and 230Thxs-normalized 10Be-fluxes
88
from a high-latitude marine record (HU2008-029-016PC) from central Baffin Bay and 89
spanning the last 136 ka. This paper includes a revision of the initial chronostratigraphy of the 90
core (Simon et al., 2012) in order to improve the robustness of the chronology for the bottom-91
half of the core. A primary aim of the study was to examine if 10Be originating from 92
continental inputs or advected through oceanic circulation and glacial processes could be 93
removed from the total authigenic 10Be concentrations by means of normalization procedures 94
before any geomagnetic interpretations. We compare the two existing normalization methods 95
(i.e., authigenic 9Be and 230Thxs) using a U and Th-series isotope record from the same core
96
(Nuttin and Hillaire-Marcel, 2015) and discuss 10Be-systematics vs. sedimentological 97
parameters, geomagnetic dipole moment variations, 10Be-fluxes from models and marine/ice 98
records, and, finally, we discuss its paleoenvironmental implications. 99
2. Environmental setting
100
Baffin Bay is a subpolar oceanic basin (1300 km long and 450 km wide, ∼690 000 km2) 101
located in the northwest North Atlantic (Figure 1). The bay is one of the main export routes of 102
freshwater from Greenland, the canadian Arctic and the Arctic Ocean into the North Atlantic 103
Ocean. Its morphology consists of an elongated abyssal plain (2000–2500 m) surrounded by 104
the continental shelves of Greenland and Baffin Island. During the glacial periods, the 105
northeastern Laurentide Ice Sheet (LIS), the Innuitian Ice Sheet (IIS) and the Greenland Ice 106
Sheet (GIS) formed a nearly continuous and highly dynamic ice belt surrounding Baffin Bay 107
(Figure 1). On the Greenland side, the GIS extended westward over the inner shelf, and as far 108
as the shelf edge off Disko Bugt and the Uummannaq Trough during the Last Glacial 109
Maximum (LGM) (Ó Cofaigh et al., 2012, 2013; Funder et al., 2011). The LIS extended 110
through Baffin Island, probably as far as its fjord mouths and inlets, and possibly over part of 111
the Baffin Island shelf during glacial maxima (Margold et al., 2015). In the northern end of 112
the bay, ice streams in the Smith Sound and Lancaster sounds were particularly large and 113
active (England et al., 2006; Klassen and Fisher, 1988; Li et al., 2011) and probably 114
developed into an ice shelf towards the bay (Alley et al., 2010; Marcott et al., 2011). 115
Numerous studies have demonstrated strong relationships between glacial dynamic, oceanic 116
circulation and sedimentary processes in the bay (Aksu, 1985, 1987; de Vernal et al., 1987; 117
Andrews et al., 1998, 2014; Jennings et al., 2014; Simon et al., 2014; Nuttin and Hillaire-118
Marcel, 2015). Sedimentation occurs through two main processes: (1) glacial plumes from 119
lateral sources with large volumes of fine-grained feldspar-rich sediments, which were 120
transported to the area by sediment-laden supraglacial and subglacial meltwater or nepheloid 121
layers and (2) Trans-Baffin icebergs drifting from the northern end of the bay with large 122
volumes of coarse-grained carbonated sediments, leading to the deposition of so-called Baffin 123
Bay Detrital Carbonate layers (BBDC; Simon et al., 2014). 124
3. Material and methods
125
3.1. Core description 126
Core HU2008-029-016PC (70°46.14 N/-64°65.77 W; PC16 hereinafter) was raised from a 127
2063 m water depth, on the abyssal plain from central Baffin Bay. The 741-cm long core was 128
retrieved using a piston corer during the 2008-029 CCGS Hudson cruise (Campbell and de 129
Vernal, 2009). The sediment sequence is mainly composed of a succession of homogeneous 130
dark gray to olive-gray silty clayey units and of very poorly sorted grayish-brown gravelly 131
and sandy carbonate-rich layers (dolomite rich, Figure 2). These two lithofacies reflect the 132
origin, transport and mode of deposition of the lithogenic sediments related to the ice sheet 133
dynamics evoked above. Moreover, the top of the core down to 20 cm is characterized by 134
brown to dark brown silty muds while the interval between 120 and 215 cm is constituted by 135
brownish-black to olive-black clayey muds. These two distinct lithofacies represent sediments 136
deposited respectively during the Holocene and during marine isotope stage (MIS) 2 (see 137
Simon et al., 2012, 2014, in prep. and Simon, 2013 for additional information). 138
3.2. Paleomagnetic results and chronology 139
The relative paleointensity (RPI) record previously established by a detailed paleomagnetic 140
analysis (Simon et al., 2012) reinforced and completed preliminary paleomagnetic results 141
obtained on a shorter core from the same site (Thouveny 1988). The RPI proxy (Figure 2) is 142
based on the normalization of the Natural Remanent Magnetization (NRM) with the 143
Anhysteretic Remanent Magnetization (ARM) over the 25-35 mT AF demagnetization 144
interval (NRM25-35mT /ARM25-35mT). With the exception of few problematic layers, the ARM
145
normalizer activates the same magnetic assemblages than the NRM, and the RPI proxy 146
presents no correlation with lithological proxies. Moreover, the derived RPI record was 147
favorably correlated with RPI reference curves and stacks in order to establish the initial 148
chronology of the core (Simon et al., 2012). These reference records included mainly the 149
North Atlantic relative paleointensity stack NAPIS-75 (Laj et al., 2000) and the Labrador Sea 150
core MD95-2024 (Stoner et al., 2000). Two large inclination variations coeval with 151
paleointensity lows allowing the recognition of two major geomagnetic excursions, i.e., the 152
Laschamp and Norwegian-Greenland-Sea excursions, and three-radiocarbon ages further 153
supported the age model (see Simon et al., 2012 for details). This initial chronology is 154
considered robust for the MIS 2-3-4 periods with a high correlation between PC16 and the 155
NAPIS-75 stack (r=0.82 between 22-75 ka, Figure 2) and remains unchanged in this study. 156
For the lower part of the core, large chronological uncertainties (correlation coefficients with 157
reference records <0.51) required revision in order to improve its resolution and to compare 158
10
Be production rate variations with references. Therefore, the chronology of core PC16 was 159
updated by tuning the PC16 RPI curve with the ODP 1063 RPI record (Channel et al., 2012) 160
using 13 tie points (r=0.70 between 75-136 ka, Figure 2). The age model for ODP Site 1063 161
was constructed by tandem correlation of oxygen isotope and RPI data to calibrated reference 162
templates using the Match protocol (Lisiecki and Lisiecki, 2002), improving its reliability. 163
The revised age model offers a significantly improved statistical robustness and places the 164
PC16 core bottom (741 cm) in the MIS 6 interval representing a 20 ka age shift from the 165
Simon et al. (2012) age model. Using this refined age model, the average sedimentation rate 166
for the sedimentary sequence is 5.4 cm/ka and presents large variability mainly related to 167
glacial/deglacial history. The mean sedimentation rates during the Holocene (0-10.6 ka), 168
Deglacial-peak (10.7-12 ka) and last Glacial (12.1-136.7 ka) periods are 1.9 cm/ka, 25.8 169
cm/ka and 5.5 cm/ka, respectively (Figure 8). 170
3.3. Sample preparation 171
Based on the paleomagnetic record and on U and Th-series isotope records, 76 subsamples of 172
~1 g (dry sediment) were collected along core PC16 and processed for the Be isotope analysis 173
at the CEREGE National Cosmogenic Nuclides Laboratory (France) according to the 174
chemical procedure set-up by Bourlès et al. (1989) and summarized in Carcaillet et al. (2003, 175
2004a, 2004b) and Ménabréaz et al. (2011, 2012, 2014). The method is detailed here since the 176
separation procedure has been modified prior to the AMS measurements. 10Be and its stable 177
isotope 9Be were co-extracted from the authigenic phase of the sediments using 20 ml.g-1 178
sediment of 0.04 M hydroxylamine (NH2OH-HCl) in a 25% acetic acid leaching solution at
179
95 ± 5°C for 7 hrs. A 2 ml aliquot of the resulting leaching solution was sampled for the 180
measurement of the natural 9Be concentration. The remaining solution was spiked with 300 μl 181
of a 9.8039.10-4 g.g-1 9Be-carrier before the chemical extraction in order to accurately 182
determine 10Be sample concentrations from the measured 10Be/9Be ratios. The Be-purification 183
was realized by chromatography in two stages. Before each separation stages, the samples 184
were evaporated and then dissolved in ultra-pure HCl. Be oxy-hydroxides were precipitated at 185
pH 8.5 from the solution by adding NH3. The precipitate was separated by centrifugation,
186
dissolved in ultra-pure HCl and then loaded onto an exchange column. The iron (Fe) and 187
manganese (Mn) were separated using a Dowex® 1x8 (100–200 mesh) anion-exchange resin. 188
The resin was first rinsed with 20 ml MilliQ water and conditioned with 20 ml 10.2 M HCl. 189
The sample was then loaded onto the column and the Be fraction was collected immediately 190
using 20 ml 10.2 M HCl for elution. The next purification step was carried out on a Dowex® 191
50x8 (100–200 mesh) cation-exchange resin in order to separate the Bore (B) and Aluminum 192
(Al). The resin was rinsed with 30 ml MilliQ water and then conditioned with 30 ml 1 M HCl. 193
After sample loading onto the column, the B and Be were eluted successively within the first 194
40 ml and next 120 ml of 1 M HCl eluent while the Al remained trapped within the column. 195
After the two separation stages, Be oxy-hydroxides were precipitated at pH 8.5 from the final 196
solution by adding NH3. The precipitate was separated by centrifugation, rinsed by
re-197
suspension using pH 8.5 buffered MilliQ water and centrifugated again. The purified Be oxy-198
hydroxides were solubilized in HNO3 and the resulting solution was transferred into a quartz
crucible where it was gently evaporated to dryness at 200°C. Finally, the Be oxy-hydroxides 200
deposit was oxidized and converted to BeO by heating at 800°C for 1 hr. The BeO was then 201
mixed with Nb powder and pressed into a cleaned Ti cathode-holder in order to condition the 202
samples for AMS measurements. In addition to sample processing, several routine blanks and 203
2 replicates were measured in order to assess both cleanliness and reproducibility during the 204
chemical extraction. 205
3.4. Measurements 206
The natural authigenic 9Be concentrations were measured using a graphite-furnace Atomic 207
Absorption Spectrophotometer (AAS) with a double beam correction (Thermo Scientific ICE 208
3400®). The standard-addition method and the addition of a constant volume of MgNO3
209
solution (matrix modifier) were used to eliminate the matrix effects during the absorption and 210
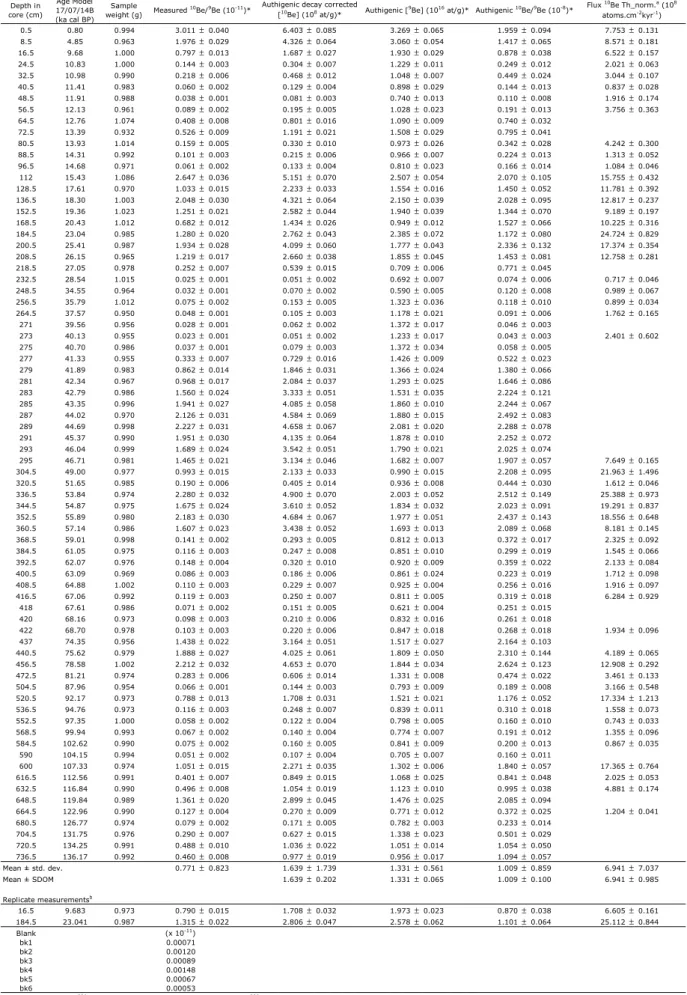
to allow measurements near the detection limit. 9Be sample concentrations (Table 1) were 211
determined from repeated absorbance measurements (4 times) performed on each of the four 212
100 μl aliquots of the sample solution, three of them being spiked with increasing amount of a 213
Sharlau 9Be-carrier diluted to a known concentration (0.27 - 0.34 × 10⁻⁸ g.g-1) using HNO3
214
0.2%. The standard deviation of repeated absorbance measurements for each sample must be 215
less than 3% to be accepted. After correcting for sample dilution, the authigenic 9Be sample 216
concentrations along core PC16 vary around 1.99 ± 0.83.10-7 g.g-1. The associated 217
uncertainties (2σ) varying from 0.4 to 3.2% (average value: 1.5%) are based on the 218
reproducibility of measurements and the least-square fitting between measured absorbance at 219
each stages of the standard-addition method (r2 > 0.9995). 220
The natural authigenic 10Be concentration measurements were performed at the French AMS 221
national facility ASTER (CEREGE). 10Be sample concentrations are calculated from the 222
measured spiked 10Be/9Be ratios normalized to the NIST 4325 Standard Reference Material 223
(2.79±0.03 x 10⁻¹¹; Nishiizumi et al., 2007), and are decay-corrected using the 10Be half-life 224
(T1/2) of 1.387 ± 0.012 Ma (Chmeleff et al., 2010; Korschinek et al., 2010):
225 Authigenic
10Be at decaycorrected 109Be Be M
9Be atmspike 9Be
spike NA M9Be e ln(2) T1/2 t (1) 226where: (10Be/9Be)M is the measured Be ratio; mspike and 9Bespike are respectively the mass
227
and the concentration of the added spike; NA is the Avogadro constant (6.02214.1023 mol-1);
228
M9Be is the beryllium Molar Mass (9.0121822 g.mol-1) and t is the time. The 9Be 229
concentrations measured at the AAS are transformed in atoms as follow: 230 Authigenic
9Be at 9Be
AASm'sample NA M9Be (2) 231where: 9BeAAS is the concentration of natural authigenic 9Be measured at the AAS and
232
m'samplemsample(mleachedmaliquot
mleached ) is the weight of sediment remaining after aliquot
233
sampling. 234
The uncertainties (2σ) in the measured 10
Be/9Be ratios and in the calculated 10Be 235
concentrations result from statistical and instrumental error propagation (Arnold et al., 2010) 236
and vary from 1.3 to 3.7% (average value: 2.2%). 237
The authigenic natural 10Be/9Be ratios are derived using equations (1) and (2): 238
(3) 239
The measured and calculated ratios and their uncertainties are presented in Table 1. The 240
uncertainties (2σ) of the calculated authigenic 10
Be/9Be ratios are derived from the 241
propagation of both uncertainties and vary between 2.9 and 9% (average value: 5.5%). 242
Chemistry blank ratios range from 5.3 × 10⁻¹⁵ to 1.5 × 10⁻¹⁴, which is at least 3 orders of 243
magnitude lower than the sample 10Be/9Be ratios. 244
3.5. Measurements of 230Thxs in Baffin Bay sediments
245
In this study, we benefit from recent U and Th-series isotope results from PC16 in order to 246
calculate 10Be-fluxes (230Thxs-normalized). The measurements and calculation used for
247
determining 230Thxs are detailed in Nuttin and Hillaire-Marcel (2015). The estimated initial
248
230
Thxs activities, recalculated in respect to the revised chronology, are extremely variable
249
ranging from 0.1180.081 to 5.2930.212 dpm.g-1 (1.145 dpm.g-1 on average with a standard 250
deviation of 0.977). Except for few samples, large surplus of 230Thxs above the production
251
from dissolved-U decay in the overlying water column points toward a sediment-focusing 252
environment related to ice margin dynamics during the last glacial period. The preserved, 253
decay-corrected, 230Thxs-normalized 10Be deposition rates (referred to 10Be-fluxes hereinafter)
254
are calculatedas follow: 255 Flux
10Be 10Be
at / gdecay.corrected Z230 0A Th230xs (4) 256where: 10Bedecay.corrected is the 10Be concentration at the time of deposition in atoms per gram 257
of sediment; Z is the water depth (2063 m); 230 is the 230Th production rate from the seawater
258
234
U decays throughout the water column (2.67.10-2 dpm.m-3.y-1; François et al., 2004) and 259 0A Th230xs AThxs230e ln(2) T1/ 2 t
is the scavenged 230Thxs concentration at the time of deposition.
260
The uncertainties (2σ) of the calculated 10
Be-fluxes are derived from the propagation of both 261
uncertainties and vary between 1.6 and 25.1% (average value: 5.0%). Note that solely 2 262
samples have uncertainties above 10% representing probable measurement outliers. The water 263
depth was considered constant in first approximation for the calculation. The Th analyses 264
have been performed after total digestion of 1 g of sediment, while Be isotopes were extracted 265
from 1 g of sediment after partial leaching (in order to avoid the extraction of matricial Be; 266
Bourlès et al., 1989). Given the difference of these two approaches, the 10Be-fluxes calculated 267
here thus represent minimal values. This should be considered when comparing our results 268
against reference values, but it does not prevent any qualitative interpretations. A constant 269
leaching efficiency of ~60 % (Bourlès et al., 1989) has been verified based on the results from 270
Ménabréaz et al. (2011) and Ménabréaz (2012) and can be use for calibration. 271
4. Results and discussion
272
Sample concentrations, ratios and fluxes are listed in Table 1 and presented vs. depth along 273
the core photos, CT-Scan images and description in Figures 3 and 5. Sample ratios and fluxes 274
are presented vs. age in Figures 7 and 8. Note that all results and statistical averages are 275
reported hereafter with a 2 uncertainty. 276
4.1. Authigenic 10Be and 9Be concentrations 277
The authigenic 10Be (decay-corrected) concentrations vary from 0.0510.002 to 6.4030.085 278
x 108 at.g-1 (mean: 1.64 108 at.g-1; =1.74). Such broad variability (> 2 orders of magnitude) 279
is unusual in marine records where 10Be concentrations usually vary by factors of 2 or 3. 280
Comparable large amplitude variation was only found in few polar cores from the Lomonosov 281
Ridge (central Arctic), Fram Strait and the Ross Sea (Antarctica) where 10Be concentration 282
ranging from 0.2 to 19.5 x 10⁸ at.g-1 (Eisenhauer et al., 1994; Spielhagen et al., 1997, 2004; 283
Aldahan et al., 1997; Sjunneskog et al., 2007) were interpreted as paleoclimatic signals with 284
high (resp. low) 10Be concentrations during Interglacial or major Interstadial (resp. Glacial) 285
periods. Given the temporal resolution of core PC16, we can argue that in Baffin Bay the 10Be 286
concentration varies on shorter time scales and is not directly related to Glacial/Interglacial 287
cycles contrary to the mechanism proposed for the Arctic Ocean. The mean 10Be 288
concentrations in Baffin Bay are slightly lower than values from the central Arctic and 289
Arctic/Nordic Seas of 3-4 x 10⁸ at.g-1 and 6.7 x 10⁸ at.g-1, respectively (Frank et al., 2008; 290
Eisenhauer et al., 1994; Aldahan et al., 1997), as well as with values from lower latitude sites 291
such as the Portuguese margin and the Golf of Papua: ~4.4 x 10⁸ at.g-1 and ~5.6 x 10⁸ at.g-1, 292
respectively (Carcaillet et al., 2004b; Ménabréaz et al., 2011, 2014). A strict interpretation of 293
the 10Be concentration in term of atmospheric fluxes between distinct sites must be avoided 294
because of environmental parameters. However, the overall low 10Be concentration from 295
Baffin Bay compared to low-latitude and Arctic sites suggests relatively reduced 10Be inputs 296
to the coring site (especially within the very low 10Be concentration interval at 232-275 cm 297
depth). 298
The authigenic 9Be concentrations vary from 0.6210.004 to 3.2690.065 x 1016 at.g-1 (mean: 299
1.33 1016 at.g-1; =0.56). The variability of 9Be concentration is about 25 times lower than the 300
10
Be variation. Still, this range of variation (~5 times) is larger than the variability observed in 301
lower-latitude marine cores (~2 times), advocating for important 9Be transport and deposition 302
changes along core PC16. The mean 9Be concentration values from PC16 are lower than 303
those from the Portuguese margin and the Golf of Papua, 2-4 x 10¹⁶ at.g-1, but slightly higher 304
than values from the central Arctic (0.6-1 x 10¹⁶ at.g-1) and from ODP983 site (~0.25 x 10¹⁶ 305
at.g-1; Knudsen et al., 2008). Notwithstanding specific interpretations related to each sites, 306
this comparison reveals the strong association between 9Be concentration and terrigenous 307
inputs (e.g., Bourlès et al., 1989; Brown et al., 1992). We can argue that the central and 308
deepest part of Baffin Bay is a sediment-focusing area that received slightly more 9Be inputs 309
than deep open ocean basins because of its proximity to continental margins and the reduced 310
size and shape of the bay. This is in accordance with the U-Th results from PC16 (Nuttin and 311
Hillaire-Marcel, 2015). 312
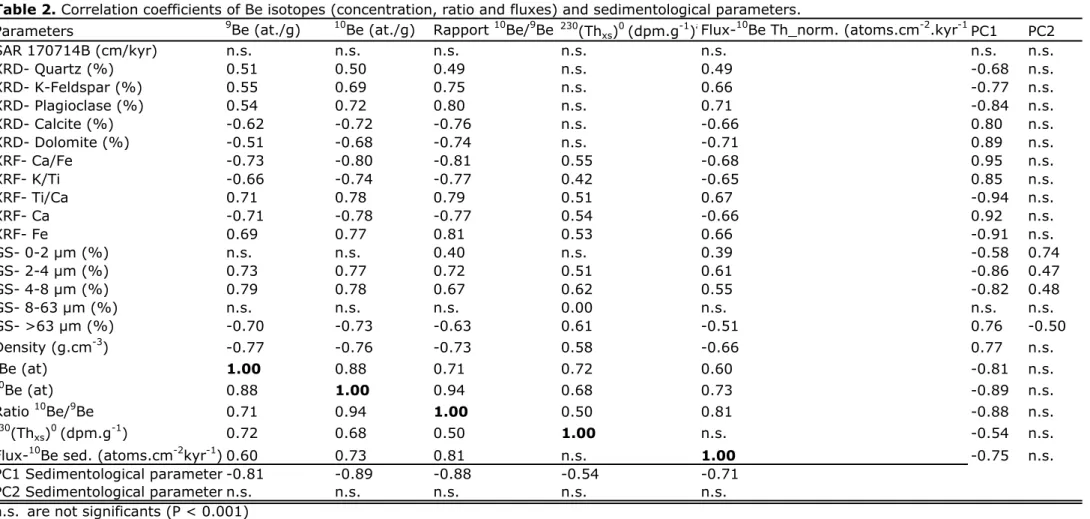
The fluctuations of 10Be and 9Be concentrations present a high correlation coefficient (r=0.88, 313
Table 2), suggesting that sources of 10Be and 9Be into the bay (Figure 3) are both located on 314
the boarding continents and that the atmospheric 10Be component directly precipitated over 315
the bay likely represents minor amounts compared to these large inputs of continental origin. 316
4.2. Authigenic 10Be/9Be ratios 317
The authigenic 10Be/9Be ratios ranging from 0.0430.003 to 2.6240.123 x 10-8 (mean: 1.01 x 318
10-8; =0.86) disclose a variability over almost 2 orders of magnitude very similar to those of 319
10
Be and 9Be concentrations. The fact that authigenic 10Be/9Be ratio values are broadly 320
coherent with 10Be/9Be ratio values ranging from 0.36 to 1.54 x 10⁻⁸ measured in Arctic rivers 321
(Franck et al., 2009) supports the continental origin of the dissolved beryllium in Baffin Bay. 322
Measurements from the Baffin Bay watersheds are however required to further discuss this 323
issue. The authigenic 10Be/9Be ratio population can be divided in two groups: values (1) lower 324
than 10-8 and (2) higher than 10-8 (Table 1, Figures 3, 5 and 6). The first group has 10Be 325
concentrations and 10Be/9Be ratios similar to those found within poorly sorted diamicton 326
layers of the Ross Ice Shelf (Sjunneskig et al., 2007) and of Arctic sediments of the last 350 327
kyr (e.g., Aldahan et al., 1997). They are thus coherent with other records from Polar 328
Regions. The second group presents higher values in range with the lower limits of authigenic 329
10
Be/9Be ratios from mid-to-low-latitude cores with similar sedimentation rates (Carcaillet et 330
al., 2004b; Ménabréaz et al., 2014). This nearly bi-modal distribution of the authigenic
331
beryllium concentrations and ratios presents a strong affinity with lithofacies changes 332
(Figures 3 and 5). 333
4.3. Beryllium and sedimentological features 334
From the authigenic Be result variations presented above, questions arise about the nature of 335
the forcing parameters. In order to understand the links with lithofacies changes, core PC16 336
offers a unique opportunity because of the numerous multi-proxy results available. The 337
detailed sedimentological features of core PC16 have been largely presented and discussed 338
elsewhere (see Simon et al., 2012, 2014, in prep.; Simon, 2013; Nuttin and Hillaire-Marcel, 339
2015 for details) and are beyond the scope of this paper. Sediment compositional variability 340
in core PC16 is a combination of changes in sediment delivery, transport and provenance 341
directly related to ice margin dynamics (Simon et al., 2014). This variability is illustrated here 342
by grain-size (bulk and magnetic), density (CT number), XRF Ca/Fe and XRD Carbonate 343
percents along with the images and CT-Scans of core PC16 (Figures 3 and 8) and summarized 344
by a principal component analysis (PCA; Table S1, Figure 4) that disentangle the main 345
compositional (mineralogy and grain-size) changes. The first principal component (PC1) 346
accounts for 61% of the total variance and has positive loadings with proxies of coarse detrital 347
carbonate layers such as dolomite and calcite (XRD), XRF Ca, density and >63 m %; and 348
negative loadings with proxies related to finer sediments, feldspars (XRD) and XRF Fe and Ti 349
(Figures 3 and 4; Table 2). It highlights the two main sedimentation features from Baffin Bay: 350
i.e., coarse-grained carbonate-rich sediments transported by icebergs and sea ice originating
351
from the northern end of the bay against fine-feldspar rich sediments originating from 352
Greenland and Baffin Island (Simon et al., 2014). 353
Table 2 presents the correlation coefficients between Be isotopes and the sedimentological 354
parameters. As suggested from Figures 3 and 7, the high correlation coefficients between PC1 355
and Be isotopes and ratios (>-0.8) express a strong association with sedimentological 356
parameters. The authigenic beryllium values (10Be, 9Be and 10Be/9Be ratios) generally present 357
significant increases at levels corresponding to fine grained feldspar-rich intervals associated 358
with increases of clay minerals (30-50%; Simon et al., 2014) while coarse carbonate-rich 359
sediments (30-40% dolomite and 10-15% calcite) are characterized by lower Be values 360
(Figure 3). This pattern is consistent with the scavenging efficiency of dissolved Be that 361
depends on the composition and size of the particles available in the water column. The 362
authigenic beryllium (10Be, 9Be and 10Be/9Be ratios) and thorium-excess (230Thxs) distribution
363
are strongly grain size dependent, with significant positive correlations with very fine to fine 364
silts (2-8 m) while clays (0-2 m) and medium to very coarse silts (8-63 m) does not 365
present any significant correlations (Table 2). The high correlation of authigenic Be isotopes 366
with the 2-8 m fraction rather than with the clay-sized material is intriguing because we 367
expected larger association with the smaller particles (because of their higher specific surface 368
area available). We tentatively explain these results by the cohesive behavior of the clay-sized 369
material that tends to form aggregate. These aggregates would have faster sinking rates and 370
lower specific surface area available for the adsorption of dissolve Be explaining higher 371
scavenging rates associated with very fine to fine silts. To the opposite, the authigenic Be 372
concentrations and ratios are significantly anti-correlated with the coarser intervals (>63 m, 373
Figure 3) related to iceberg transported sediments (i.e., BBDC). Despite an overall similar 374
behavior of both isotopes in respect to sedimentary parameters, the authigenic 10Be 375
concentrations and authigenic 10Be/9Be ratios are usually slightly more correlated with 376
sedimentological parameters than 9Be isotopes. We interpret this difference by distinct 377
sources and transport processes between both isotopes. The continental inherited-10Be (i.e., 378
atmospheric 10Be deposited onto ice-sheets) are derived from the melting and calving of ice 379
sheets and are released in the water column during the ice melting, while the 9Be isotopes are 380
mainly coming from the mechanical erosion of bedrocks at the basal interface of ice streams. 381
It is likely that a fraction of the dissolved 9Be isotopes was scavenged rapidly on the 382
continental margins within the buoyant turbid meltwater plumes or nepheloid layers (i.e., re-383
suspension of fine sediment particles by bottom currents) due to higher particles 384
concentration (Bacon and Rutgers van der Loeff, 1989) while the 10Be transported within 385
icebergs or sea ice was exported farther from the sources. A fraction of 9Be would thus be 386
immobilized in glacial/river estuaries (Kusakabe et al., 1991) and removed from the water 387
column within the less saline meltwater plumes on the inner-shelf (Frank et al., 2009; Ó 388
Cofaigh et al., 2013) rather than being transported to the centre of the bay. Therefore, despite 389
complex relationships between granulomery and mineralogy of these sediments, we can claim 390
that the authigenic 10Be signatures in Baffin Bay reveal local marine and glacial influences 391
from the surrounding continents instead of reflecting a global 10Be-production signal. 392
4.4. 10Be-fluxes (230Thxs-normalized)
393
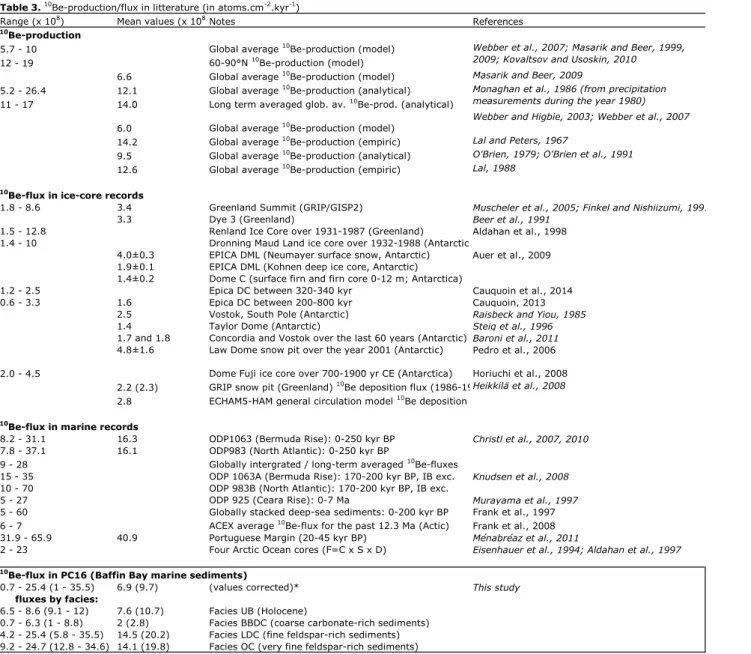
The preserved vertical 10Be deposition rates (10Be-fluxes) varies from 0.7170.046 to 394
25.3880.973 x 108 at.cm-2.ka-1 with a mean value of 6.94 x 10⁸ at.cm-2.ka-1 and a standard 395
deviation of 7.037 expressing a large variability (Table 1, Figure 5). When increased by a 396
factor of 40%, to encompass the methodological bias induced by the partial leaching of Be 397
isotopes vs. the total digestion of Th (see section 3.5), the 10Be-fluxes are oscillating between 398
1.0040.065 to 35.5441.362 x 108 at.cm-2.ka-1 with an average of 9.72 x 10⁸ at.cm-2.ka-1 399
(Table 3). The Holocene average 10Be-flux is estimated at 7.60.2 x 108 at.cm-2.ka-1 (10.70.2 400
x 108 at.cm-2.ka-1 value corrected), while during the glacial period the fluxes oscillated around 401
14.30.5 (20.10.7) and 2.00.2 (2.80.2) x 108 at.cm-2.ka-1 within the carbonate-free and 402
carbonate-rich layers, respectively (carbonate layers are highlighted by white banding in 403
Figures 3 and 5). The Holocene 10Be-fluxes are similar with the actual 10Be production of 404
12.1±0.3 x 10⁸ at.cm-2.ka-1 (Monaghan et al., 1986). During the glacial period, results of 10 Be-405
fluxes ranging from 0.7 to 25.4 x 10⁸ at.cm-2.ka-1 are coherent with the bulk 10Be-fluxes 406
calculated in the Arctic and Fram Strait that range from 2 x 10⁸ to 33 x 108 at.cm-2.ka-1 407
(Eisenhauer et al.; 1994; Aldahan et al., 1997). Despite an obvious sedimentological 408
relationship in core PC16, and at the exception of few intervals, the 10Be-fluxes are 409
compatible with the modeled 10Be-production range: 3 to 27 x 108 at.cm-2.ka-1; with the 410
10
Be-fluxes from ice and marine records which range from 1.2 to 70 x 108 at.cm-2.ka-1, and 411
with the globally integrated and long-term averaged 10Be-fluxes into marine sediments 412
varying between 9 to 28 × 108 at.cm-2.ka-1 (see Table 3 for details and references). The lowest 413
10
Be-fluxes that characterized the BBDC layers are also rather similar to those found within 414
the Ice Summit record of GISP2: 2 to 6 x 10⁸ at.cm-2.ka-1 (Muscheler et al., 2004). It is 415
puzzling to obtain 10Be-fluxes similar to ice core records in core PC16 given the strong 416
lithogenic imprint. This similarity might be explained by a smoothing of the 10Be cosmogenic 417
nuclide signal related to the long-lasting deposition/drift onto the regional ice-sheets and by 418
the thick sea ice and/or ice-shelf cover during glacial periods. The relatively low 10Be-fluxes 419
calculated in Baffin Bay would thus likely represent a 10Be production signal buffered by the 420
glacial factors controlling the 10Be inputs and transport within the water column. Furthermore, 421
these low 10Be-fluxes from Baffin Bay are also coherent with the low depositions of 10Be in 422
Greenland and in the Arctic Ocean (Eisenhauer et al., 1994; Spielhagen et al., 1997) likely 423
due to atmospheric circulation patterns and the distribution of precipitation in the northern 424
hemisphere (Heikkila et al., 2013; Frank et al., 2009). 425
4.5. Testing the 10Be/9Be ratios and 230Thxs-normalized 10Be fluxes methods
426
The two existing normalization methods were independently used in former studies, but only 427
two studies applied the two methods on the same sedimentary core. The first study by 428
Knudsen et al. (2008) obtained large uncertainties about 230Thxs values precluding their use
429
for reliable normalization. The second study by Ménabréaz et al. (2011) demonstrated close 430
agreement of the results obtained by the two methods based on a small number of samples. In 431
PC16, the 10Be-flux variability calculated using the 230Thxs method is similar to that of the
432
authigenic 10Be/9Be ratios measured at the same depths (Figure 5). The high correlation 433
coefficient (r=0.81) and coherence between the two signals provide strong evidence that the 434
two normalization processes yield equivalent results in a very contrasted environment where 435
large compositional variations prevailed (Figures 5 and 6, Table 2). It somehow demonstrates 436
that normalizing authigenic 10Be concentrations by authigenic 9Be concentrations permits an 437
accurate correction for the total particle flux variation. Both normalization processes present 438
large variations directly related to lithofacies changes (Figure 3). The normalizers (i.e., 230Thxs
439
and 9Be) are highly correlated (Table 2) which might seem surprising given the distinct 440
affinities (depending on particle composition) and the different scavenging residence times of 441
both elements in the open ocean (10-50 years for Th against 500-1000 years for Be, Chase et 442
al., 2002). The large domination of glaciomarine lithogenic particles presenting strong surface
443
reactivity with both nuclides probably explained the first assertion (Roy-Barman et al., 2005, 444
2009). Our results also suggest quicker adsorption rates and thus shorter scavenging residence 445
time for dissolved Be within the Baffin Bay water column probably related to the high 446
concentration of lithogenic particles. This is coherent with previous results from the Arctic, 447
North Atlantic basin and circum-Antartica where lower scavenging residence time for Be 448
isotopes of about 80-200 years associated with high particles concentration and oceanic 449
mixing have been proposed (von Blanckenburg et al., 1996, 1999; von Blanckenburg and 450
Bouchez, 2014; Frank et al., 2009). An oceanic circulation/mixing influence over the 451
authigenic Be signal into Baffin Bay during the glacial period is also supported by higher 452
correlation coefficients between both normalization methods when considering the rare 453
episodes of Arctic Waters overflow through the Davis Strait (illustrated by blue dots in 454
Figures 5 and 6). These episodes have been demonstrated within core PC16 by the occurrence 455
of short periods of 230Thxs export (230Thxs-losses, Nuttin and Hillaire-Marcel, 2015).
456
4.6. Comparison with relative paleointensity 457
In core PC16, the comparison of 10Be-proxies with the RPI record does not demonstrate any 458
clear relationship (Figure 7). No systematic increases of authigenic 10Be/9Be ratios and 10 Be-459
fluxes are observed during the large RPI lows corresponding to the Laschamp, Norwegian-460
Greenland Sea and post-Blake/Blake events (Figure 7). The authigenic 10Be/9Be ratios and 461
10
Be-fluxes do not present any significant correlation coefficients with the RPI record (Figure 462
7, Table 2). This absence of correlation with the RPI record clearly supports the dominance of 463
the environmental imprints –as discussed above- on the 10Be deposition in Baffin Bay. The 464
high correlation (r=0.83) between the RPI normalizers (such as the ARM) and the authigenic 465
10
Be/9Be ratios also indicates a strong environmental imprint related to specific grain-size 466
ranges that insure maximum Be adsorption rates (namely the very fine to fine silt range is 467
highly correlated with the ARM: r=0.7). The strong correlation of the 10Be-proxies with 468
environmental parameters suggests a local signature related with the succession of events 469
driven by paleoclimatic controls precluding any interpretation of the 10Be-proxies in term of 470
geomagnetic variability. On the opposite, our findings provide strong evidence supporting the 471
use of the cosmogenic nuclide 10Be as a stratigraphic marker in the Arctic and sub-Arctic 472
regions as suggested by several authors (Eisenhauer et al., 1994; Spielhagen et al., 1997; 473
Aldahan et al., 1997; Frank et al., 2008). 474
5. Paleoenvironmental implications
475
The quasi bi-modal distribution of Be results in core PC16 corresponding with the main 476
Baffin Bay sedimentary features (Figure 3) and the temporal resolution of Be variations 477
suggest glacial dynamics as the main forcing parameter to explain Be inputs and transport 478
changes. The most striking features of this glacial dynamic around Baffin Bay is the 479
variability of the GIS limits over the Greenland continental shelf and the ice streaming events 480
from the LIS and IIS together with sea ice/ice-shelf cover variability (Figure 9). The origin, 481
timing and limits of these large glacial variations are still very poorly constrained. However, 482
recent studies have demonstrated that ice-sheets advanced well onto the continental margins 483
all over the bay and as far as the shelf edges during the LGM (Li et al., 2011; Ó Cofaigh et 484
al., 2012, 2013; Hogan et al., 2012; Dowdeswell et al., 2013; Simon et al., 2014: Margold et
485
al., 2015).
486
The cumulative inventory of measured 230Thxs in core PC16 (see Nuttin and Hillaire-Marcel,
487
2015 for details), recalculated in respect to the revised age model, clearly exhibits maximal 488
sediment fluxes corresponding to minimum relative sea level (RSL) during the LGM (Figure 489
8). High Be concentrations (Figures 7 and 8) and ca. 100% sediments originating from 490
Greenland (Simon et al., 2014) also characterized this period. The other periods of high 491
authigenic Be concentrations are also associated with finer sediments originating mainly from 492
Greenland (Figure 8). This facies is related to the resuspension of fine lithogenic sediments 493
(glacial flour) associated to nepheloid layers during period of intense ice margin advances, to 494
outflow of dense winter water from the continental shelves, or to meltwater sediment-laden 495
plumes during period of ice margin retreats. Both scenarios imply ice margins/ice streams 496
extending over the Greenland continental shelf. Together with the inherent higher scavenging 497
efficiency of smaller particles, the increase in particle concentration due to the proximal ice 498
margin likely contributed to the increase of the Be-scavenging rates in central Baffin Bay 499
(Figure 9). We can also assume that a fraction of the Be transported onto ice floes sediments 500
might be transferred into the water column by wave wash-off or turning of floes during these 501
glacial maxima. Two 10Be concentration values of 2.2±0.1 and 2.8±0.1 x 10⁸ at.g-1 measured 502
in clay samples from Arctic ice floes (Eisenhauer et al., 1994) and corresponding to the 503
higher 10Be concentration values from PC16 support this assumption, although samples from 504
Baffin Bay are requested to further discuss this assertion. 505
On the other hand, the low authigenic Be concentrations and ratios within the BBDC layers 506
support a Be dilution in these IRD layers (Figure 2). Such a dilution is possibly associated to 507
(1) increases of terrigenous sediment inputs, (2) changes of sediment composition/grain-size 508
affecting the scavenging efficiency of dissolved beryllium, (3) reduced net Be inputs into the 509
centre of the bay and/or (4) higher exports of Be by extensive sea ice/iceberg drift episodes. 510
The absence of significant increases in sedimentation rates (Figure 8) and/or 230Thxs changes
511
(Nuttin and Hillaire-Marcel, 2015) during these intervals favor the last three hypotheses. 512
However one cannot totally exclude that short episodes of increased inputs of terrigenous 513
sediments could remain uncaptured by the age model resolution. During the BBDC intervals, 514
the limited amount of sediment originating from Greenland supports a distant Greenland ice 515
margin limit while coarse sediments originating from Baffin Island are explained by high 516
calving rates from Laurentide ice streams (Simon et al., 2014). According to this model, the 517
BBDC intervals occur during periods of retreated ice limits over the inner continental shelves 518
(Figure 9). The cause of ice margin instabilities around Baffin Bay is still not well understood 519
but may be related to higher summer insolation and/or to the advection of warm Atlantic 520
Water. Indeed the phasing between magnetic grain size in core PC16 (SIRM/kLF ratios in
521
Figure 8, Simon et al., 2012, 2014) and the insolation variation supports a climatic control on 522
ice margin dynamics and iceberg drifting in the bay. The advection of an intermediate warm 523
water mass in Baffin Bay probably contributed also to destabilize the ice margins (Holland et 524
al., 2008; Jennings et al., 2014) increasing meltwater delivery along the Baffin Bay shelves 525
and slopes. It resulted in increased stratification of the water column and therefore to longer 526
residence times of Be within the deep water masses (von Blanckenburg and O'Nions, 1999). 527
Such an oceanic pattern would reduce the Be adsorption and deposition rates explaining 528
possibly part of the low 10Be concentration within the BBDC intervals. Moreover, and despite 529
complex interactions of eustatic and isostatic parameters over the relative sea level (RSL) 530
around Baffin Bay, we can reasonably assess that the sea level rose over continental shelves 531
during ice margin retreat periods (Long et al., 2008; Simpson et al., 2009; Funder et al., 532
2011). Throughout these periods of marine transgression, oceanic circulation and boundary 533
scavenging (changes in nature and intensity, Lao et al. 1992) may have become significant 534
processes involving large transfer of dissolved Be from the centre of the bay toward the 535
margins (Roy-Barman et al., 2009). The low authigenic 10Be/9Be ratios and 10Be-fluxes 536
during the BBDC intervals within core PC16 might thus be partly explained by high boundary 537
scavenging rates over the large Greenland continental shelf together with important 538
iceberg/sea ice drifts due to very active Laurentide ice streams. For instance, the very low 539
authigenic 10Be/9Be ratios found during the late MIS-3 (ca. 40-28.5 ka BP) is explained by 540
retreated GIS limits and numerous ice streaming episodes from the LIS and IIS possibly 541
related to the Dansgaard-Oeschger events between the large glacial surges of Heinrich-events 542
3 and 4 (Figure 8; Simon et al., 2014). 543
Even though interpretations resulting from the authigenic Be signature in Baffin Bay can be 544
discussed and are likely the results of several processes, we can reasonably proposed that the 545
glacial dynamic of regional ice sheets (i.e., GIS, IIS and LIS) is the main internal driving 546
mechanism in term of 10Be inputs and delivery into the bay. Moreover, ice-sheets topography 547
changes related to such glacial dynamic also imply a reorganization of the atmospheric 548
circulation (e.g., Steffensen et al., 2008) modifying the stratosphere/troposphere exchanges, 549
the wet/dry deposition ratio and the dust inputs into the ocean (Werner et al., 2002). Periods 550
of ice-sheet growth (resp. decay) characterized by higher (resp. lower) wet deposition would 551
then favor higher (resp. lower) 10Be deposition rates within the bay. Although our results are 552
coherent with these views, atmospheric modeling of 10Be deposition considering regional ice-553
sheet topography changes are needed to verify and quantify these assumptions. 554
6. Conclusions
555
The authigenic 10Be cosmogenic nuclide and 9Be stable isotope data were measured along a 556
7.41 m sedimentary core of the sub-arctic basin Baffin Bay in order to reconstruct the 557
geomagnetic dipole moment variations using the 10Be/9Be ratios and 10Be-fluxes (230Thxs
-558
normalized). The results of the two normalizations are coherent and reveal that environmental 559
processes such as glacial dynamics and oceanic variability directly control the variations of 560
the authigenic 10Be and 9Be concentrations in Baffin Bay sediments. The contribution of the 561
atmospheric 10Be cosmogenic nuclide production modulated by the geomagnetic field 562
intensity remains hidden behind this environmental signal. Accordingly, in such conditions 563
10
Be production proxies do not allow to characterize the geomagnetic features such as dipole 564
lows linked to excursions or reversals. Beryllium isotopes are preferentially adsorbed on fine 565
silicate particles associated with sediment plumes originating from lateral ice margin 566
advances. On the contrary they have little affinity with coarse-grained and carbonate-rich 567
sediments (i.e., BBDC) associated with iceberg and sea-ice transport originated from the 568
North-Eastearn Laurentide Ice Sheet and Innuitian Ice Sheet ice streaming events. During 569
these BBDC episodes, glacial margin retreats together with marine transgression over the 570
Greenland continental shelf likely contributed to increase boundary scavenging involving 571
large transfers of dissolved beryllium from the centre of the bay toward the margins. Our 572
findings provide strong evidences that support the use of cosmogenic nuclide 10Be as a 573
stratigraphic marker in the Arctic and sub-Arctic regions. Yet, our results caution a 574
straightforward use of 10Be-concentrations as a proxy of Interglacial/Glacial cycles or major 575
Interstadial periods (as suggested by several authors), and rather propose to relate the 10Be 576
variations to higher-frequency paleoclimatic changes and glacial dynamics. Therefore, 577
studying the cosmogenic 10Be and stable 9Be isotopes in combination with ancillary 578
sedimentological parameters in arctic and sub-arctic marine sediments provide valuable 579
climatic information, but is must be acknowledged that the cost/information ratio is probably 580
too large to systematically use atmospheric 10Be cosmogenic nuclides and 9Be isotopes as 581
paleoclimatic proxies. 582
Acknowledgements
583
We acknowledge Valery Guillou (CEREGE) for his help during chemical sample preparation 584
and 9Be measurements at the AAS. M. Arnold, G. Aumaître and K. Keddadouche are thanked 585
for their valuable assistance during the measurements performed at the ASTER AMS national 586
facility (CEREGE, Aix en Provence). This equipment is supported by the INSU/CNRS, the 587
IRD and the CEAEA and by the ANR through the program “EQUIPEX Investissement 588
d’Avenir”. This study is a contribution of the project MAGORB ANR 09 BLAN 0053 589
(CEREGE, IPGP, LSCE). G. St-Onge and C. Hillaire-Marcel acknowledge financial support 590
from the Natural Science and Engineering Council of Canada (NSERC). CEREGE belongs to 591
Observatoire des Sciences de l’Univers OSU-Institut Pythéas. 592
References
593
Aksu, A.E., 1985. Climatic and oceanographic changes over the past 400,000 years: evidence 594
from deep-sea cores on Baffin Bay and Davis strait. In Quaternary Environments: 595
Eastern Canadian Arctic, Baffin Bay and Western Greenland, Andrews JT (ed.). Allen 596
and Unwin: Boston; 181–209. 597
Aksu, A.E., Piper, D.J.W., 1987. Late Quaternary Sedimentation in Baffin Bay. Canadian 598
Journal of Earth Sciences 24 (9): 1833–46. 599
Aldahan, A.A., Ning, S., Possnert, G., Backman, J., Boström, K., 1997. 10Be records from 600
sediments of the Arctic Ocean covering the past 350 ka. Marine Geology 144 (1-3): 601
147-162. 602
Aldahan, A., Possnert, G., Johnsen, S., Clausen, H.B., Isaksson, E., Karlen, W., Hansson, M., 603
1998. Sixty year 10Be record from Greenland and Antarctica. Proceedings of the 604
Indian Academy of Sciences - Earth and Planetary Sciences 107 (2): 139–147. 605
Alexanderson, H., Backman, J., Cronin, T.M., Funder, S., Ingólfsson, Ó., Jakobsson, M., 606
Landvik, J.Y., Löwemark , L., Mangerud, J., März, C., Möller, P., O’Regan, M., 607
Spielhagen, R.F., 2014. An Arctic perspective on dating Mid-Late Pleistocene 608
environmental history. Quaternary Science Reviews 92: 9-31. 609
Alley, R.B., Andrews, J.T., Brigham-Grette, J., Clarke, G.K.C., Cuffey, K.M., Fitzpatrick, 610
J.J., Funder, S., Marshall, S.J., Miller, G.H., Mitrovica. J.X., 2010. History of the 611
Greenland Ice Sheet: Paleoclimatic insights. Quaternary Science Reviews 29 (15–16): 612
1728-1756. 613
Andrews, J.T., Kirby, M.E., Aksu, A.E., Barber, D.C., Meese. D., 1998. Late Quaternary 614
Detrital Carbonate (DC-) Layers in Baffin Bay Marine Sediments (67°–74° N): 615
Correlation with Heinrich Events in the North Atlantic?. Quaternary Science Reviews 616
17: 1125-1137. 617
Andrews, J.T., Gibb, O.T., Jennings, A.E., Simon, Q., 2014. Variations in the provenance of 618
sediment from ice sheets surrounding Baffin Bay during MIS 2 and 3 and export to the 619
Labrador Shelf Sea: Site HU2008029-0008 Davis Strait. Journal of Quaternary 620
Science 29 (1): 3-13, doi:10.1002/jqs.2643. 621
Arnold, M., Silke, M., Bourlès, D.L., Braucher, R., Benedetti, L., Finkel, R.C., Aumaître, G., 622
Gottdang, A., Klein, M., 2010. The French accelerator mass spectrometry facility 623
ASTER: Improved performance and developments. Nuclear Instruments and Methods 624
in Physics Research B 268: 1954–1959, doi:10.1016/j.nimb.2010.02.107. 625
Auer, M., Wagenbach, D., Wild, E.M., Wallner, A., Priller, A., Miller, H., Schlosser, C., 626
Kutschera, W., 2009. Cosmogenic 26Al in the atmosphere and the prospect of a 627
26
Al/10Be chronometer to date old ice. Earth and Planetary Science Letters 287: 453– 628
462. 629
Bacon, M.P., 1984. Glacial to interglacial changes in carbonate and clay sedimentation in the 630
Atlantic Ocean estimated from 230Th measurements. Chemical Geology 46 (2): 97-631
111. 632
Bacon, M.P., Rutgers van der Loeff, M.M., 1989. Removal of thorium-234 by scavenging in 633
the bottom nepheloid layer of the ocean. Earth and Planetary Science Letters 92 (2): 634
157-164. 635
Barker, S., Knorr, G., Edwards, R.L., Parrenin, F., Putnam, A.E., Skinner, L.C., Wolff, E., 636
Ziegler, M., 2011. 800,000 Years of Abrupt Climate Variability. Science 334 (6054): 637
347-351, doi:10.1126/science.1203580. 638
Baroni, M., Bard, E., Petit, J.R., Magand, O., Bourlès D.L., 2011. Volcanic and solar activity, 639
and atmospheric circulation influences on cosmogenic 10Be fallout at Vostok and 640
Concordia (Antarctica) over the last 60 years. Geochimica et Cosmochimica Acta 75 641
(22): 7132-7145, doi:10.1016/j.gca.2011.09.002. 642
Beer, J, Blinov, A., Bonani, G., Finkel, R.C., Hofmann, H.J., Lehmann, B., Oeschger, H., 643
Sigg, A., Schwander, J., Staffelbach, T., Stauffer, B., Sutter, M., Wötfli, W., 1990. 644
Use of 10Be in Polar Ice to Trace the 11-Year Cycle of Solar Activity. Nature 347 645
(6289): 164–166, doi:10.1038/347164a0. 646
Beer, J., Finkel, R.C., Bonani, G., Gäggeler, H., Glach, U., Jacob, P., Klockow, D., Langway, 647
C.C.J., Neftel, A., Oeschger, H., Schotterer, U., Schwander, J., Siegenthaler, U., Suter, 648
M., Wagenbach, D., Wölfli, W., 1991. Seasonal variations in the concentrations of 649
10
Be, Cl-, NO-3, SO2-4, H2O2, 210Pb, 3H, mineral dust, and 18O in Greenland snow.
650
Atmospheric Environnemnt 25 (19): 899 – 904. 651
Bourlès, D.L., Raisbeck, G.M., Yiou, F., 1989. 10Be and 9Be in Marine sediments and their 652
potential for dating. Geochimica et Cosmochimica Acta 53 (2): 443–452. 653
Brown, E.T., Measures, C.I., Edmond, J.M., Bourlès, D.L., Raisbeck, G.M., Yiou, F., 1992. 654
Continental inputs of beryllium to the oceans. Earth and Planetary Science Letters 114 655
(1): 101-111. 656
Campbell D.C., de Vernal A., 2009. CCGS Hudson Expedition 2008029: Marine geology and 657
paleoceanography of Baffin Bay and adjacent areas, Nain, NL to Halifax, NS, August 658
28- September 23. Geological Survey of Canada, Open File 5989, 1 DVD. 659
Carcaillet, J.T., Thouveny, N., Bourlès, D.L., 2003. Geomagnetic moment instability between 660
0.6 and 1.3 Ma from cosmonuclide evidence. Geophysical Research Letters 30 (15): 661
1792, doi:10.1029/2003GL017550. 662
Carcaillet, J.T., Bourlès, D.L., Thouveny, N., 2004a. Geomagnetic dipole moment and 10Be 663
production rate intercalibration from authigenic 10Be/9Be for the last 1.3 Ma. 664
Geochemistry Geophysics Geosystems 5 (5): Q05006, doi:10.1029/2003GC000641. 665
Carcaillet, J.T., Bourlès, D.L., Thouveny, N., Arnold, M. 2004b. A high resolution authigenic 666
10
Be/9Be record of geomagnetic moment variations over the last 300 ka from 667
sedimentary cores of the Portuguese margin. Earth and Planetary Science Letters 219 668
(3): 397–412, doi:10.1016/S0012821X03007027. 669
Cauquoin, A., 2013. Flux de 10Be en Antarctique durant les 800,000 dernières années et 670
interpretation. PhD Thesis, Université Paris-Sud XI, pp. 206. 671
Cauquoin, A., Raisbeck, G.M., Jouzel, J., Bard, E., ASTER Team, 2014. No evidence for 672
planetary influence on solar activity 330,000 years ago. Astronomy and Astrophysics 673
561: A132, doi:10.1051/0004-6361/201322879. 674
Channell, J.E.T., Xuan, C., Hodell, D.A., 2009. Stacking paleointensity and oxygen isotope 675
data for the last 1.5 Myr (PISO-1500). Earth and Planetary Science Letters 283 (1-4): 676
14-23, doi:10.1016/j.epsl.2009.03.012. 677