HAL Id: hal-01401561
https://hal.archives-ouvertes.fr/hal-01401561
Submitted on 31 Mar 2017HAL is a multi-disciplinary open access archive for the deposit and dissemination of sci-entific research documents, whether they are pub-lished or not. The documents may come from teaching and research institutions in France or abroad, or from public or private research centers.
L’archive ouverte pluridisciplinaire HAL, est destinée au dépôt et à la diffusion de documents scientifiques de niveau recherche, publiés ou non, émanant des établissements d’enseignement et de recherche français ou étrangers, des laboratoires publics ou privés.
Development of tailored high-performance and durable
electrocatalysts for advanced PEM fuel cells
Mikkel Juul Larsen, Ignacio Jiménez Morales, Sara Cavaliere, Jerzy Zajac,
Deborah J. Jones, Luděk Kaluža, Jacques Rozière, Daniela Gulková,
Madeleine Odgaard
To cite this version:
Mikkel Juul Larsen, Ignacio Jiménez Morales, Sara Cavaliere, Jerzy Zajac, Deborah J. Jones, et al.. Development of tailored high-performance and durable electrocatalysts for advanced PEM fuel cells. International Journal of Hydrogen Energy, Elsevier, 2017, 42 (10), pp.7166-7176. �10.1016/j.ijhydene.2016.09.134�. �hal-01401561�
1
Development of tailored high-performance and durable
electrocata-lysts for advanced PEM fuel cells
Mikkel Juul Larsen a,*, Ignacio Jiménez Morales b, Sara Cavaliere b, Jerzy Zajac b, Deborah J. Jones b, Jacques Rozière b, Luděk Kaluža c, Daniela Gulková c, Madeleine Odgaard a
a IRD Fuel Cells A/S, Emil Neckelmanns Vej 15 A&B, DK-5220 Odense SØ, Denmark b ICGM–Aggregates, Interfaces and Materials for Energy, UMR CNRS 5253,
Univer-sité de Montpellier, F-34095 Montpellier cedex 5, France
c Institute of Chemical Process Fundamentals of the ASCR, v.v.i., Rozvojová 135/1,
CZ-16502 Prague 6, Czech Republic
* Corresponding author. Tel.: +45 51152244 E-mail address: mila@ewii.com (M. J. Larsen)
Abstract
A family of novel carbon materials with intermediate surface area and varying mor-phology and surface chemistry were used to prepare Pt/C catalysts by two different preparation procedures; a chemical impregnation method and a microwave-assisted polyol method. The catalysts were thoroughly characterized, and their electrochemical performance and stability were investigated with rotating disc electrode (RDE) cyclic voltammetric (CV) measurements. The intermediate-surface-area carbon supports gave catalysts with much greater support stability than a widely used standard catalyst. The novel catalysts had lower electrochemical surface area than the reference, but their spe-cific electrocatalytic activity towards the oxygen-reduction reaction (ORR) was much higher, and some of them also featured higher mass-specific ORR activity than the ref-erence. The series of catalysts prepared by the microwave-assisted polyol method fea-tured smaller Pt nanoparticles and higher activities than those prepared by impregnation. On the other hand, the impregnated catalysts showed better durability of the Pt particles. The most promising catalysts were selected and elaborated in further optimized prepa-ration procedures to obtain quantities sufficient for their use in proton-exchange mem-brane fuel cells (PEMFCs).
2
Keywords
Fuel-cell catalyst, platinum deposition, electrochemical characterization, oxygen reduc-tion, support durability, synthesis up-scaling
Highlights
Carbons with intermediate surface area are durable Pt-electrocatalyst supports High-Pt-loading catalysts were successfully synthesized by two methods and
up-scaled
Microwave-assisted polyol method gives great Pt dispersion and homogeneity Chemical impregnation method gives very durable catalysts
Down-selected catalysts show excellent electrochemical performance, exceed-ing reference
1. Introduction
Although several promising non-noble-metal catalyst systems are emerging [1,2], plat-inum-group metals (PGM) are still practically indispensable for the efficient catalysis of the electrode reactions in a polymer electrolyte membrane fuel cell (PEMFC). In order to ensure high utilization of the costly and resource-limited PGM it is usually fixed in the form of small nanoparticles on an electronically conductive supporting ma-terial [3]. The support must be resistant toward chemical and electrochemical degrada-tion reacdegrada-tions, and it must also be able to accommodate the active catalyst particles on its surface with good dispersion and high anchoring strength, which are often provided by reactive surface sites and/or pores of apt dimensions.
Carbon blacks (CB) with high surface areas (HSA; e.g., SBET = 800 m2 g-1 or larger) are
often used as support material in conventional PEMFC catalysts due to their good an-choring properties resulting from their many surface imperfections. These latter, how-ever, also make the HSA CBs prone to degradation in the fuel-cell environment, which adversely affects their durability. CBs possessing lower surface area while still being able to efficiently anchor PGM particles in highly dispersed form are therefore ex-tremely interesting.
3 This work deals with the preparation and characterization of platinum-on-carbon (Pt/C)
catalysts by deposition of high amounts of Pt (ca. 60 wt%) on modified medium-sur-face-area (ca. 400 m2 g-1) CB. Two different preparation approaches were followed: One is a chemical impregnation method described in our previous work [4,5,6]. It was found that impregnation of the support by hexachloroplatinic acid (H2PtCl6) is a
suita-ble synthesis method [4] and that a calcination step prior to the reduction of the precur-sors on the support surface leads to greater electrochemical stability [5]. Furthermore, different procedures for removing possibly harmful residual chlorine species were stud-ied, and a dechlorination method involving aqueous sodium hydroxide (NaOH) solu-tion was found to be convenient [6]. The other Pt/C-preparasolu-tion approach is a micro-wave-assisted polyol-mediated deposition method, also using H2PtCl6 as the precursor.
The developed polyol method provides great potential of controlling the Pt-particle sizes and other parameters. Efforts were dedicated to the up-scaling of the syntheses according to the two preparation approaches as this is a critical issue for newly devel-oped catalysts intended for PEMFC application.
2. Materials and methods
2.1. Catalyst preparation
Pt was deposited by two different procedures onto six experimental carbons, from Imerys Graphite & Carbon Switzerland Ltd., having varying morphology and surface chemistry resulting from different production processes and post treatments, to prepare two series of catalysts with a nominal Pt content of 60 wt%. The carbons were labeled CB1 (SBET = 384 m2 g-1), CB2 (SBET = 385 m2 g-1), CB3 (SBET = 452 m2 g-1), CB4 (SBET
= 371 m2 g-1), CB5 (SBET = 379 m2 g-1) [5] and CB6 (SBET = 349 m2 g-1). It was
previ-ously established that all these carbons possess very high electrochemical corrosion resistance [7].
2.1.1. Impregnation procedure (I catalyst series)
The catalyst preparation via the chemical impregnation method is described in our pre-vious publication [5]. In short, 2 g of carbon were added to a solution of H2PtCl6 in a
round distillation flask, and the mixture was heated under reflux at 80 C for 2 h. After cooling, the sample was dried and then calcined in Ar at 190 °C for 1 h and reduced in a H2/Ar mixture at 190 C for 1 h. Dechlorination of 1 g of each catalyst was performed
4 by dispersing the sample in 0.1 M aqueous NaOH solution followed by centrifugation.
The separated solution was analyzed for Cl- content by ion liquid chromatography (ILC). Distilled water was then added, and centrifugation-extraction was continued un-til the test for Cl- presence was negative and the pH of the solution was about 6. The washed catalyst sample was dried in a desiccator overnight and then re-reduced under H2/Ar at 190 C for 1 h. The dechlorinated final catalysts were labelled as I1, I2, I3, I4,
I5 and I6 corresponding to the use of CB1, CB2, CB3, CB4, CB5 and CB6, respectively, as carbon support.
Catalysts of the types I3 and I6 were down-selected for up-scaled manufacturing. For the preparation of a batch of ≥10 g catalyst, slight modifications of the procedure were applied. 6 g of carbon were used as the starting point, and the volume and concentration of H2PtCl6 solution were adjusted as appropriate for the particular carbon used. The
time used for calcination and reduction was increased to 4 h for each of these steps. Also, increased volumes of NaOH solution and water were used in the steps of the dechlorination. The two resulting up-scaled catalysts were labeled I3_10g and I6_10g, respectively.
2.1.2. Polyol procedure (P catalyst series)
For the catalysts prepared according to the microwave-assisted polyol-mediated depo-sition method, the synthesis described below was developed and used for the prepara-tion of small samples (ca. 100 mg) based on each of the six carbons.
240 mg of H2PtCl6•6H2O (Alfa Aesar, 99.9 wt%) were dissolved in 193 ml of ethylene
glycol (EG, Sigma Aldrich, 99.8 wt%) and brought to a pH value of 11.2 by the addition of 1.0 M solution of NaOH (Sigma Aldrich, 98 wt%) in EG. The resulting solution was heated at 120 °C for 6 min under microwave irradiation (MiniFlow 220SS Sairem) at a power of 200 W under N2 flow to obtain Pt nanoparticles (NPs). The mixture was
acid-ified to a pH value of 4 by the addition of 1.0 M solution of sulfuric acid (H2SO4, Carlo
Erba, 96 wt%) in EG, and 30 mg of the carbon was added to achieve ≥60 wt% of Pt in the final Pt/C catalyst. The mixture was ultrasonicated for 15 min and stirred for 2 days to allow the Pt NPs to adsorb on the carbon. It was then filtered, and the catalyst was washed with water, ethanol/water mixture and water and dried at 75–80 C in air. The catalysts were labelled as P1, P2, P3, P4, P5 and P6 corresponding to the use of CB1, CB2, CB3, CB4, CB5 and CB6, respectively, as carbon support.
5 Based on selection, catalysts of the types P1, P2, P3, P4 and P6 were also prepared on
a 1-g scale and P3 and P6 on a 10-g scale too, using an optimized synthesis process involving a continuous flow system. This system is based on a spiral Pyrex pipe (mi-crowave reactor) placed perpendicularly in the mi(mi-crowave flow, through which N2
-sat-urated H2PtCl6/EG solution is circulated from the bottom to the top by means of a
per-istaltic pump. A temperature of 153 °C was used, and the microwave parameters were adjusted to a power of 160 W and a reaction time of 4 min. After this the solution was collected and cooled in a receiver flask to stop any further reaction. Then the remaining synthesis steps (acidification, addition of carbon, mixing, filtration and washing) were carried out as with the small batches. To remove traces of EG, the catalyst was dried in an oven at 160 C under N2 for 1 h. The resulting catalysts were labeled P1_1g, P2_1g,
P3_1g, P4_1g, P6_1g, P3_10g and P6_10g following the previously established anal-ogy.
2.2. Catalyst characterization
The catalysts synthesized in this work were characterized in various ways with respect to composition, morphology and electrochemical properties. The commercial catalyst HiSPEC® 9100 from Johnson Matthey, which consists of 56.81 wt% Pt on high-sur-face-area carbon, was used as reference and subjected to the same characterization. This reference catalyst is denominated Pt/HSAC.
2.2.1 Determination of Pt content
Thermogravimetric analysis (TGA) and X-ray fluorescence (XRF) spectroscopy were used for the determination of the actual content of Pt in the final catalysts.
XRF analysis was performed on almost all the samples according to the following pro-cedure: 30 mg of Pt/C sample were ground with 100 mg of boric acid. The recovered powder was pressed in a 13-mm die to obtain a pellet with scanned surface of ca. 12 mm. The same protocol was used to prepare three standards using 50, 60 and 70 wt% of Pt black (Alfa Aesar) and carbon black to obtain a calibration line. The measurements were performed with a PANalytical Axios Max spectrometer fitted with a Rh (4 kW) tube, and equipped with a LiF200 crystal and Omnian software.
For several samples the Pt content was also determined by TGA. For this, the sample was heated to 1000 C with a ramp rate of 2 (or 5) C min-1 in an air flow of 50 cm3
6 min-1 and the weight change was recorded using a NETZSCH STA 409 PC Luxx or
similar thermobalance.
Furthermore, for the catalysts of the I series the Pt content was also checked by energy-dispersive X-ray (EDX) spectroscopy using a Tescan Indusem scanning electron mi-croscope (SEM) with Quantax 200 and XFlash detector 5010 from Bruker. Spectra were measured at an electron-beam accelerating voltage of 30 keV, and the lines C Kα (0.277 keV), Cl Kα (2.622 keV) and Pt Mα (2.048 keV) and P/B ZAF standardless method were used for the elemental analyses (which confirmed that the nominal content was achieved; i.e., 60 ± 2 wt%).
2.2.2 Determination of Pt-particle diameter
H2 pulse chemisorption was used to estimate the size of the Pt NPs for the catalysts of
the I series and the reference Pt/HSAC. These chemisorption experiments were per-formed using a Micromeritics AutoChem 2950 HP apparatus at -60 C. The specific surface area of the metallic Pt was calculated from the amount of chemisorbed H2 per
gram of sample and the actual Pt content (XRF), assuming that the Pt:H chemisorption stoichiometry is 1:1 and that the number of surface atoms per unit area is 1.25·1019 at. m-2 as indicated elsewhere [8]. From this the theoretical diameter of the Pt particles was calculated and assuming spherical geometry and uniform size.
All catalyst samples were characterized by X-ray diffraction (XRD) measurements. For the I-series catalysts, XRD patterns were recorded on a Bruker D8 Discover diffrac-tometer, equipped with a LynxEye detector, using Cu Kα radiation (40 kV, 40 mA) and a graphite monochromator. The rate of measurements was 0.013 per 1.5 s. The dif-fraction patterns were processed with the program FullProf and the LeBail fitting method [9], and the Pt nanocrystallite size was calculated by the use of the Scherrer equation. For the P-series and reference catalysts, the XRD patterns were recorded at room temperature in Bragg-Brentano configuration using a PANalytical X’pert diffrac-tometer, equipped with a hybrid monochromator, operating with Cu Kα radiation (λ = 1.541 Å), and using a step size of 0.1° 2θ within the 2θ domain from 20 to 80°. The patterns were analyzed by the Fityk program using PseudoVoigt fitting method. The Pt crystallite size was calculated from the Scherrer equation using the Pt(111) diffraction line, measuring the FWHM parameter by a graphical method.
7 Transmission electron microscopy (TEM) analysis was performed on P2 and the
up-scaled samples using a JEOL 1200 EXII microscope, equipped with a CCD SIS Olym-pus Quemesa camera (11 million pixels), operating at 120 kV. The samples were sus-pended in ethanol and sonicated before deposition onto carbon-coated copper grids. The particle size distribution (PSD) and mean diameter (number average) of the Pt NPs were obtained by counting and measuring 200 particles, using ImageJ software, and grouping them into intervals of 0.5 nm.
2.2.3 Chemical analysis for residual content of Cl
The content of residual total chlorine (and bromine) in selected catalysts was deter-mined by instrumental neutron activation analysis (INAA). A 0.05-g sample was irra-diated in an analytical channel of an LVR-15 nuclear reactor for 1 min. After 10 min the sample was analyzed with an HPGe detector for 10 min and compared with the reference material NIST SRM 1547 (Peach Leaves) for quantification of the chlorine content 10. The content of hydrolyzable chloride was determined by ILC after extrac-tion; cf. section 2.1.1 and [5].
2.2.4 BET surface area measurement
The specific surface area (SBET) of selected catalyst samples was determined from N2
physisorption measurements. The samples were evacuated at 120 C for 12 h before the measurements. Adsorption isotherms were then obtained by the use of a Micromeritics ASAP 2010M instrument, and SBET was determined by the Brunauer–Emmett–Teller
(BET) procedure.
2.2.5 Electrochemical characterization
All the small-batch catalyst samples (I1–I6 and P1–P6) were subjected to a comparative test for their electrochemical performance and stability based on rotating disc electrode (RDE) cyclic voltammetric (CV) measurements. The electrodes used were purposely designed to resemble practical catalyst layers in a PEMFC (with respect to loading and binder content) rather than ultrathin film electrodes. The details of the applied proce-dure are given elsewhere [4,5]. In brief, suspensions of catalyst, water, alcohol and ion-omer were made, from which electrodes with a loading of ca. 183 µgPt cm-2 were
8 were carried out in 0.10 M aqueous perchloric acid (HClO4) electrolyte at 34 ± 3 °C.
The electrochemically active surface area (ESA) of the platinum was determined from voltammograms recorded between 0.05 V and 1.10 V vs. the reversible hydrogen elec-trode (RHE) at a scan rate of 20 mV s-1 in N2-saturated electrolyte. The electrocatalytic
activity toward the oxygen-reduction reaction (ORR) was evaluated from voltammo-grams recorded identically, but in O2-saturated electrolyte and at a rotation speed of
1600 rpm. The potential chosen for the evaluation of ORR activity was 0.90 V vs. RHE. The current at this potential was corrected by a Koutecky–Levich procedure to extract the kinetic current (Ik) [4]. Specific activity (ik) and mass-specific activity (ik,mass) were
then obtained by division of Ik by ESA and the mass of Pt in the electrode (mPt),
respec-tively.
For each catalyst one electrode was subjected to one of three different electrochemical accelerated stress test (AST) procedures [5]: a) 3,000 triangular-wave cycles (TWCs) between 0.60 V and 1.20 V vs. RHE at 200 mV s-1 in O2-saturated electrolyte (overall
oxidative ageing); b) 30,000 square-wave cycles (SWCs) between 0.60 V and 0.95 V vs. RHE, with 3 s hold time at each potential limit, in N2-saturated electrolyte (Pt
cata-lyst ageing); and c) 60,000 TWCs between 1.0 V and 1.5 V vs. RHE at 500 mV s-1 in N2-saturated electrolyte (carbon support corrosion) [11]. For procedures b) and c)
in-termediate ESA characterization was performed during the AST. Recording of CVs for ORR-activity determination (including Koutecky–Levich analysis) and ESA determi-nations was repeated after ageing was completed.
The four 10-g samples (I3_10g, I6_10g, P3_10g and P6_10g) were also investigated under the above conditions to check the quality of the scaling up; however, only AST procedure a) was applied.
Furthermore, the 1-g P-series catalysts (P1_1g, P2_1g, P3_1g, P4_1g and P6_1g) and the four 10-g samples (I3_10g, I6_10g, P3_10g and P6_10g) were evaluated by an RDE procedure optimized for the fine determination of ESA and intrinsic catalyst activity. For this, an electrode loading of 21.3 µgPt cm-2 was used. The measurements were
per-formed in 0.10 M aqueous HClO4 electrolyte at 25 °C by the use of a Pine bipotentiostat
model AFCBP1 and with an RHE reference electrode. Thorough initial cleaning of the glass cell (concentrated potassium permanganate (KMnO4) solution overnight, rinsing
in distilled water, rinsing in dilute H2SO4 solution, boiling in water for 2 hours, and
9 boiling in water) was applied regularly. For each electrode a standard activation
con-sisting of 100 cycles between 0.025 V and 1.2 V vs. RHE at 500 mV s-1 in N2-saturated
electrolyte was performed, after which a voltammogram was recorded at 20 mV s-1 for the determination of ESA. For the evaluation of ORR activity, linear sweep voltammo-grams (LSVs) between 0.01 V and 1.2 V vs. RHE were recorded at 20 mV s-1 and with
1600 rpm in O2-saturated electrolyte. The LSVs were background-, IR-, and Koutecky–
Levich corrected to obtain Ik, ik and ik,mass.
3. Results and discussion
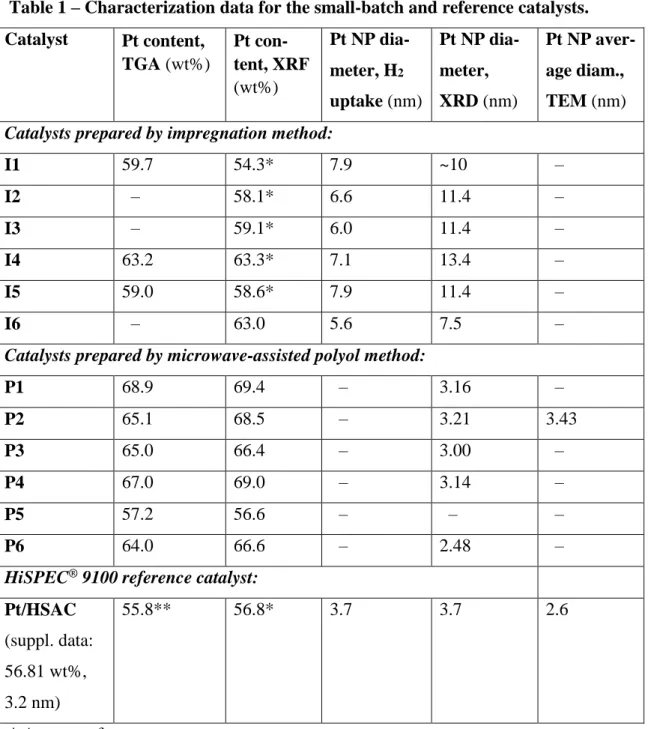
Catalysts with Pt content fairly close to the nominal 60 wt% were successfully produced on all the six carbons by both preparation approaches – i.e., the chemical impregnation (I) method and the microwave-assisted polyol (P) method – as seen from the character-ization data in Table 1. There is generally a very good agreement between the values of Pt content obtained by TGA and XRF.
The XRD structural analyses revealed the presence of highly isomorphic Pt crystallites of cubic structure (XRD patterns for I1–I5 can be found in [5]). As for the Pt-particle diameter, the data in Table 1 indicates that smaller particles are obtained by the P method than by the I method. For the I series the diameters obtained from XRD are somewhat larger than those obtained from pulse chemisorption of H2. A plausible
ex-planation for this is that the H2-chemisorption technique is associated with surface area
and is sensitive to all Pt species, counting in tiny atomic clusters and emphasizing the small particles, which have large surface-to-volume ratios, while XRD reflects only the crystalline Pt and emphasizes the larger crystals having large volumes. The observed difference in the sizes measured by the two techniques thus indicates some scatter in the particle sizes. TEM images (not shown) indeed confirm certain Pt-size inhomoge-neity for the I samples.
For sample P2 the obtained TEM result on the average particle size agrees fairly well with the XRD diameter, as seen in Table 1.
It is seen from Table 1 that for both catalyst series the samples based on the carbon CB6 – I6 and P6, respectively – and the carbon CB3 – I3 and P3, respectively – show the smallest Pt-particle diameters, while the Pt in the other catalysts appears to be slightly less dispersed. The dispersion may to some extent be linked to the surface area of the applied supports, but probably more importantly to their various surface- [7] and
pore-10 structural properties. Rather low Pt dispersion was observed for P5 and I5, which may
be related to the fact that the carbon CB5 has large graphitic domains.
Table 1 – Characterization data for the small-batch and reference catalysts. Catalyst Pt content, TGA (wt%) Pt con-tent, XRF (wt%) Pt NP dia-meter, H2 uptake (nm) Pt NP dia-meter, XRD (nm) Pt NP aver-age diam., TEM (nm)
Catalysts prepared by impregnation method:
I1 59.7 54.3* 7.9 ~10 – I2 – 58.1* 6.6 11.4 – I3 – 59.1* 6.0 11.4 – I4 63.2 63.3* 7.1 13.4 – I5 59.0 58.6* 7.9 11.4 – I6 – 63.0 5.6 7.5 –
Catalysts prepared by microwave-assisted polyol method:
P1 68.9 69.4 – 3.16 – P2 65.1 68.5 – 3.21 3.43 P3 65.0 66.4 – 3.00 – P4 67.0 69.0 – 3.14 – P5 57.2 56.6 – – – P6 64.0 66.6 – 2.48 –
HiSPEC® 9100 reference catalyst:
Pt/HSAC
(suppl. data: 56.81 wt%, 3.2 nm)
55.8** 56.8* 3.7 3.7 2.6
* Average of two measurements. ** Average of three measurements.
11
Table 2 – Selected electrochemical properties of the small-batch and reference cat-alysts.
Cata-lysts ESA*
Change in ESA upon ageing ORR activity at 0.90 V Change in ik upon ageing Oxida-tive Cata-lyst Sup-port ik, mass* ik Oxi-dative Cat-alyst Sup-port m2 gPt-1 % % % A gPt-1 µA cm-2 % % %
Catalysts prepared by impregnation method:
I1** 32 -19 -69 -34 31 100 -7 -41 21 I2 31 -25 -68 -33 32 102 4 -23 40 I3 33 -29 -58 -46 31 94 -10 -1 16 I4 26 -47 -78 -36 22 101 31 -28 48 I5 27 -37 -66 -39 16 59 9 -14 13 I6 34 -35 -74 -36 29 85 10 -5 13
Catalysts prepared by microwave-assisted polyol method:
P1 28 -43 -85 -30 32 113 18 -20 3 P2 26 -33 -72 -27 33 128 -7 -49 1 P3 33 -28 -68 -29 35 104 5 -1 23 P4 31 -38 -87 -30 38 127 18 -43 18 P5 17 -65 -68 -34 18 107 24 -46 0 P6 36 -31 -75 -36 38 106 19 1 14
HiSPEC® 9100 reference catalyst:
Pt/HSAC 76 -35 -66 -53 41 54 22 20 62 * All mass-specific values are based on Pt contents determined by TGA where available, otherwise by XRF (see Table 1).
** The values given for this catalyst are averages for two similarly prepared samples.
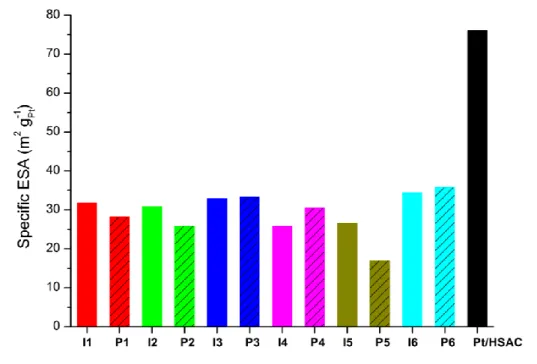
Relevant electrochemical results for the catalyst samples I1–I6 and P1–P6 are shown in Table 2. Specific ESAs are also illustrated in Fig. 1, while specific and mass-specific electrocatalytic activities are drawn up in Figs. 2 and 3, respectively. As seen from Fig. 1 and Table 2 the specific ESAs of the tested novel catalyst samples vary between 17 and 36 m2 gPt-1, and all are thus lower than that of the reference catalyst Pt/HSAC
12 ESAs were expected for the catalysts of the P series. Possible reasons for this deviation
may be poor anchoring (electronic-contact issues) between the Pt and support phases and/or isolation of the small Pt NPs within pores (mass-accessibility issues). That is, a considerable portion of the Pt NPs in the P catalysts might be isolated and hence non-active in the electrochemical processes. However, although the ESAs – for whatever reason – are relatively small, there is a good correlation between ESA (P6 > P3 > P4 > P1 > P2 > P5) and particle size (P6 < P3 < P4 < P1 < P2) within this series. For the I series there is also some extent of correlation (ESA: I6 > I3 > I1 > I2 > I5 > I4; Pt size from H2 uptake: I6 < I3 < I4 < I2 < I5 < I1). For both preparation approaches, the largest
ESAs were obtained for the catalyst based on CB6, followed by those on CB3.
Fig. 1 – Specific electrochemically active surface area (ESA) of the small-batch and reference catalysts.
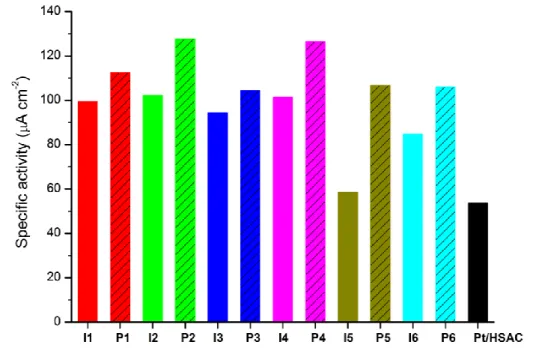
From Fig. 2 and Table 2 it is clear that the specific electrocatalytic ORR activities (i.e., kinetic current per ESA) is significantly higher for all the novel catalysts than for the reference Pt/HSAC catalyst. That is, their ESA is more active towards the ORR than that of the reference. Increase in specific activity is often attributed to two causes: 1) increased sizes of the Pt particles (due to the so-called particle-size effect causing the surface of larger Pt NPs to be more active because of increased prevalence of the most active crystal facet [12]); or 2) favorable Pt–support interactions (catalytic bi-function-ality). For the I series the larger Pt NPs could be the reason for the high specific activity,
13 while for the P series interactions between the carbon (pore walls, etc.) and the small
(active) Pt NPs could account for the high specific activity, which is actually higher for all P catalysts than for the corresponding I catalysts (Fig. 2).
Fig. 2 – Specific oxygen reduction reaction (ORR) activity at 0.90 V vs. RHE of the small-batch and reference catalysts.
Fig. 3 – Mass-specific oxygen reduction reaction (ORR) activity at 0.90 V vs. RHE of the small-batch and reference catalysts.
14 As seen in Fig. 3 and Table 2 the mass-specific activities (i.e., kinetic current per mass
of Pt) for the novel catalysts are in the range of 16–38 A gPt-1, with catalyst P6 showing
the highest value. The mass-specific activity is an important quantity since the amount of Pt is a determining cost parameter for the catalyst.
The reference Pt/HSAC catalyst features 41 A gPt-1. While catalysts with mass-specific
activities fairly close to this reference are obtained with most of the novel carbons, CB5 (i.e., the one with the large graphitic domains) is observed to result in catalysts with significantly lower values. From the low ESA of P5 (Fig. 1), it could be speculated that the preformed Pt colloids do not attach very easily to the CB5 support. For I5, on the other hand, the low specific activity (Fig. 2) might indicate poor catalytic interactions between this support and the Pt phase impregnated onto it. Both these phenomena give rise to low mass-specific activity of the CB5-based catalysts (Fig. 3). Furthermore, the poorness of the observed performances of these catalysts might have been amplified by difficulties in obtaining good electrode structures due to the rather different nature of the CB5 support.
Stability data is also included in Table 2, and curves representing the degradation of the ESA during the ASTs targeting the Pt catalyst NPs and the carbon support material, respectively, are shown in Fig. 4. It is observed that the applied ASTs cause considera-ble degradation of the ESA of the catalysts (Taconsidera-ble 2). However, the ESA degradation incurred in the support-focused AST (which is designed for inducing primarily carbon corrosion) is significantly smaller for all the novel catalysts (29–46% decay) than for Pt/HSAC (53%). This shows the evident benefit of using a CB support with moderate surface area instead of a high-surface-area CB support, which is generally more prone to corrosion and hence loss of attached Pt. Among the samples in the I series I3 shows a little higher ESA degradation than the other five catalysts during the support-focused AST (Fig. 4a, open symbols), while all six catalysts of the P series show rather similar ESA degradation during the support-focused AST (Fig. 4b, open symbols).
In the catalyst-focused AST (designed for inducing primarily Pt dissolution) much more variation in the ESA degradation is found among the samples (solid symbols in Fig. 4). Some samples show around the same ESA degradation as Pt/HSAC in this test, while others show better durability, and yet others lower. In general, the samples of the P series show slightly larger ESA degradation in the catalyst-focused AST than those of the I series. This may be due to the smaller size of the Pt NPs in the former, which is generally associated with lower stability.
15
Fig. 4 – Catalyst (solid symbols) and support (open symbols) accelerated stress test (AST) curves showing electrochemically active surface area (ESA) (normal-ized to initial ESA) as functions of the number of potential cycles for the small-batch catalyst samples of a) the I series and b) the P series. Data for the Pt/HSAC
reference catalyst included.
The overall oxidative AST (yielding dissolution of the Pt NPs as well as corrosion of the carbon support) results in lower ESA degradation for the catalysts I1, I2, I3, P2, P3
16 and P6 than for Pt/HSAC, while I6 show the same degradation, and I4, I5, P1, P4 and
P5 higher (Table 2). In this stability test the samples based on CB4 and CB5 thus per-form relatively poorly.
From an examination of all the ESA-degradation data in Table 2 it can be concluded that P3 is the best catalyst of the P series from a stability point of view. Among the I series, catalyst I3 features by far the best catalyst stability; however, its support stability is the lowest among the novel catalysts, though it is still higher than that of the reference. As for the change in specific ORR activity upon ageing (Table 2), an increase is ob-served for practically all samples in the support-focused AST, where the Pt NPs are expected to merge (or fall off). Since the surface of a larger Pt NP is more active than that of a smaller one (i.e., the particle-size effect [12]), this is an anticipated finding. Accordingly, the specific activity is seen to decrease in most cases in the catalyst-fo-cused AST, which is intended for inducing dissolution and thus shrinkage of the Pt NPs (however, re-deposition of dissolved Pt may occur on other Pt NPs, causing some in-consistency in the trend). During the overall oxidative AST both the merging and dis-solution processes (and many more) can occur, and thus the specific activity can in-crease or dein-crease depending on which process is dominant.
From all the above characterization results it is evident that good catalysts are not ob-tained on the carbon CB5, as I5 and P5 feature low Pt dispersion and low mass-specific activity. Several of the other studied catalysts show promising properties, and in order to have sufficient material for further evaluation, the catalysts P1, P2, P3, P4 and P6 were manufactured on a 1-g scale.
The samples based on CB6 and CB3 appear especially favorable. The four catalysts made from these two carbons have the best Pt dispersions and largest ESAs within the series of novel catalysts, as well as high mass-specific activities (P6 shows the highest of all the novel catalysts) and good stabilities (especially P3). The production of these four catalysts – I3, I6, P3 and P6 – was scaled up to 10-g batches.
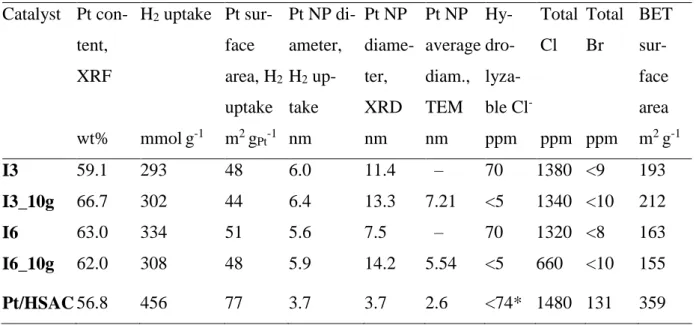
As for the I series, some relevant properties of the selected catalysts are shown in Table 3, which contains data for the up-scaled as well as small-batch (2 g) samples. For each of the catalyst types the Pt content, the Pt NP diameter determined from H2
chemisorp-tion and the BET surface area are very similar for the two batches. The XRD patterns are shown in Fig. 5, where the diffraction peaks for cubic Pt at reflection angles of 39.8, 46.3, 67.5, 81.3 and 85.8 are indicated. Some deviation in the sizes determined from
17
Table 3 – Characterization data for the catalysts prepared by the impregnation (I) method – comparison between small and large batches; Pt/HSAC reference cata-lyst included. Catalyst Pt con-tent, XRF H2 uptake Pt sur-face area, H2 uptake Pt NP di-ameter, H2 up-take Pt NP diame-ter, XRD Pt NP average diam., TEM Hy- dro- lyza-ble Cl- Total Cl Total Br BET sur-face area wt% mmolg-1 m2 gPt-1 nm nm nm ppm ppm ppm m2 g-1 I3 59.1 293 48 6.0 11.4 – 70 1380 <9 193 I3_10g 66.7 302 44 6.4 13.3 7.21 <5 1340 <10 212 I6 63.0 334 51 5.6 7.5 – 70 1320 <8 163 I6_10g 62.0 308 48 5.9 14.2 5.54 <5 660 <10 155 Pt/HSAC 56.8 456 77 3.7 3.7 2.6 <74* 1480 131 359 * Provided by the manufacturer
Fig. 5 – X-ray diffraction (XRD) patterns of the small and large batches of the catalysts prepared by the impregnation (I) method. The obtained average
Pt-crystal sizes are shown in brackets.
40 60 80 100 I6_10g (14.2 nm) I6 (7.5 nm) I3_10g (13.3 nm) Pt Pt Pt Pt I3 (11.4 nm) Int en si ty, a. u. Angle 2 theta, o Pt
18 XRD are observed, especially for the I6/I6_10g pair. This may arise from partial Pt
recrystallization taking place in the large sample (I6_10g) during the reduction step of the preparation procedure (CB6, as opposed to CB3, has a propensity to form coarse agglomerates). Conducting the reduction in a number of smaller portions might lead to better retention of the Pt dispersion.
Whereas the content of hydrolyzable chloride in I3 and I6 are similar to the maximum content in the commercial Pt/HSAC reference catalyst, the content is much lower in the up-scaled samples (Table 3). The total content of chlorine is lower than that in Pt/HSAC for all four samples; for I6_10g even less than half. Also, Pt/HSAC exhibits a more than 10-fold higher content of total bromine than the prepared catalysts. It is believed that only the Pt precursor (H2PtCl6) is responsible for chlorination (or bromination) of
the prepared catalysts because the pristine carbon supports were found to contain only about 10 ppm of total Cl and Br.
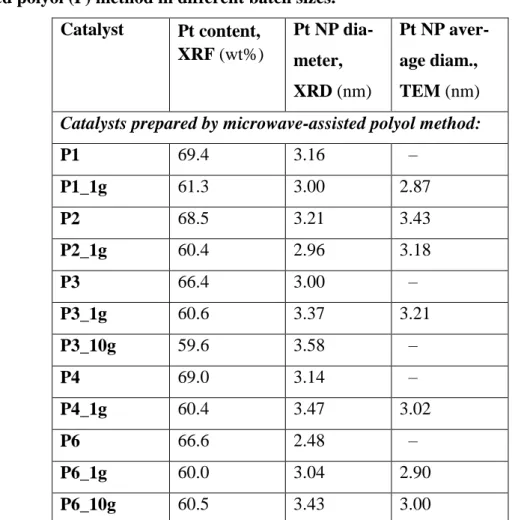
Table 4 – Characterization data for the catalysts prepared by the microwave-as-sisted polyol (P) method in different batch sizes.
Catalyst Pt content, XRF (wt%) Pt NP dia-meter, XRD (nm) Pt NP aver-age diam., TEM (nm)
Catalysts prepared by microwave-assisted polyol method:
P1 69.4 3.16 – P1_1g 61.3 3.00 2.87 P2 68.5 3.21 3.43 P2_1g 60.4 2.96 3.18 P3 66.4 3.00 – P3_1g 60.6 3.37 3.21 P3_10g 59.6 3.58 – P4 69.0 3.14 – P4_1g 60.4 3.47 3.02 P6 66.6 2.48 – P6_1g 60.0 3.04 2.90 P6_10g 60.5 3.43 3.00
19 The selected catalysts of the P series were successfully prepared by the use of the
con-tinuous flow system. By adjusting the microwave parameters (supplied power and du-ration of the reaction) the new batches were finely tailored in order to obtain a slight increase in particle size for better stability. Pt contents and Pt NP diameters are shown in Table 4. All the up-scaled samples have a Pt content very close to 60 wt%, and the intended slight Pt-size increase has been achieved for all of them except P1_1g and P2_2g, using the optimized conditions (reaction conducted at 160 W for 4 min). The content of residual halogens in the P samples is low; for example, INAA revealed con-tents of total Cl and Br of 220 and <8 ppm, respectively, in P1.
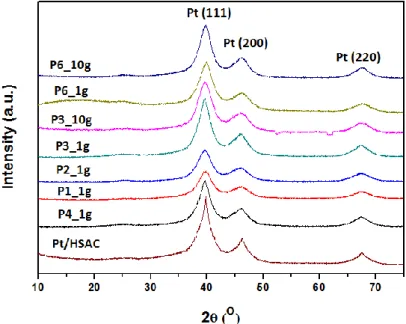
Fig. 6 displays XRD patterns of the seven up-scaled P catalysts as well as the reference Pt/HSAC. The diffractograms feature diffraction peaks corresponding to the (111), (200) and (220) crystal planes of Pt, and the patterns are very similar among the samples. The likenesses of those of P6_1g and P6_10g as well as of P3_1g and P3_10g are great, indicating that structurally very similar catalysts have been obtained. This points to high reproducibility of the developed continuous-flow microwave-assisted polyol-mediated deposition method, which provides a universal tool to allow the quick and efficient transformation from laboratory research platforms to industrial research development.
Fig. 6 – X-ray diffraction (XRD) patterns of up-scaled batches of the catalysts prepared by the microwave-assisted polyol (P) method and of the Pt/HSAC ref-erence catalyst. Corresponding crystal planes are indicated above the diffraction
20
a b c
d e f
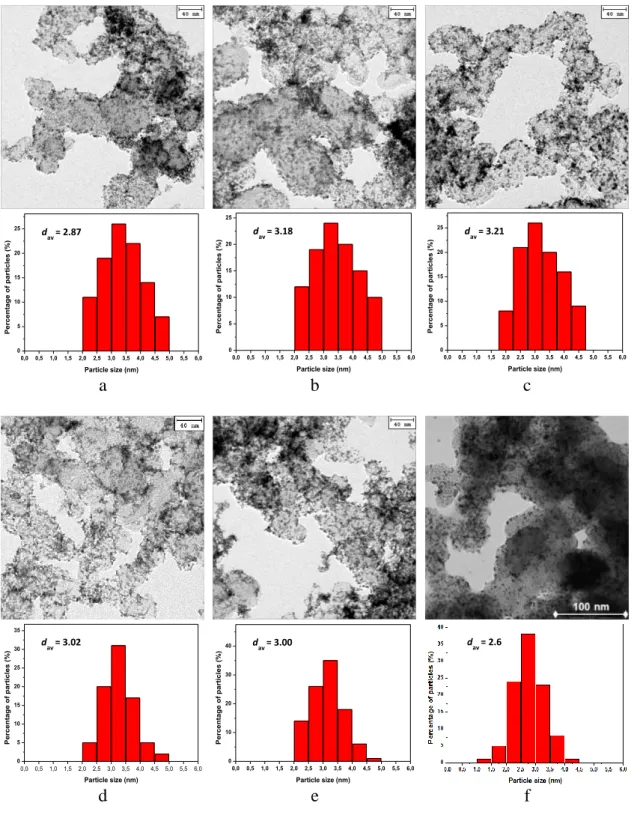
Fig. 7 – Transmission electron microscopy (TEM) images and Pt-particle-size histograms for the catalysts a) P1_1g, b) P2_1g, c) P3_1g, d) P4_1g and e) P6_10g prepared by the microwave-assisted polyol (P) method and f) the Pt/HSAC
refer-ence catalyst.
TEM output for five of the up-scaled P catalysts and Pt/HSAC is shown in figure 7. The micrographs show good dispersion (small NPs) and homogeneous distribution of
0,0 0,5 1,0 1,5 2,0 2,5 3,0 3,5 4,0 4,5 5,0 5,5 6,0 0 5 10 15 20 25 Pe rc e n ta g e o f p a rt ic le s ( %) Particle size (nm) d av = 2.87 0,0 0,5 1,0 1,5 2,0 2,5 3,0 3,5 4,0 4,5 5,0 5,5 6,0 0 5 10 15 20 25 Pe rc e n ta g e o f p a rt ic le s ( %) Particle size (nm) dav = 3.18 0,0 0,5 1,0 1,5 2,0 2,5 3,0 3,5 4,0 4,5 5,0 5,5 6,0 0 5 10 15 20 25 Pe rc e n ta g e o f p a rt ic le s ( %) Particle size (nm) dav = 3.21 0,0 0,5 1,0 1,5 2,0 2,5 3,0 3,5 4,0 4,5 5,0 5,5 6,0 0 5 10 15 20 25 30 35 Pe rc e n ta g e o f p a rt ic le s ( %) Particle size (nm) dav = 3.02 0,0 0,5 1,0 1,5 2,0 2,5 3,0 3,5 4,0 4,5 5,0 5,5 6,0 0 10 20 30 40 Pe rc e n ta g e o f p a rt ic le s ( %) Particle size (nm) dav = 3.00 dav = 2.6
21 the Pt in all samples. The particle-size histograms show relatively narrow Pt PSDs.
Furthermore, there is good agreement between the Pt NP diameters obtained from XRD and TEM (table 4), which is another indication of very homogeneous Pt NP sizes for the P catalysts.
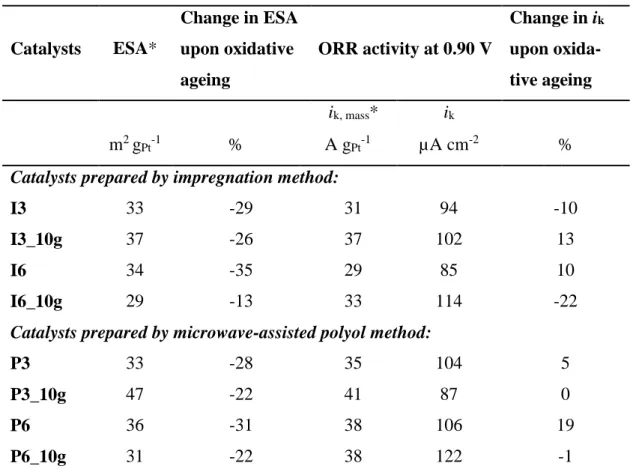
Table 5 – Selected electrochemical properties – comparison between small and large batches. Catalysts ESA* Change in ESA upon oxidative ageing ORR activity at 0.90 V Change in ik upon oxida-tive ageing ik, mass* ik m2 gPt-1 % A gPt-1 µA cm-2 %
Catalysts prepared by impregnation method:
I3 33 -29 31 94 -10
I3_10g 37 -26 37 102 13
I6 34 -35 29 85 10
I6_10g 29 -13 33 114 -22
Catalysts prepared by microwave-assisted polyol method:
P3 33 -28 35 104 5
P3_10g 47 -22 41 87 0
P6 36 -31 38 106 19
P6_10g 31 -22 38 122 -1
* Mass-specific values are based on Pt contents determined by TGA for P3 and P6 and by XRF for all other samples.
Comparative electrochemical results for the catalysts selected for large-scale manu-facture are shown in Table 5. It is seen that the catalyst types I6 and P6 feature slightly lower ESAs in their up-scaled versions I6_10g and P6_10g. These two 10-g samples show increased Pt NPs compared to their small-scale counterparts (cf. Tables 3 and 4), which is in line with decreased ESA. On the other hand, somewhat higher ESAs are obtained for the types I3 and P3 upon up-scaling. Since the samples I3_10g and P3_10g too show increased Pt NPs (Tables 3 and 4), such increase in ESA would not be expected. However, the trend might be linked to the decreased content of residual
22 chlorine species for the I catalysts (cf. Table 3) and to the applied mild heat treatment
(160 ºC for 1 h in N2) for the P catalysts. Chlorine species poison Pt catalysts by
block-ing surface sites, increasblock-ing the corrosion propensity and decreasblock-ing the catalytic ac-tivity [13], and therefore the lower chloride and total chlorine contents in I3_10g may be at least partly responsible for its higher ESA as compared to I3. For catalysts pre-pared by a polyol method some ethylene glycol (EG) molecules can remain adsorbed on the catalyst surfaces, blocking the active sites and therefore affecting the electro-chemical properties of the catalyst [14]. The heat treatment that was performed on the up-scaled P samples may have removed the EG that was possibly adsorbed on the catalyst, which would explain the higher ESA of P3_10g than P3.
The data in table 5 also shows that the ORR activities generally are increased after up-scaling. This may also be explained by the decreased contents of chlorine species and EG, respectively. Another interesting observation is the increase in stability of the ESA occurring for all the catalysts upon up-scaling. This stability increase is most pro-nounced for P6_10g and I6_10g, where some of the effect is anticipated to stems from the increased (and thus more thermodynamically stable) Pt NPs. However, lower con-tent of the above-mentioned impurities is very likely to account for part of the stability gain too.
When the up-scaled I samples (I3_10g and I6_10g) and optimized (Pt-size-tuned, heat-treated) P samples (P1_1g, P2_1g, P3_1g, P4_1g, P6_1g as well as P3_10g and P6_10g) were tested in an RDE procedure focusing on the fine evaluation of the in-trinsic properties of the catalysts rather than on their performance in practical PEMFC electrode layers, the results shown in Table 6 were obtained. The table includes data for the reference Pt/HSAC evaluated by the same procedure. Very high activities and relatively large ESAs are achieved. All the novel catalysts again show lower ESA and much higher specific ORR activity than the reference. The mass-specific activity is similar to that of the reference for P3_1g and P3_10g, while values higher than that of the reference is obtained for P6_1g and P6_10g, with that of P6_1g reaching 214 A gPt-1. This is a very attractive property with respect to application as the electrocatalyst
in a low-PGM-loading cathode of a high-performance PEMFC.
23
Table 6 – Optimized electrochemical results for the up-scaled catalysts and the Pt/HSAC reference catalyst.
Catalysts ESA ORR activity at 0.90 V
ik, mass ik
m2 gPt-1 A gPt-1 µA cm-2
Catalysts prepared by impregnation method:
I3_10g 37 124 335
I6_10g 36 128 356
Catalysts prepared by microwave-assisted polyol method:
P1_1g 46 172 370 P2_1g 44 172 390 P3_1g 43 180 418 P3_10g 44 177 402 P4_1g 37 127 343 P6_1g 49 214 437 P6_10g 48 193 408
HiSPEC® 9100 reference catalyst:
Pt/HSAC 74 187 253
4. Conclusions
Pt/C catalysts with high loading (~60 wt% Pt) were successfully synthesized by chem-ical impregnation and microwave-assisted polyol-mediated deposition, respectively. Higher Pt dispersion and greater homogeneity are obtained with the polyol method, which also allows for fine tailoring of the morphology of the catalysts. The impreg-nated catalysts feature larger and less uniform Pt particles, but they are more durable in an electrochemical environment. All of the novel catalysts have lower electrochem-ical surface area than the commercial high-surface-area-carbon (HSAC) Pt/C reference catalyst, but their specific electrocatalytic activity towards the oxygen-reduction reac-tion (ORR) is significantly higher. Their mass-specific ORR activities are of a similar size as that of the reference; for some of them even higher, with one up-scaled sample (P6_1g) featuring 214 AgPt-1 at 0.90 V vs. RHE as compared to 187 AgPt-1 for the
reference catalyst. Generally, the catalysts prepared by the polyol method have higher activities than those made by the impregnation method.
24 The six carbons used as support for the Pt nanoparticles differ with respect to
morphol-ogy and surface chemistry, but all possess an intermediate surface area of around 400 m2 gPt-1. This latter seems to overcome the durability drawbacks of HSACs, since the
prepared catalysts show much greater support stability in electrochemical testing. The electrochemical performance of the catalysts is greatly influenced by the carbon support, and the comprehensive testing allowed for the selection of carbon types that were suit-able support materials for electrocatalyst preparation. The preparation of catalysts based on these selected carbons were scaled up, developing and optimizing the synthe-ses. The up-scaled impregnation synthesis results in good catalysts with low content of residual chlorine species. The continuous-flow process developed for the microwave-assisted polyol route gives high reproducibility and provides a universal tool for the rapid transformation from a laboratory research platform to industrial research devel-opment. Mild heat treatment of the catalysts from this process removes residual eth-ylene glycol adsorbed on their surfaces and leads to an improvement of their electro-catalytic properties.
The carbons CB3 and CB6 give particularly good catalysts in both preparation routes, and 10-g batches of the catalysts based on these supports were successfully prepared. Further testing with these down-selected PEMFC catalysts – I3_10g, P3_10g, I6_10g and P6_10g – has yielded excellent results on performance and durability, which are crucial for high-quality fuel cells.
Acknowledgements
The research leading to these results has received funding from the European Union’s Seventh Framework Programme for the Fuel Cells and Hydrogen Joint Undertaking under Grant Agreement 303466 IMMEDIATE. L.K. and D.G. also acknowledge the co-financing of the Ministry of Education, Youth and Sports of the Czech Republic (grant no. 7HX13003). Imerys Graphite & Carbon Switzerland Ltd. is greatly thanked for preparing the carbon materials for the catalyst syntheses and for performing TGA.
References
[1] Chen Z, Higgins D, Yu A, Zhang L, Zhang J. A review on non-precious metal elec-trocatalysts for PEM fuel cells. Energy Environ Sci 2011;4:3167–92.
[2] Chen Z, Dodelet J-P, Zhang J, editors. Non-Noble Metal Fuel Cell Catalysts. Wein-heim: Wiley-VCH Verlag GmbH & Co. KGaA; 2014.
25
[3] Ralph TR, Hogarth MP. Catalysis for Low Temperature Fuel Cells. Part I: The Cath-ode Challenges. Platinum Metals Rev 2002;46:3–14.
[4] Kaluža L, Larsen MJ, Zdražil M, Gulková D, Vít Z, Šolcová O, et al. Highly loaded carbon black supported Pt catalysts for fuel cells. Catal Today 2015;256:375–83. [5] Kaluža L, Larsen MJ, Zdražil M, Gulková D, Odgaard M. Fuel Cell Platinum Cat-alysts Supported on Mediate Surface Area Carbon Black Supports. Chem Eng Trans 2015;43:913–8.
[6] Kaluža L, Larsen MJ, Morales IJ, Cavaliere S, Jones DJ, Rozière J, et al. Synthesis of Pt/C Fuel Cell Electrocatalysts: Residual Content of Chloride and Activity in Oxygen Reduction. Electrocatal 2016;7:269–75.
[7] Jiménez Morales I, Cavaliere S, Jones D, Rozière J, Zajac J, Larsen MJ, Mornaghini F, et al. Evaluation of the surface characteristics of carbons using flow calorimetry and their use as electrocatalyst supports for fuel cell application. Poster: 46ème Journées de Calorimétrie et d’Analyse Thermique (JCAT46), Montpellier, France; May 20–22 2015. Manuscript in preparation.
[8] Anderson JR, Pratt KC. Introduction to characterization and testing of catalysts. North Ryde: Academic Press; 1985.
[9] Rodríguez-Carvajal J. Recent developments of the program FullProf. Commission on Powder Diffraction (IUCr) Newsletter 2001;26:12–9.
[10] U.S. National Institute of Standards and Technology. Certificate of Analysis, Standard Reference Material 1547 Peach Leaves. Gaithersburg; 1993.
[11] Ohma A, Shinohara K, Iiyama A, Yoshida T, Daimaru A. Membrane and Catalyst Performance Targets for Auomotive Fuel Cells by FCCJ Membrane, Catalyst, MEA WG. ECS Trans 2011;41:775–84.
[12] Kinoshita K. Electrochemical Oxygen Technology. New York: John Wiley & Sons, Inc.; 1992.
[13] Job N, Chatenet M, Berthon-Fabry S, Hermans S, Maillard F. Efficient Pt/carbon electrocatalysts for proton exchange membrane fuel cells: Avoid chloride-based Pt salts! J Power Sources 2013;240:294–305.
[14] Lebègue E, Baranton S, Coutanceau C. Polyol synthesis of nanosized Pt/C elec-trocatalysts assisted by pulse microwave activation. J Power Sources 2011;196:920–7.