elife.elifesciences.org
A virus responds instantly to the presence
of the vector on the host and forms
transmission morphs
Alexandre Martinière
1†, Aurélie Bak
1†, Jean-Luc Macia
1, Nicole Lautredou
2,
Daniel Gargani
1, Juliette Doumayrou
1,3, Elisa Garzo
4, Aranzazu Moreno
4,
Alberto Fereres
4, Stéphane Blanc
1*, Martin Drucker
1*
1
Virus Insect Plant Laboratory, INRA, Mixed Research Unit 385, Campus International
de Baillarguet, Montpellier, France;
2MRI Imaging Platform, Institute of Human
Genetics, Campus CNRS Arnaud de Villeneuve, Montpellier, France;
3Infectious
Diseases and Vectors: Ecology, Genetics, Evolution and Control Laboratory, CNRS
UMR 5290, Montpellier, France;
4Department of Crop Protection, CSIC, Institute of
Agricultural Sciences, Madrid, Spain
Abstract
Many plant and animal viruses are spread by insect vectors. Cauliflower mosaic virus (CaMV) is aphid-transmitted, with the virus being taken up from specialized transmission bodies (TB) formed within infected plant cells. However, the precise events during TB-mediated virus acquisition by aphids are unknown. Here, we show that TBs react instantly to the presence of the vector by ultra-rapid and reversible redistribution of their key components onto microtubules throughout the cell. Enhancing or inhibiting this TB reaction pharmacologically or by using a mutant virus enhanced or inhibited transmission, respectively, confirming its requirement for efficient virus-acquisition. Our results suggest that CaMV can perceive aphid vectors, either directly or indirectly by sharing the host perception. This novel concept in virology, where viruses respond directly or via the host to the outside world, opens new research horizons, that is, investigating the impact of ‘perceptivebehaviors’ on other steps of the infection cycle. DOI: 10.7554/eLife.00183.001
Introduction
Transmission is a pivotal step in the infection cycle of viruses: it controls the passage from one host to another and is thus essential for dissemination. This step can represent a significant bottleneck for the infection cycle, since it is common for only a small proportion of the countless viral genomes produced to be passed on to a new host in a transmission event; for example, only one to three of the many transmissible genomes initiate a new infection after Potato virus Y transmission (Moury et al., 2007). It is thus expected that viruses have adapted their life cycle and developed sophisti-cated strategies to optimize their transmission. Whereas non-viral pathogens are known to allocate resources for the production of transmission-specific morphs (discussed in Matthews, 2011), sur-prisingly little is known for this mechanism regarding viruses (for review see Blanc et al., 2011). Some viruses are transmitted vertically to host offspring and others are transmitted by contact between hosts (e.g., by wind, water or physical contact), but most viruses rely on vectors for rapid proliferation within host populations (for review see Kuno and Chang, 2005; Blanc et al., 2011; Bak et al., 2012).
The most important vectors are found among the arthropods. Those with a piercing-sucking feed-ing behavior such as mosquitoes (or other blood-feedfeed-ing dipterans) and ticks are especially significant for vertebrate viruses, and likewise aphids, white flies and other sap-feeding bugs are consequential *For correspondence: blanc@
supagro.inra.fr (SB); drucker@ supagro.inra.fr (MD)
†These authors contributed
equally to this work
Competing interests: The authors declare that no competing interest exist
Funding: See page 24 Received: 24 August 2012 Accepted: 17 December 2012 Published: 22 January 2013 Reviewing editor: Thorsten Nürnberger, University of Tübingen, Germany
Copyright Martinière et al. This article is distributed under the terms of the Creative Commons Attribution License, which permits unrestricted use and redistribution provided that the original author and source are credited.
Plant biology
for plant viruses. These vectors are ideal, as their variety of mouth parts can puncture cells, blood ves-sels, and plant sap vessels with great precision, thus enabling efficient uptake and injection of patho-gens without killing the host. Vector transmission can be classified into two main transmission modes. In circulative transmission, the virus is taken up by the vector together with the nutrients (e.g., blood, plant sap, cell contents), where it actively crosses from the intestine into the vector interior. Then it cycles through the hemocoel (the internal body cavity awash in hemolymph) to the salivary glands, where the virus can be secreted together with the saliva into a new host. The second transmission mode is alternatively referred to as mechanical transmission (for human and animal viruses) or non-circulative transmission (for plant viruses). In this transmission mode, the arthropod vector only briefly comes into contact with the virus, in which it transiently attaches to the vector mouth parts and is sub-sequently released; an internalization step does not occur. The viral proteins involved in this seemingly simple process have been well-described in the literature, often down to the molecular level (for review see Ng and Falk, 2006). On the other hand, their precise roles during virus-acquisition by the vector remains largely unexplored (for review see Blanc et al., 2011).
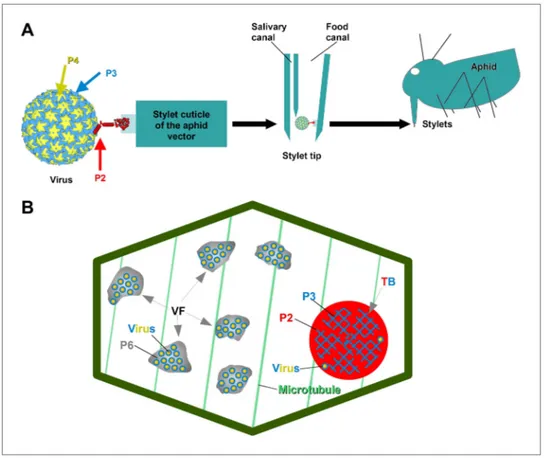
Cauliflower mosaic virus (CaMV), the virus studied here, is a non-circulative virus transmitted by aphids. CaMV binds to a receptor protein located at the tip of the aphid’s needle-like mouth parts, the stylets (Uzest et al., 2007, 2010). The CaMV transmissible complex is composed of the icosahedral viral particle (containing the viral genome enclosed by a shell of capsid protein P4), the virus-associated protein P3, and finally the aphid-transmission factor or helper component, the viral protein P2 (Blanc et al., 1993a; Leh et al., 1999; Plisson et al., 2005). P2 is central to the virus’s transmission, as it links the virus particle to the aphid stylets through the interaction of its C-terminus with virus-associated P3, as well as the linking of its N-terminus with the stylet receptor (Figure 1A). Interestingly, although P2 deletion mutants of CaMV are not transmissible by aphids, they are perfectly infectious when inocu-lated artificially to host plants. This shows that the only role for P2 in the CaMV life cycle is virus–vector interaction. P2 localizes exclusively to a specific cytoplasmic inclusion in infected plant cells, the trans-mission body (TB, Figure 1B). There, P2 co-aggregates with the viral protein P3 to form a matrix in which some virus particles are embedded; the existence of any cellular components within this matrix remains elusive (Espinoza et al., 1991; Drucker et al., 2002). The TB-contained P3 is most likely
eLife digest
Viruses are infectious agents that can replicate only inside a living host cell. When a virus infects an animal or plant, it introduces its own genetic material and tricks the host cells into producing viral proteins that can be used to assemble new viruses. An essential step in the life cycle of any virus is transmission to a new host: understanding this process can be crucial in the fight against viral epidemics.Many viruses use living organisms, or vectors, to move between hosts. In the case of plant viruses such as cauliflower mosaic virus, the vectors are often aphids. When an aphid sucks sap out of a leaf, virus particles already present in the leaf become attached to its mouth, and these viruses can be transferred to the next plant that the insect feeds on. However, in order for cauliflower mosaic virus particles to become attached to the aphid, structures called transmission bodies must form beforehand in the infected plant cells. These structures are known to contain helper proteins that bind the viruses to the mouth of the aphid, but the precise role of the transmission body has remained obscure.
Now Martinière et al. show that the transmission body is in fact a dynamic structure that reacts to the presence of aphids and, in so doing, boosts the efficiency of viral transmission. In particular, they show that the action of an aphid feeding on an infected leaf triggers a rapid and massive influx of a protein called tubulin into the transmission body. The transmission body then bursts open, dispersing helper protein-virus particle complexes throughout the cell, where they become more accessible to aphids. This series of events increases viral transmission rates twofold to threefold.
The results show that a virus can detect insect vectors, likely by using the sensory system of its host, and trigger a response that boosts viral uptake and thus transmission. This is a novel concept in virology. It will be important to discover whether similar mechanisms are used by other viruses, including those that infect animals and humans.
Plant biology
Figure 1. The CaMV transmissible complex and the transmission body. (A) Left: the CaMV transmissible complex
comprises the virus particle, composed of capsid protein P4 (yellow), virus-associated protein P3 (blue) and the helper component P2 (red). P2 binds via its C-terminus to P3 and via its N-terminus to a protein receptor localized in the stylet tips of the aphid vector (middle and right). (B) Infected cells contain many cytoplasmic virus factories (VF), where most virus particles (blue-yellow circles) accumulate in a matrix composed of virus protein P6 (grey), and a single transmission body (TB). The TB (also cytoplasmic) is composed of P2 (red) and P3 (blue) as well as scattered virus particles. P3 in TBs is most likely in a conformation that differs from virus-associated P3. The spatial separation of the components of the transmissible complex (P2 in the TB and most virus particles in VFs) lead us to propose that they unite only at the moment of vector acquisition (Drucker et al., 2002). Cortical microtubules are
desig-nated in green and the cell wall in dark green. Cell organelles are not shown, for clarity. The CaMV model is from
Plisson et al. (2005).
DOI: 10.7554/eLife.00183.003
dissimilar in conformation to the P3 associated with the virus particle, and has been suggested to play a role in TB structure and maintenance, but any details are yet unknown (Drucker et al., 2002;
Hoh et al., 2010). TBs are indispensable to this transmission, as it has previously been shown that aphids are unable to acquire the virus in their absence (i.e., P2 deletion mutants, Woolston et al., 1983), as well as when TBs are malformed. The P2 mutant, P2G94R (described in Khelifa et al., 2007),
assists efficiently in the transmission of purified CaMV particles associated with P3, when aphids are allowed to acquire all three components in vitro from suspensions across Parafilm membranes. However, when the P2G94R mutant is expressed in planta in the context of CaMV infection, it induces
the formation of a misshaped TB (for details see Khelifa et al., 2007), preventing plant-to-plant trans-mission by the aphid vector.
To understand CaMV acquisition, some knowledge of the unique feeding behavior of aphid vectors is required. Aphids feeding on plant leaves insert their stylets into the middle lamella that separates adjacent cells, and subsequently perform a series of brief test punctures into the epidermis and paren-chyma cells; this continues until eventually reaching the phloem where they can feed for long periods, provided the plant is a suitable host (for review see Fereres and Moreno, 2009). Most plant cells survive the initial test punctures, during which only minute amounts of cytoplasm are ingested. CaMV and hundreds of other viral species can be acquired during this feeding behavior, but detailed events
Plant biology occurring within the punctured cell at the precise moment of stylet entry and how they result in virus acquisition are largely unknown. In the example of CaMV, it is known that microtubules are involved in the generation of TBs at the onset of infection (Martinière et al., 2009) and that the micro-tubule depolymerizing drug oryzalin inhibits virus acquisition by aphids (Martinière et al., 2011a), but any details of the mode of action of oryzalin on TBs and how TBs function in virus transmission are still unclear.
Here, we have analyzed the three-way interaction between CaMV, host plant cell, and aphid at the precise moment of the intracellular penetration of the stylets and imminent virus acquisition. Our study reveals an unforeseen capability of CaMV in that it senses—probably by using the host cell machinery— the aphid feeding, and then instantly produces a transmissible form for uptake by the insect.
Results
Different TB forms are detected in infected plant cells
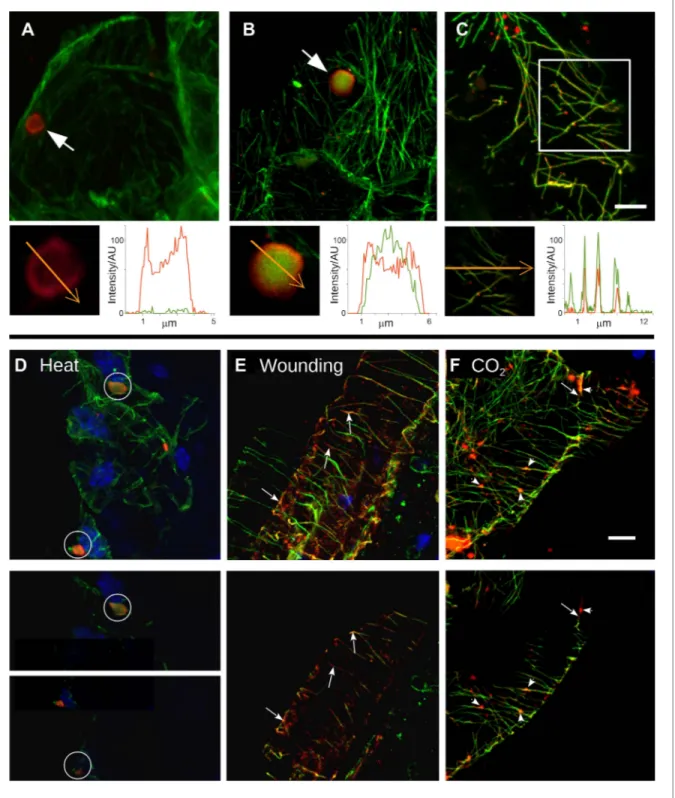
At the beginning of this study was the observation that several different TB phenotypes could be discerned in infected tissues, as viewed by double-labeling experiments using antibodies against the TB marker P2 and the microtubule protein α-tubulin. Thus, typical TBs were detected, and these were rather large (2–5 μm in diameter) and mostly ovoid single cytoplasmic inclusions, having a cortex heav-ily labeled by P2 antibody and a less intensely labeled interior. Most importantly, little if any tubulin was detected in this regular form of the TB (Figure 2A). Interestingly, we also observed a second class of TBs that was phenotypically nearly identical, with the exception that tubulin had greatly accumu-lated in their centers (Figure 2B). Even more surprisingly, we were unable to detect TBs in some cells; at best, small P2 foci without the typical TB structure were visible (hereafter referred to as fragmented TBs). Instead, most P2 decorated the microtubule network in these cells (a P2 distribution pattern hereafter designated as ‘mixed-networks’ and referring to mixed P2-tubulin networks; Figure 2C). A common point among these three TB phenotypes was that their occurrence varied greatly from one experiment to the next. Depending on the tissue preparation, anywhere from almost none to practic-ally all of the TBs contained tubulin; the proportion of cells containing mixed-networks also varied from one experiment to another. To account for these observations, we hypothesized that, among the different TB morphologies observed (hereafter referred to as ‘morphs’), the tubulin-loaded (Tub+|TB)
and mixed-network phenotypes were induced by unidentified stresses during leaf handling, whereas the tubulin-less phenotype (Tub−|TBs) corresponded to unstressed ‘standby’ TBs found under normal
conditions. As the only known role for TBs is in transmission, this further raised the question of whether and how the presence of tubulin within TBs impacts transmission by aphids. To investigate this phe-nomenon, we first aimed to identify artificial stresses that could trigger specific transformation of standby TBs into Tub+|TBs and mixed-networks. Heat-shock, wounding and CO
2 exposure all induced
TB transformation (Figure 2D–F and Figure 2—figure supplement 1). Quantification of the various TB morphs (Figure 3) established that all three treatments induced Tub+|TBs. However,
mixed-networks (co-existing with Tub+|TBs and fragmented TBs) were significantly increased only in wounded
or CO2-exposed leaves, and were rarely observed in heat-shocked or untreated leaves. This indicates
that the different stresses had different and specific effects on TBs.
Having access to an experimental system to specifically induce TB transformation, we next exam-ined what role(s) the different TB morphs might play in CaMV aphid-transmission. Here, we pursued three complementary objectives: i) to characterize the dynamics of TB transformation; ii) to investigate whether aphid feeding activity can trigger this transformation; and iii) to test whether TB transform-ation is required for successful CaMV transmission.
TB dynamics occur on a fast time scale
For TB changes to have any biological relevance in CaMV acquisition by aphid vectors, they must hap-pen fast enough to be compatible with the duration of the intracellular hap-penetration of the aphid stylets during test probes, that is, within ∼10 s. To estimate the speed of TB transformation, we first tested wounding stress by inflicting cuts with a razor blade on infected turnip leaves. The tissue was then fixed immediately (∼10 s) and the TB phenotype analyzed by immunofluorescence. Tub+|TBs and
mixed-networks were detected readily at the wounding sites; by contrast, the cells of control tissue, or tissue wounded after fixation, predominantly harbored standby TBs (Figure 3). We next evaluated the kinetics of tubulin entry into TBs. The surface of a CaMV-infected Arabidopsis leaf expressing genetic-ally tagged GFP-tubulin (GFP-TUA6; Ueda et al., 1999) was touched with a microelectrode, and the
Plant biology
Figure 2. Stress induces different TB morphs. (A–C) The three TB morphs. Immunofluorescence of infected leaves against P2 (red) and α-tubulin (green), with co-labeling appearing as yellow/orange, reveals the different TB forms: (A) a tubulin-less TB (arrow), (B) a Tub+|TB (arrow) and (C) mixed-networks. Images show confocal projections; insets show optical single sections from the TBs indicated by the arrows in (A) and (B), and of the enclosed zone in (C). The orange arrows in the insets mark the line scans and the direction used to create the profiles of P2 (red) and tubulin (green) label intensity, shown to the right of the insets. The line scans show that the TB in (A) contains hardly any tubulin, whereas the TB in (B) is heavily tubulin-labeled, revealing stronger tubulin labeling in the center of the TB than at the cortex. Finally, the distributions of P2 and tubulin labels colocalize in the mixed-networks shown in (C). The intensities are indicated in arbitrary units (AU) since the acquisition conditions were not identical for the different samples. (D–F) Stress induces TB transformation. Immunofluorescence labeling (P2 in red, tubulin in green, DAPI nucleic acid stain in blue) of infected leaves after the indicated stress treatment shows that heat shock (D) induces only Tub+|TBs, whereas wounding stress (E) and exposure to CO
2 (F) additionally induce Figure 2. Continued on next page
Plant biology
TB fragmentation (as revealed by the small red or orange foci in E and F) and mixed-networks. The upper panels of (D–F) show confocal projections, and the lower panels show selected optical single sections. For heat shock (D), two individual sections representing a median section through each of the two encircled TBs are shown. In (E–F), the arrows indicate filamentous P2 labeling that is continuous with microtubule labeling, and the arrowheads point to small P2 aggregates in the vicinity of microtubules. Scale bars: 5 μm. The confocal single sections used to create the projections shown here can be found in Figure 2—source data 1–6. See also Figure 2—figure supplement 1 that shows in vivo stress response of GFP-labeled tubulin in infected
plants.
DOI: 10.7554/eLife.00183.004
The following source data and figure supplements are available for figure 2:
Source data 1. Confocal single sections and acquisition parameters used for Figure 2A.
DOI: 10.7554/eLife.00183.005
Source data 2. Confocal single sections and acquisition parameters used for Figure 2B.
DOI: 10.7554/eLife.00183.006
Source data 3. Confocal single sections and acquisition parameters for Figure 2C.
DOI: 10.7554/eLife.00183.007
Source data 4. Confocal single sections and acquisition parameters for Figure 2D.
DOI: 10.7554/eLife.00183.008
Source data 5. Confocal single sections and acquisition parameters for Figure 2E.
DOI: 10.7554/eLife.00183.009
Source data 6. Confocal single sections and acquisition parameters for Figure 2F.
DOI: 10.7554/eLife.00183.010
Figure supplement 1. Tubulin accumulation in large inclusions after different stresses is specific to TBs.
DOI: 10.7554/eLife.00183.011 Figure 2. Continued
response of TBs in epidermis cells was recorded using confocal time-lapse macroscopy. In the event of a fast entry of tubulin into TB, we should expect to observe a rapid appearance of fluorescent foci, corresponding to Tub+|TBs within these cells. Figure 4A and Movie 1 reveal the detection of
GFP-tubulin in TBs as early as ∼5 s after microelectrode impact; fluorescence in these inclusions reached a maximum and stabilized within ∼10 s. Similar results were obtained in ∼50% of all infected cells tested (Table 1). Contrarily, GFP-tubulin formed a diffuse fluorescent cloud at the impact site in healthy con-trol cells, in line with previous reports (Hardham et al., 2008); fast appearance of tubulin inclusions as in infected cells was never observed. Subsequently, we examined whether the tubulin within TBs is exchanged with that of the cytoplasm, by measuring GFP-tubulin turnover in Tub+|TBs in fluorescence
recovery after photobleaching experiments (FRAP). Photo-bleached GFP-tubulin in TBs was rapidly replaced by fresh cytoplasmic GFP-tubulin (Figure 4B–D), suggesting that this protein circulates con-tinuously between Tub+|TB and the cytoplasm. Taken together, these results indicate that the
appear-ance of both Tub+|TBs and mixed-networks is fast enough to occur during an aphid puncture, and that
there is a dynamic equilibrium between cytosolic and TB-contained tubulin.
TB transformation follows a precise temporal order
The above experiments demonstrating the existence of distinct TB morphs, we next turned our atten-tion to the possible transformaatten-tion of one form into another, and aimed to establish a chronology of TB morphological changes. To facilitate tracking, we used infected protoplasts to screen for various conditions that could induce TB transformation (Table 2), including various physical, chemical and biological stresses. These wide-ranging cell treatments showed that of all the tested stresses, only heat, the chemical sodium azide, compacting of cells by sedimentation and carbon dioxide (CO2)
induced TB transformation. As in leaves, heat treatment of protoplasts only induced Tub+|TBs (data not
shown), whereas CO2 and azide stimulated Tub+|TBs as well as mixed-networks (Figure 5A,B). The
kinetics of TB transformations followed a precise order: first, standby TBs are loaded with tubulin, and then mixed-networks and tubulin-containing TB fragments appear, at the expense of Tub−|TBs. After 5
min (CO2 treatment) or 40 min (azide treatment) most cells displayed mixed-networks (Figure 5C,D).
A most remarkable property of the TBs was their rapid reversion from the mixed-network phenotype back to tubulin-less TBs; this was provoked either after substituting normal air for CO2 (Figure 5E), or
after removing azide from the culture medium (Figure 5F). Moreover, it was possible to induce several consecutive rounds of TB transformation in the mixed-networks, as well as reversion to the same cell suspension, by continually relieving and resubmitting cells to stress (Figure 5E).
Plant biology
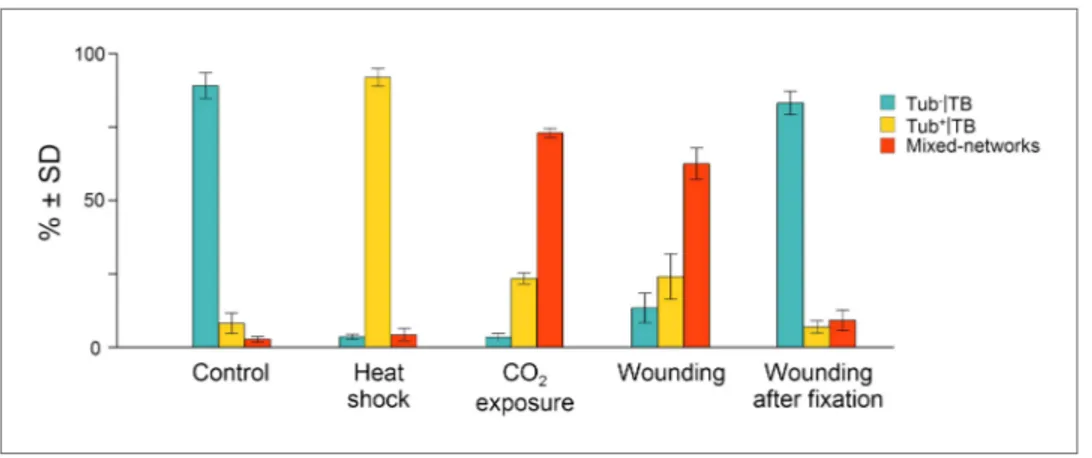
Figure 3. Quantitative analysis of the different TB morphs induced under stress conditions. Leaf samples were
either left untreated (Control), exposed for 2 h at 37°C (Heat shock), exposed for 15 min to CO2 atmosphere (CO2 exposure), cut with a razor blade and then fixed within 10 s (Wounding), or fixed first and then cut with a razor blade (Wounding after fixation). All leaf samples were then processed in parallel for immunostaining against P2 and α-tubulin and scored for the occurrence of the different TB morphs: ‘standby’ Tub−|TBs (turquoise), ‘activated’ Tub+|TBs (yellow) or mixed-networks (red). Results are from three independent experiments and the total number of TBs and networks counted for each condition were control (284), heat shock (293), CO2 exposure (282), wounding stress (313), and 288 in tissues wounded after fixation. See Figure 3—source data 1 for details. SD: standard deviation.
DOI: 10.7554/eLife.00183.012
The following source data are available for figure 3:
Source data 1. Source data for Figure 3.
DOI: 10.7554/eLife.00183.013
Virus particles are also redistributed onto mixed-networks
These time series experiments reveal P2 relocalization, from TBs to microtubules, following the appli-cation of different stresses. Are virus particles, the other major component of the CaMV transmissible complex, also distributed onto the mixed-networks? To answer this question, we carried out immuno-fluorescence of the mixed-networks using a CaMV capsid protein antibody. Figure 6A shows that capsid protein localizes to cytoplasmic inclusions (which are most likely virus factories) in unstressed cells. Under conditions that trigger the formation of the mixed-networks, that is, CO2 (Figure 6B) or
azide treatment (Figure 6C), P4 label colocalized with microtubules. Quantification of this observation (Figure 6D) indicates that almost all cells displayed P4 networks after stress treatment. Nearly the same proportion of cells contained P2 or P4 networks after treatment with CO2 or azide (compare
Figure 6D with Figure 5C,D), which suggested that mixed-networks are also associated with virus particles. We confirmed this by electron- and immunogold microscopy, which showed (in treated cells) that cortical microtubules displaying P2 were indeed also decorated heavily with CaMV particles (Figure 7A–C). Finally, we also examined the ultrastructure of standby and Tub+|TBs. The latter were
induced by heat shock and then the tissues prepared for electron microscopy. Figure 7D–G shows that TBs consist of an electron-lucent matrix in which some virus particles are embedded as previously reported (Espinoza et al., 1991; Drucker et al., 2002). In control TBs, the virus particles seemed either to be distributed evenly throughout the TB matrix (Figure 7D) or to be more concentrated at their cortex (Figure 7F). Heat-shocked TBs displayed similar TB phenotypes (Figure 7E,G) and we could not observe any flagrant differences in TB phenotype between heat-shock-induced Tub+|TBs
and control TBs. This corresponded to the results obtained by fluorescence microscopy (Figure 2D,E) where likewise no obvious differences between the two TB morphs were observed.
Taken together, these results demonstrate that mixed-network formation is always preceded by a massive entry of tubulin into the standby TB, which in itself does not induce a major ultrastructure change. However, under specific stress conditions such as azide or CO2 (but not heat-shock), this
tubu-lin entry can be followed by a total disruption of the TB. This includes an even dispersion of the com-ponents of the CaMV transmissible complex (i.e., P2 and virus particles) onto microtubules throughout the cortical cytoplasm. This redistribution might render the CaMV transmissible complexes more read-ily accessible to aphid vectors.
Plant biology
Aphid behavior triggers TB transformation
The results in Figures 3–5 show that standby TBs can transform reversibly into Tub+|TBs, and then
again into mixed-networks, on a time scale that is fully compatible with aphid intracellular probing (Fereres and Moreno, 2009). However, in all of the above cases, TB transformations were induced by artificial stresses and might not reflect a ‘natural’ induction of TB changes in aphid-infested plants. We therefore aimed to determine whether aphid feeding activity by itself triggers TB transformation. Accordingly, we developed a protocol that simultaneously allows observation of the TB phenotype in infected cells and the discrimination of cells, based on whether or not they had been in direct contact with aphid stylets. For this procedure, aphids were allowed to feed on infected leaves for 15 min, before the leaf was fixed and subsequently screened by confocal microscopy. We then identified, by their auto-fluorescence, the salivary sheaths that remain in the tissue after aphid removal, and which precisely document the path followed by the stylets (Miles, 1968). In addition, we identified by immuno-fluorescence the different TB morphs in plant cells that were either in close contact or farther away
Figure 4. Tubulin influx into TBs occurs on a rapid time scale. (A) Kinetics of tubulin entry into TBs. The epidermis of CaMV-infected Arabidopsis leaves
expressing GFP-tagged α-tubulin (Arabidopsis GFP-TUA6) was touched with a microelectrode tip (yellow), and the effect of the impact recorded by time-lapse confocal macroscopy. GFP-tubulin fluorescence is shown in green, chloroplast fluorescence in orange/red. Negative and positive time points are before and after the microelectrode-epidermis contact, respectively. The red circle denotes the impact zone, and the three arrows point to newly formed GFP-tubulin inclusions. The blue asterisk indicates a reference epidermis cell that did not change its z-position during the time lapse recording and can be used as a landmark for orientation. (B–D) Tubulin cycles between TBs and the cytoplasm. Arabidopsis GFP-TUA6 plants were infected with CaMV and the epidermis was screened for rare spontaneously occurring Tub+|TBs (no deliberate stress treatment was inflicted on the leaf); these were identified by the characteristic shape of the fluorescent tubulin-containing inclusions (see Figure 2—figure supplement 1). The GFP-tubulin in these
Tub+|TBs was photobleached, and the recovery of the GFP fluorescence (due to replacement by fresh cytoplasmic GFP-tubulin) was recorded by time lapse microscopy. (B) Microscopic images of a typical FRAP experiment. The first picture shows a GFP-tubulin-containing Tub+|TB before photobleach-ing. The dashed circle in the second picture indicates the photobleached zone at t = 0 s, and the following pictures show recovery of the GFP-fluorescence at indicated time points after photobleaching. (C–D) The graphs show quantifications of fluorescence recovery: after photobleaching of TBs (C), and after photobleaching of a cytoplasmic zone as a control of free tubulin diffusion (D). The fluorescence levels were normalized (100% = fluorescence before bleaching, 0% = fluorescence just after bleaching). For the two quantification graphs, FRAP trend lines (red) were calculated from seven FRAP experiments on GFP-tubulin-containing TBs, or from 18 FRAP experiments on cytoplasmic zones. The difference in t(1/2) for fluorescence recovery between TBs and the cytoplasm was highly significant (p<0.0001, t-test with n = 18 for TBs and n = 21 for cytoplasm). In contrast, the difference in the mobile fractions, that is, the percentage of exchangeable GFP-tubulin, the so-called mobile fraction, was not significant (p=0.504, t-test with n = 18 for TBs and n = 21 for cytoplasm). These results indicate that tubulin cycles between the cytoplasm and TBs, albeit at much slower rates than free diffusion in the cytoplasm. See Figure 4—source data 1 and 2 for details. Scale bars: 10 μm; MF: mobile fraction; IF: immobile fraction.
DOI: 10.7554/eLife.00183.014
The following source data are available for figure 4:
Source data 1. Source data for Figure 4C.
DOI: 10.7554/eLife.00183.015
Source data 2. Source data for Figure 4D.
Plant biology from these sheaths. Standby TBs were predomi-nantly detected in uninfested tissues, or in infested tissues greater than 15 μm from the stylet track (Figure 8A). In contrast, cells of infested leaves within a 15 μm perimeter of salivary sheaths often displayed typical mixed-networks, fragmented TBs and Tub+|TBs (Figure 8B,C). Mixed-networks
in cells close to the stylet track were also loaded with virus particles, as indicated by positive P4 capsid protein label of microtubules (Figure 8D). Quantification of the aphid-induced effect showed that 30–40% of TBs in cells in contact with a stylet track displayed a modified TB phenotype, whereas 99% of TBs in cells found more than one cell layer away from this track remained in the standby state (Figure 8E). In parallel experiments, aphids were removed after the 15-min feeding period and the leaves were allowed to recover for 2 h before analysis. This intriguingly provoked the aphid-induced mixed-networks to revert back to standby TBs, as demonstrated by the strong decrease in the number of modified TBs close to the stylet tracks (Figure 8E). This resembled the reversion observed in protoplasts, upon relief from either azide or CO2 treatment (Figure 5E,F).
Taken together, these results show that the prob-ing activity of aphid stylets is a robust trigger of TB transformation, and that these aphid-induced TB changes are completely reversible.
TB transformation enables
efficient transmission
In order to be biologically relevant, aphid-induced TB morphs (Tub+|TBs and/or mixed-networks)
should display a significant impact on CaMV trans-mission. We therefore investigated whether TB transformation is required for aphid-transmission of CaMV. Assessing the effect of TB transform-ation on transmission was however not straight-forward, since aphids themselves provoke TB transformation. As a possible means to circum-vent this problem, we observed while quantifying TB morphs (Figure 8E) that only 30–40% of the TBs had transformed after contact with the stylets. We thus reasoned that a pre-treatment of infected cells that would substantially increase the propor-tion of modified TBs prior to aphid feeding should ‘prime’ these cells for virus acquisition and enhance the CaMV transmission rate. To investigate this, we first induced mixed-networks in protoplasts with azide, and then used the cells in aphid transmis-sion experiments. We observed significantly elevated transmistransmis-sion rates compared to transmistransmis-sion from control cells that displayed mainly standby TBs (Figure 9A). The effect was not caused by altered aphid behavior resulting from the presence of azide in the protoplast medium, because the chemical had no effect in transmission experiments in which aphids were allowed to acquire CaMV instead from cells from suspensions containing purified virus, recombinant P2 and P3 (Figure 9B). Azide also had no effect on protoplast viability under the conditions used (Figure 9C). Taken together, these results rule out a possible confounding effect of azide, and clearly indicate that it was the presence of
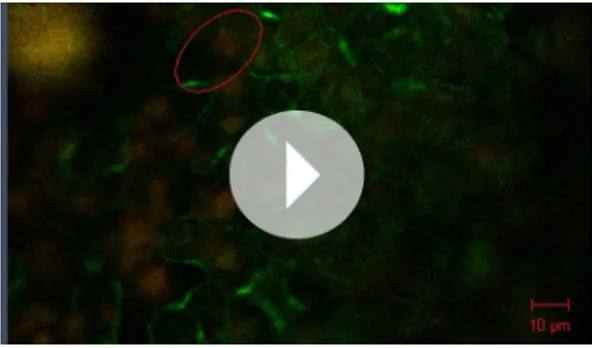
Movie 1. Time lapse confocal macroscopy of a leaf epidermis touched with a microelectrode tip. DOI: 10.7554/eLife.00183.017
Table 1. Speed of influx of GFP-TUA6 into
TBs after touching of epidermis cells with a microelectrode Tubulin reaction In infected cells In healthy cells No reaction 14 (27%) 3 (20%) Appearance of large fluorescent inclusions within 30 s 24 (47%) 0 (0%) Appearance of large fluorescent inclusions after >1 min 1 (2%) 0 (0%) Formation of diffuse tubulin cloud 12 (24%) 12 (80%) Number of experiments 51 15 Epidermal cells of infected or healthy tissues were touched with a microelectrode and the appearance of tubulin fluorescence in inclusions was observed by time-lapse microscopy. A large fluorescent inclusion detected within 30 s or less was considered to be a wound-related tubulin entry into TB. In roughly half the experiments using infected tissue, rapid formation of large fluorescent inclusions was observed; in the other experiments, either no reaction occurred or formation of diffuse fluorescent clouds prevailed. In healthy controls, most cells responded with the appearance of diffuse tubulin clouds, as previously reported (Hardham et al., 2008); rapid appearance of tubulin
inclusions was never observed. DOI: 10.7554/eLife.00183.018
Plant biology
mixed-networks that lead to increased transmission rates. In order to compare this situation with that of intact plant tissues, we examined infected CO2-treated or heat-shocked leaves in transmission
assays. Under heat shock treatment, TB transformation appeared incomplete and arrested at the Tub+|TB stage, as reported above (Figure 2D and Figure 2—figure supplement 1). The heat-shocked
leaves did not perform any better than controls in aphid-transmission tests (Figure 9D), indicating that tubulin entry into TBs alone is not sufficient to enhance transmission. In contrast, CO2 induced
complete TB transformation into mixed-networks (Figure 2E). Moreover, significantly enhanced transmission rates were recorded when CO2-treated leaves were used in aphid transmission
experi-ments (Figure 9E).
We conclude from these results that the sole entry of tubulin into TBs is insufficient to explain increased transmission. Furthermore, we hypothesize that the higher accessibility of CaMV to its aphid vector can be explained by microtubules serving as a scaffold for the rapid redistribution of P2 and virus particles over the entire cell. If this were true, then depolymerization of microtubules by oryzalin should both prevent the formation of mixed-networks, and significantly decrease the transmission
Table 2. Effect of various treatments on TB phenotype in infected protoplasts
Type of treatment Treatment Effect on TB
Hormones Abscisic acid [5 μM] –
Jasmonate [40 μM] –
Auxin [5 μM] –
Salicylic acid [1 mM] –
Mechanical/physical stress Compacting by sedimentation Tub+|TB, mixed-networks
Electroporation –
Heat shock Tub+|TB
Light/dark cycle – Membrane depolarization – Membrane hyperpolarization – Microwaves – Music – Ultrasonication – Vortexing – Elicitors Arabinogalactan [1 mg/ml] – Chitosan [40 μg/ml] – Cryptogein [1 μM] –
Others CO2 Tub+|TB, mixed networks
Sodium azide [0.02%] Tub+|TB, mixed networks
pH –
Infected protoplasts were treated/incubated under the conditions indicated, and the TB phenotype was then analyzed by immunofluorescence against P2 and α-tubulin. Protoplasts were incubated with hormones and elicitors, at the indicated final concentrations, for 60 min. Compaction of protoplasts by sedimentation was achieved by exposing them for 2 h at 9.81 m/s2 on a bench-top. Electroporation conditions were 400 Ω, 0.25 μFD and 0.5 or 1 kV. Heat shock was for 1 h at 37°C. Daylight/dark cycle was for 2 h each condition. Membrane depolarization and hyperpolarization were induced with 100 and 0.1 mM KCl in protoplast buffer, respectively. Microwave exposure was 3 s at 750 W. For the music treatment (inspired by Braam and Davis, 1990), Vanessa Paradis’s ‘Joe le taxi’
song was played at moderate volume (∼60 db) for 3.5 min with protoplasts ‘listening’ from opened Eppendorf tubes. Ultrasonication consisted of a 2 s pulse at 80% power using a Bioblock Vibracell 72434 apparatus; vortexing was for 5 s at maximal power using a Vortex Genie 2 machine. Conditions for CO2 and sodium azide treatments are described in 'Materials and methods'. For pH treatment, cells were incubated for 5 min with 10 mM K2HPO4/KH2PO4 titrated to pH 3.0, 5.6, 6.9 or 8.2. Lower and higher pH values proved lethal to the cells and were not considered for analysis. In all cases, the survival of cells was verified as described by Widholm (1972) and only treatments sustaining
viability of the cells were used for analysis. DOI: 10.7554/eLife.00183.019
Plant biology
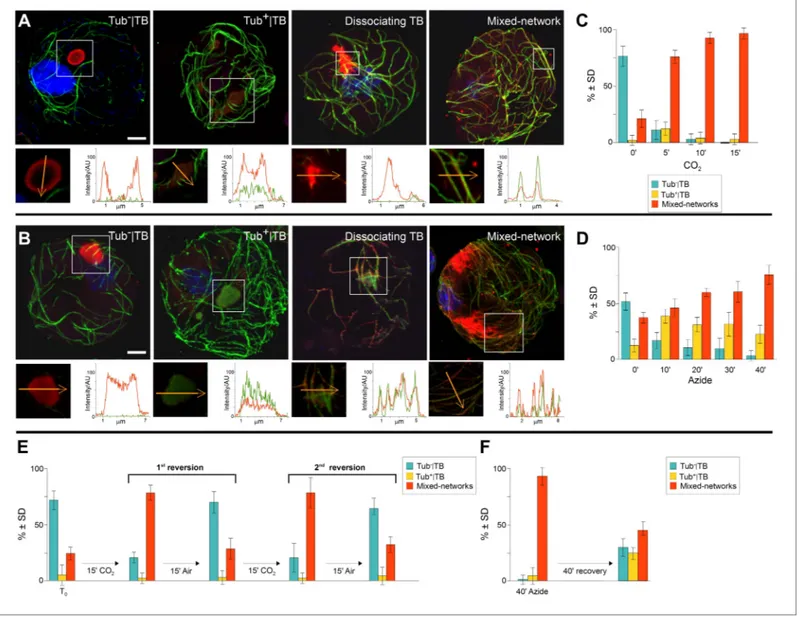
Figure 5. TB transformations have a precise temporal order and are reversible. (A–B) Kinetics of TB transformation. Protoplasts were treated with
(A) CO2 or (B) azide, and then processed for immunofluorescence against P2 (red) and α-tubulin (green); nuclei were counterstained with DAPI (blue). In both (A) and (B), untreated protoplasts display tubulin-less TBs, and the three subsequent images show representative treated protoplasts, respectively displaying a Tub+|TB, a disintegrating TB and mixed-networks. All images are confocal projections, with the exception of the dissociating TB after azide treatment, which is a single section; each inset shows a single optical section from the enclosed zone. The orange arrows show the line scans and the scanning direction used to create the profiles of P2 (red) and α-tubulin (green) labeling intensity (in arbitrary units, AU), which are displayed in the graphs to the right of the single sections. They reveal as in Figure 2A–C, that unstressed TBs display little to no tubulin label, whereas stressed TBs contain large
amounts of tubulin in their centers. P2 colocalizes with microtubules in mixed-networks. The confocal stacks used to generate the image projections can be found in Figure 5—source data 1 and 2. (C–D) Quantification of TB kinetics. The histograms show the kinetics of CO2- (C) and azide-triggered (D) TB transformation in protoplasts. Results from one out of three independent experiments are displayed. 1235 TBs (Tub−|TBs, Tub+|TBs, and mixed networks) were evaluated for the CO2 experiments, and 1662 TBs were evaluated for the azide experiments. See Figure 5—source data 3 and 4 for details. (E–F) Reversion of mixed-networks through two CO2/air cycles (E), and after azide treatment (F). Infected protoplasts were treated with CO2 or azide for the duration indicated. CO2 was subsequently removed by ventilation of the suspension with air; azide was removed by resuspending the protoplasts in fresh medium. Shown are data from one of three independent experiments. For the three repetitions, a total of 1339 TB morphs were analyzed for CO2 reversion, and 2262 TB morphs were analyzed for the azide reversion experiments. See Figure 5—source data 5 and 6 for details. SD: standard deviation.
DOI: 10.7554/eLife.00183.020
The following source data are available for figure 5:
Source data 1. Confocal single sections and acquisition parameters for Figure 5A
DOI: 10.7554/eLife.00183.021
Source data 2. Confocal single sections and acquisition parameters for Figure 5B
DOI: 10.7554/eLife.00183.022 Figure 5. Continued on next page
Plant biology
Source data 3. Source data for Figure 5C
DOI: 10.7554/eLife.00183.023
Source data 4. Source data for Figure 5D
DOI: 10.7554/eLife.00183.024
Source data 5. Source data for Figure 5E
DOI: 10.7554/eLife.00183.025
Source data 6. Source data for Figure 5F
DOI: 10.7554/eLife.00183.026 Figure 5. Continued
rate. We have previously shown that oryzalin diminishes transmission from infected protoplasts (Martinière et al., 2011a). Consistent with these results, we show here that oryzalin induces Tub+|TBs
within 15 min, but prevents mixed-network formation (Figure 9F,G).
To further confirm the role of TB changes in aphid-transmission of CaMV, we pursued an independ-ent approach and examined a CaMV mutant impaired in transmission. This mutant, CaMV P2-TC, harbors a 7-amino acid insertion, including a tetracysteine tag (Griffin et al., 1998) at position 100 of the P2 protein. The mutant virus was fully infectious as compared to wild type virus; furthermore, the P2-TC protein as well as viral proteins P3, P4 and P6 accumulated to similar levels in infected plants (Figure 10A). However, in comparison to wild type TBs, this mutant induced TBs (TB-TCs) that seemed to be smaller, with a more regular rounded shape, and a more pronounced P2-rich cortex, as revealed by immunofluorescence (Figure 10B). Heat shock induced an influx of tubulin into TB-TCs, and photo-bleached GFP-tubulin contained in TB-TC was observed to be exchanged with cytoplasmic tubulin in FRAP experiments (Figure 10C), although the kinetics differed from tubulin replacement in wild type TBs (compare Figure 10C with Figure 4B). Thus the TB of the P2-TC mutant bears some similarity to wild type TB. Nevertheless, CaMV P2-TC was completely non-transmissible in plant-to-plant trans-mission experiments (Figure 10D). This could be due to a defect of TB-TC in undergoing correct transformation upon aphid puncture; an alternative is that this is due to a lack of interaction between the mutant P2-TC protein and either virus particles or aphid stylets. To distinguish between these pos-sibilities, we first tested whether P2-TC protein can mediate the binding of virus particles to the aphid stylets. One way to test this is to allow aphids to feed on suspensions containing recombinant P2-TC, P3 and purified virus particles through membranes, before they are transferred to test plants for inocu-lation. Binding of transmissible complexes acquired by the aphids from the feeding solution is then scored by counting the number of successful transmission events, that is, the number of infected test plants. Although the transmission rates were significantly lower than that obtained with wild type P2, the P2-TC mutant protein was indeed active in such assays, retaining around 50% of the wild P2 activ-ity (Figure 10E). We thus reasoned that defects in P2-TC binding to virus particles or stylets can only partially explain the complete failure in plant-to-plant transmission of the P2-TC mutant, and that a failure in TB-TC transformation may also be involved. To investigate this possibility, we allowed aphids to infest CaMV-P2TC-infected leaves for 15 min. The leaves were then processed for immunofluores-cence against P2 and α-tubulin, and scored for the TB phenotype in cells found close to and farther away from the salivary sheaths. Figure 10F,G demonstrates that only standby TBs were detected, and not Tub+|TBs or mixed-networks. This result is further evidence for a strong positive correlation
between the appearance of mixed-networks (i.e., TB transformation) and successful aphid transmis-sion, and presents direct biological evidence in support of our transmission hypothesis.
Discussion
Combined, our results establish that the TB is a dynamic structure, which in the presence of an aphid vector can react immediately to promote CaMV transmission (Figure 11). Transmission is controlled by the different TB morphs. The tubulin-less TB found in normal ‘unstressed’ cells has been well-described over the past several decades (Shalla et al., 1980; Rodriguez et al., 1987; Espinoza et al., 1991;
Blanc et al., 1993b; Drucker et al., 2002), and here functions as a standby TB that ‘anticipates’ the vector arrival. Then, when aphids land on the plant and insert their stylets into tissues, CaMV uses the plant’s response during stylet entry to its advantage at a very early stage of the plant–aphid interaction. This results in TBs that undergo dramatic, short-lived changes leading to the temporary redistribution
Plant biology
Figure 6. TB transformation mobilizes virus particles onto microtubules. (A–C) Viral capsid protein P4 colocalizes with mixed-networks. Protoplasts
were either left unstressed (A), incubated with CO2 for 15 min (B) or treated with azide for 40 min (C), and then fixed and labeled to detect capsid protein P4 (red) and α-tubulin (αTUA, green). The split channel representations and merges as well as the P4 and α-tubulin profiles obtained by scanning the lines indicated by the orange arrows show that the two stress treatments induced relocalization of capsid protein P4 from inclusions onto microtubules. As in Figure 2A–C, the intensity of the P4 and α-tubulin label is indicated in arbitrary units (AU) because different acquisition settings were used to record the images. (A) is a confocal projection, (B–C) are confocal single sections. Refer to Figure 6—source data 1–3 for image details. (D) Quantification of the effect of azide and CO2 on the localization of P4. Cells were treated as indicated, processed for immunofluorescence against P4 and α-tubulin and scored for the presence of P4 in inclusions only, or in inclusions and on microtubules. The histogram shows that almost all cells display P4 networks that colocalize with microtubules after stress treatment. Data are from one of three independent experiments, in which a total of 524 cells were analyzed. Refer to Figure 6—source data 4 for details. Scale bars: 5 μm. SD: standard deviation.
DOI: 10.7554/eLife.00183.027
The following source data are available for figure 6:
Source data 1. Confocal projection and acquisition parameters for Figure 6A.
DOI: 10.7554/eLife.00183.028
Source data 2. Confocal single section and acquisition parameters for Figure 6B.
DOI: 10.7554/eLife.00183.029
Source data 3. Confocal single section and acquisition parameters for Figure 6C.
DOI: 10.7554/eLife.00183.030
Source data 4. Source data for Figure 6D.
DOI: 10.7554/eLife.00183.031
of P2 and virus onto microtubules. These hitherto overlooked TB alterations result in a reversible TB ‘activation’ that optimizes virus acquisition. The activation or increased transmission efficiency is probably due to the mixed-networks distributing P2 and virus homogeneously on microtubules throughout the cell periphery. This could in turn facilitate virus acquisition: in this new configuration, P2 and the virus are more accessible to the vector during its random punctures, as compared to the remote localization of P2 in isolated TBs. This hypothesis is supported by the observation that inhib-ition of mixed-network formation, either in the CaMV-P2TC mutant or pharmacologically by oryzalin, resulted in decreased transmission. The converse situation also applies, as artificial induction of mixed-networks by CO2 and azide were correlated strongly with increased transmission rates. These results
additionally indicate that the TB reaction is required for transmission.
One enduring question that deserves further attention is precisely where the virus particles come from that are recruited onto the microtubules. Whereas the origin of microtubule-associated P2 is clearly the TB (since the TB is the only source of P2), the origin of the virus particles aligning on the microtubules is less clear. They could derive either from the TB, which contains some virus par-ticles, or from the many virus factories dispersed throughout the cytoplasm (Espinoza et al., 1991;
Drucker et al., 2002). We were also intrigued to observe that only certain stresses—notably aphid feeding activity, wounding, azide and CO2—could trigger TB transformation. This reveals a certain
level of specificity in TB activation, although it is more broad than the classical pattern recognition receptor-mediated defense responses of plants against pathogens (including insects) that are often species or even isolate-specific (Hogenhout and Bos, 2011). This broad specificity is not surprising,
Plant biology
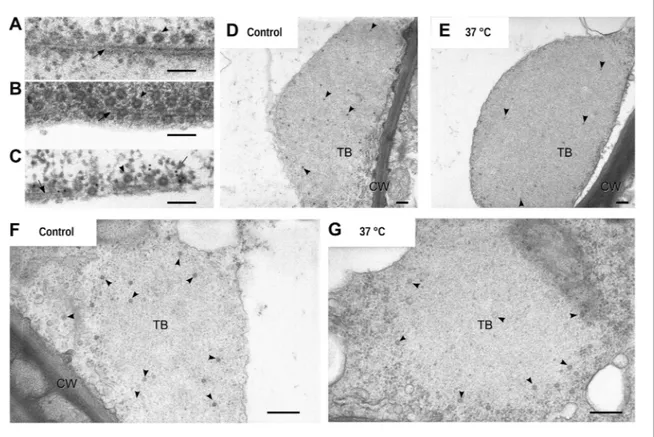
Figure 7. Electron microscopy of the different TB morphs. (A–C) Mixed-networks display virus particles on microtubules. The images show typical
spherical CaMV virus particles (arrowheads) that decorate microtubules (black arrows) in cortical regions of (A) a CO2-treated or (B) an azide-treated protoplast. (C) Positive immunogold labeling against P2 (the gray arrow points to an exemplary nanogold particle) identifies the virus-decorated microtubules as mixed-networks, in which all components of the CaMV transmissible complex are present. (D–G) TBs in unstressed (D, F) and heat-shocked (E, G) tissue display the same TB phenotype. Infected Arabidopsis TUA6-GFP leaves were exposed for 1 h at 37°C. The presence of tubulin in TBs was then verified by fluorescence microscopy and the same leaf samples were processed for transmission electron microscopy. The arrowheads point to virus particles. CW: cell wall. For scale bars, (A–C): 100 nm; (E–G): 250 nm.
DOI: 10.7554/eLife.00183.032
since CaMV is transmitted by at least 30 different aphid species. Importantly, this suggests that the plant responses against aphids (that are probably exploited by CaMV for the TB reaction) are triggered by an elicitor common to all aphids. Whether this elicitor triggers an innate plant immunity pathway or a separate perception/reaction cascade remains an open question.
The significance of this remarkable phenomenon described here extends beyond CaMV transmis-sion to broader fields of research. First, this opens up a fascinating new direction within virology, to explore whether other viruses form transmission morphs in response to vector-sensing by the host. Second, the transient accumulation of tubulin in TBs, followed by redistribution of TB contents on microtubules uncovers unforeseen capacities of tubulin/microtubule dynamics and raises further ques-tions pertinent to cell biology. For example: How can apparently soluble tubulin concentrate in the TB and what is its function there? Does this serve as the source for the mixed-networks? Most strik-ingly, our work reveals that a virus can detect external stresses (probably by using its host’s perception system) and respond in a way that is somewhat independent of the host’s response. We propose nam-ing this phenomenon: ‘virus perceptive behavior’. This concept is nicely illustrated by three compellnam-ing observations made in this study. First, TB transformation occurs while the host plant is still in the pro-cess of transducing the triggering signal. This shows that the virus appropriates the host’s percep-tion machinery itself, rather than relying upon downstream reacpercep-tions that take tens of minutes (or hours) to manifest and establish local and systemic defense responses (Kus´nierczyk et al., 2008;
de Vos and Jander, 2010). Second, after transformation of the TB into mixed-networks, the fate of CaMV appears disconnected from the final host response. Indeed, within the time frame required for the host plant to respond to an aphid attack, mixed-networks have already served as a robust virus
Plant biology
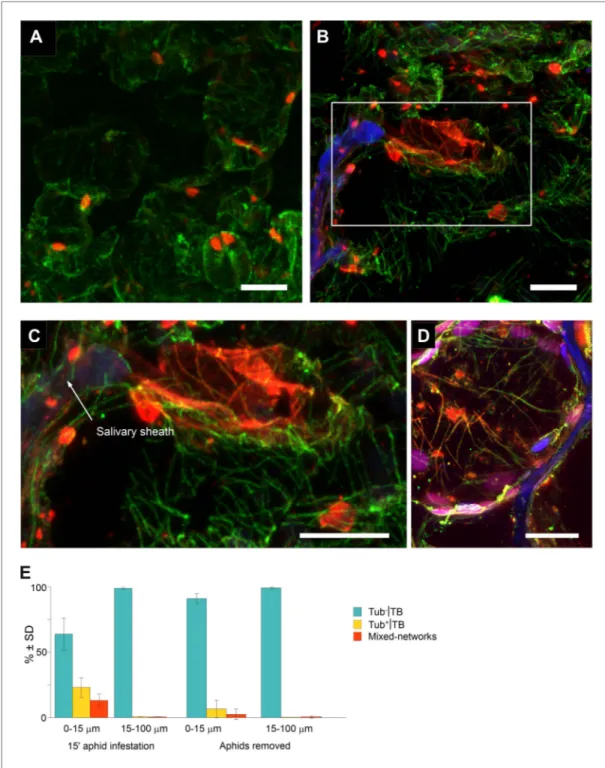
Figure 8. Mixed-networks appear in tissue zones pierced by aphid stylets. Unstressed CaMV-infected leaves
(A) or leaves infested by aphids for 15 min (B–D) were analyzed by immunofluorescence microscopy. (A) Cells in leaf regions that were not foraged by aphids display standby Tub−|TBs, as shown by confocal projections of tissue sections labeled against P2 (red) and α-tubulin (green). The optical single sections used for this projection are deposited in Figure 8—source data 1. (B) In contrast, a cell close to a salivary sheath (blue autofluorescence,
digitally enhanced) displays mixed-networks, in aphid-infested tissue. An enlargement of the zone enclosed in (B) is shown in (C). (B–C) show confocal projections, please refer to Figure 8—source data 2 for the corres ponding image stack. (D) Immunofluorescence microscopy against capsid protein P4 (red) and α-tubulin (green) shows that virus particles also localize to mixed-networks in cells close to salivary sheaths (blue, digitally enhanced).
Chloroplast autofluorescence appears in magenta. The confocal single sections used to produce this projection can be found in Figure 8—source data 3. (E) Aphids trigger TB transformation, and this transformation is
reversible. Aphids were placed for 15 min on infected leaves. Following this, the leaves were fixed immediately Figure 8. Continued on next page
Plant biology
source for aphids, and have long since reverted back to standby TBs. Third, the response mechanisms themselves are also entirely different from the reported plant physiological responses to aphid attack. These include callose deposition near the salivary sheaths and within sieve tubes (Villada et al., 2009), changes in gene expression patterns (Kus´nierczyk et al., 2008), altered emission of volatile com-pounds (de Vos and Jander, 2010); and the initiation of salicylic, abscisic, and jasmonic acid systemic defense pathways (Giovanini et al., 2007; Kus´nierczyk et al., 2008; de Vos and Jander, 2009). In contrast, the TB response seems to be restricted to a CaMV-specific and immediate diversion of tubu-lin/microtubules (plus putative unknown associated partners) for virus transmission, in a manner unlike anything described before.
Whether such viral perceptive behaviors play a role in the vector-transmission of other viruses is entirely unknown, and will thus be a question of great priority in the field of research on virus transmis-sion. Viruses tightly regulate all the different steps of their life cycle, from intracellular replication and short- and long-distance intra-host movement, to inter-host spread. In this sense, the ability to specifi-cally trigger the ‘transmission-mode’ at the right time and the right place seems like a valuable adapta-tion for avoiding the deleterious interference between these various funcadapta-tions.
On a more broad scope, our results highlight many unexpected research horizons to explore in the biology of these fascinating pathogens. The possible instances in which viruses could react directly to cues from the host environment, the diversity of sensorial pathways that could be exploited in both animal and plant hosts, and the number of key life cycle steps that could be optimized accordingly all inspire questions that will shape future research directions in this field. Finally, aside from being an academic challenge, this phenomenon also represents a potential Achilles heel in viral transmission that could lead to novel virus control strategies.
Materials and methods
Plants, viruses and inoculation
Turnip plants (Brassica rapa cv. ‘Just Right’) and transgenic Arabidopsis thaliana Col0 plants with a gl1 marker expressing GFP-TUA6 under control of the 35S promoter (Ueda et al., 1999) were alterna-tively used as CaMV hosts, depending on the experiment. Two-week-old plants were mechanically inoculated with wild-type CaMV strain Cabb B-JI (Delseny and Hull, 1983) or Cabb B-JI ΔP2 as described in Martinière et al. (2009), and processed as indicated at 14 days post infection (dpi). In order to obtain the mutant virus Cabb B-JI P2-TC (referred to as P2-TC in the text), the oligonucleo-tides 5′-TCGAGTTGCTGTCCAGGATGTTGC-3′ and 5′-TCGAGCAACATCCTGGACAGCAAC-3′ were and processed for immunofluorescence (15-min aphid infestation), or the aphids were removed and the leaves were processed 2 h later (Aphids removed). The TB phenotype (standby Tub−|TBs, Tub+|TBs and mixed-networks) was scored next to salivary sheaths (0–15 μm) and in surrounding tissue (15–100 μm). Tub+|TBs and mixed-networks were predominantly observed close to salivary sheaths in freshly aphid-infested tissue. The effect was highly significant (p<0.0001, GLM, df = 1, χ2 = 194.59, n = 3). Tub+|TBs and mixed-networks reverted back to ‘stand-by’ Tub−|TBs 2 h after aphid removal, indicating that TB activation is reversible. This effect was also highly significant (p<0.0001, GLM, df = 1, χ2 = 17.98, n = 3). SD in (E): standard deviation from three independent experiments. A total of 969 TBs surrounding 42 sheaths were counted from freshly aphid-infested tissue, and 194 TBs surrounding eight sheaths were counted in the ‘aphids removed’ experiments. Original data can be found in
Figure 8—source data 4.
DOI: 10.7554/eLife.00183.033
The following source data are available for figure 8:
Source data 1. Confocal single sections and acquisition parameters for Figure 8A.
DOI: 10.7554/eLife.00183.034
Source data 2. Confocal single sections and acquisition parameters for Figure 8B.
DOI: 10.7554/eLife.00183.035
Source data 3. Confocal single sections and acquisition parameters for Figure 8D.
DOI: 10.7554/eLife.00183.036
Source data 4. Source data for Figure 8E.
DOI: 10.7554/eLife.00183.037 Figure 8. Continued
Plant biology
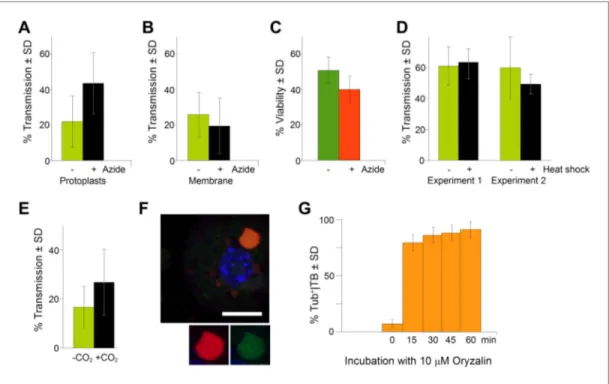
Figure 9. TB transformation correlates with enhanced transmission efficiency. (A) Azide enhances transmission
from protoplasts. Aphids were allowed to acquire CaMV from infected protoplasts that displayed mixed-networks induced by azide. They were then transferred to healthy test plants for inoculation, and infected plants were counted 3 weeks later. The difference in transmission was highly significant (p<0.0001, hierarchical GLM model,
Table 3 and Figure 9—source data 1). (B) Azide does not affect aphid behavior. To rule out an unwanted effect
of azide on aphid viability and behavior, aphids were membrane-fed solutions containing purified virus particles, recombinant P2 and P3, in the presence or absence of azide, and then transferred to healthy test plants for inoculation. Transmission rates were determined 3 weeks later by scoring infected plants. Data from one experi-ment are shown, using three different virus preparations as a virus source for each condition. See Figure 9— source data 2 for details. (C) Azide does not affect protoplast viability. Protoplasts were incubated for 1 h (the
duration of a transmission test) in the presence or absence of 0.02% azide, and then protoplast viability was determined with the FDA test (Widholm, 1972). Data from one out of two experiments are shown. The difference
in viability was insignificant in this experiment (p=0.0658, n = 6, Mann–Whitney test) and also in the second experiment. See Figure 9—source data 3 for all data. (D) Heat shock does not enhance CaMV transmission.
Leaves from GFP-TUA6 Arabidopsis either received heat shock (+) or did not (−). The presence of Tub+|TBs was verified by fluorescence microscopy and the leaves were then used in aphid transmission assays. No significant difference in transmission was observed in either of two independent experiments (p=0.73 and p=0.08, respectively, hierarchical GLM model, see Table 4 and Figure 9—source data 4). (E) CO2 enhances CaMV transmission. Leaves with mixed-networks induced by CO2 were used in plant-to-plant aphid transmission experiments. CO2-treated leaves performed significantly better in transmission tests than controls (p=0.0025, hierarchical GLM model, see
Table 5 and Figure 9—source data 5). (F) Oryzalin induces Tub+|TBs. Immunofluorescence of oryzalin-treated protoplasts shows that α-tubulin (green) accumulates with P2 (red) in TBs. The nucleus is stained with DAPI (blue). The image is a confocal projection. The insets show a separate channel presentation of a representative optical single section of the TB, for details refer to the image stack in Figure 9—source data 6 that was used for this
projection. Scale bar = 10 μm. (G) Kinetics of Tub+|TB formation in protoplasts that were treated with oryzalin for the duration indicated. Most TBs transformed to the Tub+-state within 15 min. Mixed-networks were not observed and thus are not indicated in the histogram. Data is from one of three independent experiments, where a total of 1556 TBs were analyzed. See Figure 9—source data 7 for details. SD: standard deviation.
DOI: 10.7554/eLife.00183.038
The following source data are available for figure 9:
Source data 1. Source data for Figure 9A.
DOI: 10.7554/eLife.00183.039
Source data 2. Source data for Figure 9B.
DOI: 10.7554/eLife.00183.040 Figure 9. Continued on next page
Plant biology
annealed. This created XhoI-compatible restric-tion sites at the two extremities of the then double-stranded oligonucleotide that were used for insertion into the unique XhoI site in the Cabb B-JI genome cloned into the pCa24 plasmid (Delseny and Hull, 1983). Positive clones were identified by PCR and verified by sequencing. They contained a seven-amino-acid insertion at amino acid position 100 of the P2 open reading frame, coding for a tetracysteine tag (CCPGCC [Griffin et al., 1998]) as well as an additional serine.
Aphids
A non-viruliferous clonal Myzus persicae popula tion was reared under controlled conditions (22/18°C day/night with a photoperiod of 14/10 h day/night) on eggplant and cultivated by G. Labonne (INRA, Montpellier). The population was started from a single virginiparous female.
Recombinant P2-TC
To produce recombinant P2-TC using the Sf9/ baculovirus system, the tetracysteine sequence and an additional serine were introduced into the unique XhoI site in the P2 coding region of plas-mid p119-P2, using the same strategy as for clon-ing CaMV-P2TC described above. Recombinant baculovirus was obtained by homologous recom-bination as described in Blanc et al. (1993b). Infected Sf9 cells were harvested 48 h after inocu-lation and total cell extracts were prepared in SES buffer and stored at −20°C until use.
Isolation of protoplasts
Protoplasts were prepared from healthy or infected (14 dpi) leaves of turnip plants as described in
Martinière et al. (2009). Briefly, leaves were ster-ilized by submerging them in 20-fold diluted Domestos solution (http://www.unilever.com) for 3 min. The leaves were then washed three times with water, prior to overnight incubation in
Source data 3. Source data for Figure 9C.
DOI: 10.7554/eLife.00183.041
Source data 4. Source data for Figure 9D.
DOI: 10.7554/eLife.00183.042
Source data 5. Source data for Figure 9E.
DOI: 10.7554/eLife.00183.043
Source data 6. Confocal single sections and acquisition parameters for Figure 9F.
DOI: 10.7554/eLife.00183.044
Source data 7. Source data for Figure 9G.
DOI: 10.7554/eLife.00183.045 Figure 9. Continued
Table 3. Statistical analysis of transmission
experiments using azide-treated protoplasts as virus source
Experiment n
Transmission
frequency LCI UCI
Global −Azide 16 0.24 0.18 0.30 +Azide 16 0.40 0.33 0.47 Experiment 1 −Azide 3 0.32 0.22 0.43 +Azide 3 0.38 0.27 0.50 Experiment 2 −Azide 3 0.44 0.32 0.55 +Azide 3 0.66 0.54 0.76 Experiment 3 −Azide 3 0.19 0.11 0.29 +Azide 3 0.41 0.30 0.52 Experiment 4 −Azide 3 0.33 0.22 0.44 +Azide 3 0.46 0.35 0.58 Experiment 5 −Azide 4 0.10 0.03 0.19 +Azide 4 0.38 0.29 0.48
We measured the transmission rate by aphids for each condition of treatment (−azide and +azide) for the five experiments. Since a non-significant interaction between experiments and treatments was found (GLM, df = 4, χ2 = 6.69, p=0.15), the data was pooled in the line named ‘global’. Azide induced a highly significant increase of the transmission rate compared to the control without azide (hierarchical GLM model using Firth’s penalized likelihood, df = 1, χ2 = 35.29, p<0.0001) with a transmission rate of 23.7% (95% CI: 17.6–29.7%) for control and 39.9% (33.2–46.6%) for azide treatment.
CI: confidence interval; n: number of repetitions per experiment; LCI, UCI: lower and upper limits of confidence intervals, respectively.