HAL Id: hal-01658951
https://hal.uca.fr/hal-01658951
Submitted on 11 Jan 2018
HAL is a multi-disciplinary open access
archive for the deposit and dissemination of
sci-entific research documents, whether they are
pub-lished or not. The documents may come from
teaching and research institutions in France or
L’archive ouverte pluridisciplinaire HAL, est
destinée au dépôt et à la diffusion de documents
scientifiques de niveau recherche, publiés ou non,
émanant des établissements d’enseignement et de
recherche français ou étrangers, des laboratoires
Dynamic Characterization of the Supporting Layers in
Railway Tracks Using the Dynamic Penetrometer Panda
3®
Esteban Escobar, Miguel Benz Navarrete, Roland Gourves, Younes Haddani,
Pierre Breul, Bastien Chevalier
To cite this version:
Esteban Escobar, Miguel Benz Navarrete, Roland Gourves, Younes Haddani, Pierre Breul, et al..
Dy-namic Characterization of the Supporting Layers in Railway Tracks Using the DyDy-namic Penetrometer
Panda 3®. Procedia Engineering, Elsevier, 2016, Advances in Transportation Geotechnics III, 143,
pp.1024-1033. �10.1016/j.proeng.2016.06.099�. �hal-01658951�
doi: 10.1016/j.proeng.2016.06.099
Dynamic Characterization of the Supporting Layers in
Railway Tracks using the Dynamic Penetrometer
Panda 3®
Esteban Escobar
1*, Miguel Benz Navarrete
1, Roland Gourvès
1, Younes
Haddani
1, Pierre Breul
2, and Bastien Chevalier
21
Sol Solution, Service Innovation et Diagnostique d’Ouvrages, Riom Cedex, France
2
Institut Pascal, Polytech’ Clermont Ferrand, Université Blaise Pascal, Clermont Ferrand, France
Abstract
This article presents the instrumented dynamic penetrometer Panda 3®, the principle function and development to characterize the geomechanical behavior of the different layers forming the railway track structure. Initially, laboratory tests were launched in a calibration chamber to test the repeatability and reliability of measurements. The test material included two types of soil (Allier sand and Laschamps clay) compacted at different density. The results were conclusive in qualitative and quantitative terms. Subsequently, a summary of results obtained in various test campaigns performed on three railway sites is also presented, in order to assess a possible similarity of results obtained with the new technique to those obtained from conventional geotechnical and geophysical tests.
Keywords: Load-penetration curve σp-sp; Panda 3®; dynamic characterization; railway tracks
1
Introduction
The dynamic characterization of layers of foundation and the soil platform constitutes a major challenge for rail applications. On one hand, upstream as part of geotechnical investigations prior to the design of new railways and on the other hand, as part of the maintenance and renewal of the existent ones. Given this and due to the multilayered nature of the materials, it becomes necessary to develop specific and unobtrusive technique of measurements to study changes in the stiffness and bearing capacity of each layer. In this context, the dynamic penetrometer is a very interesting tool. However, these devices make it possible to obtain only one piece of information from the soil, the dynamic cone resistance qd.
Significant research led to the development of a new type of dynamic penetrometer: Panda 3®. This is a lightweight penetrometer with variable energy (Figure 1a) equipped with various sensors
*
Corresponding author e-mail: [email protected]
Procedia Engineering
Volume 143, 2016, Pages 1024–1033 Advances in Transportation Geotechnics 3 . The 3rd International Conference on Transportation Geotechnics
(ICTG 2016)
1024 Selection and peer-review under responsibility of the Scientific Programme Committee of ICTG 2016 c
allowing the user to obtain the dynamic cone resistance qd but also to determine other additional parameters such as the dynamic stiffness EkdP3, the deformation modulus EdP3, as well as wave velocity
cpP3 and csP3 of the soil (Figure 3).
This article presents the instrumented dynamic penetrometer Panda 3®, the principle function and development to characterize the geomechanical behavior of the different layers forming the railway track structure. Initially, laboratory tests were launched in a calibration chamber to test the repeatability and reliability of measurements. The test material included two types of soil (Allier sand and Laschamps clay) compacted at different density. The results were conclusive in qualitative and quantitative terms. Subsequently, a summary of results obtained in various test campaigns performed on three railway sites is also presented, in order to assess a possible similarity of results obtained with the new technique to those obtained from conventional geotechnical and geophysical tests.
2
Principle and Development of the Panda 3®
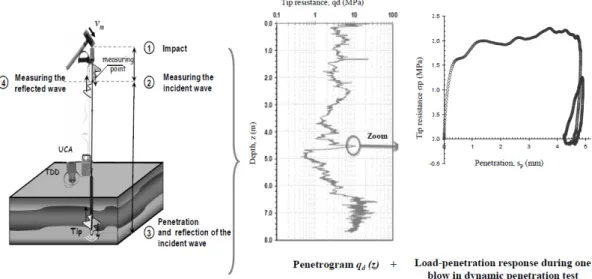
The Panda 3 penetrometer has been designed based on the penetrometer Panda® [1]. The principle of the test is simple (Fig 1): during driving, we measure on the rods, near the anvil, the variation of the deformation ε(x,t) and/or acceleration α(x,t) caused by the compressional wave created by the impact. For each impact, after decoupling descending εd and ascending wave εr it is possible to calculate the
penetration sp(t) and the resulting force Fp(t) at the tip during penetration of the cone. By making some
simplifying assumptions [2], it is also possible to plot the dynamic load-penetration curve σp-sp for
each hammer impact (Fig 1c). An analytical methodology permits to exploit this curve to determine different soil parameters such as: penetration resistance qd and qc, the dynamic stiffness kdP3, the
deformation modulus EdP3 and the wave velocity in the soil (CpP3) [3]. A summary of the operating
parameters from the time and frequency analysis of the signals recorded during driving is presented in the following chapter.
Figure 1: Principle of the Panda 3®: (a) wave propagation, (b) the penetrogram of: tip resistance and (c)
2.1
Parameters of Resistance
An analytical methodology for the interpretation of the σp-sp curve was proposed by Smith [4]. Assuming that the tip resistance qd(t) is the resultant of:
static component Rs, which obeys an elastic-perfectly plastic law, and
dynamic component Rd(t),which is proportional to the velocity of the penetration vp(t);
We determine the value of Rs supposing that when vp(t) equals zero the dynamic component Rd(t)
cancels itself out and Rs is then equal to qd(t). The values of Rd(t) and the dampening ratio of Smith Js
are determined in the penetration interval [se; smax], with se and smax being the elastic and maximum
penetration and writing that Rd(t) = qd(t)-Rs et Js=Rd(t)/(Rsvp(t)) (Figure 2.a).
2.2
Parameters of Deformation
Once the maximum penetration smax is reached, we assumed that soil and the penetrometer vibrate
together in a pseudo-elastic regime. In this part of the σp-sp, curve, two moduli are defined as: an
unloading modulus EdP3 (line AB) and a reloading modulus ErP3 (line BC) (Figure2.a). Supposing that
the cone is a small plate embedded in a semi-infinite elastic solid we can calculate the value of Ed,rP3
by applying the equation of Boussinesq (1) proposed by [5].
M p p d p r d k d s q E 1 4 ) 1 ( 2 3 ' (1)
With µ the Poisson's ratio supposed equal to 0,33, dp the diameter of the cone and kM the
coefficient of embedding of Mindlin [5].
Figure 2: Interpretation of the signals recorded during the driving from the time and frequency analysis: (a)
analytical model of interaction cone/soil [4] and (b) mobility curves obtained in the laboratory for different materials (Allier sand, Laschamps clay and DGA Silt).
2.3
Dynamic Stiffness
Another method to exploit the signals recorded during driving of Panda 3® penetrometer is one proposed by Paquet [6]. In fact, the shock wave caused by the impact of the hammer and vibration of system penetrometer/soil can be described by determining the impedance. This is obtained by conventional methods of the Fourier transform to obtain the transfer functions, and thus drawing the mobility curve (Figure 2.b). Moreover, according to Caballero [7] it is possible to estimate the
Dynamic Characterization of the Supporting Layers in Railway Tracks using Panda 3 Escobar et al.
dynamic stiffness KdP3 for the frequency range between 0 and 100 Hz. Similarly, assuming the cone
penetrometer is a small plate in a semi-infinite elastic medium, it is possible; through the expression proposed by Boussinesq to calculate the deformation modulus EkdP3 at low-frequency according to the
expressions (2) and (3). M KP d 2 3 (2)
3 2 3 1 P d p P Kd K E (3)With KdP3 the dynamic stiffness determined from the transfer curves, Δω the frequency variation
and ΔM variation of mobility in the frequency range between 0 and 100 Hz, μ Poisson's ratio (0,33) and the ϕp the diameter of the cone.
2.4
Waves Velocity
The velocity of compressional wave cpP3 in the soil is calculated through polar shock suggested by
[8]. For each impact we measure the peaks of the descending and ascending waves in a time to+2Lt/ct.
The value of the shear wave velocity csP3 is calculated according to the expression (4) assuming that
the value of µ equals 0,33.
3 3 ) 1 ( 2 2 1 P p P s c c (4)
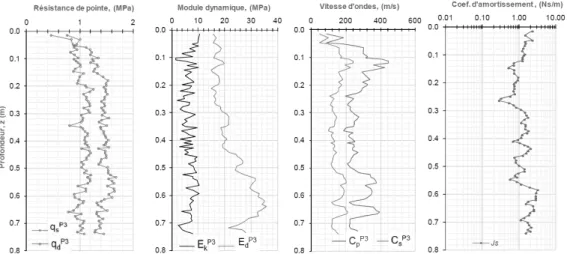
In the practice, at the end of one penetration test, we obtained the penetrograms curves of the dynamic qd and pseudo-static qs resistance, dynamic stiffness EkdP3, deformation modulus EdP3, the
shear and compressional waves velocity (cpP3 and csP3) and a damping coefficient Js (Figure 3).
Figure 3: Panda 3® results obtained in a calibration chamber for Laschamps clay. Penetrogram of: (a) tip
resistance qd et qc, (b) dynamic stiffness EkdP3 and deformation modulus EdP3, (c) the shear and compressional
3
Calibration Chamber Testing
3.1
Materials and Methods
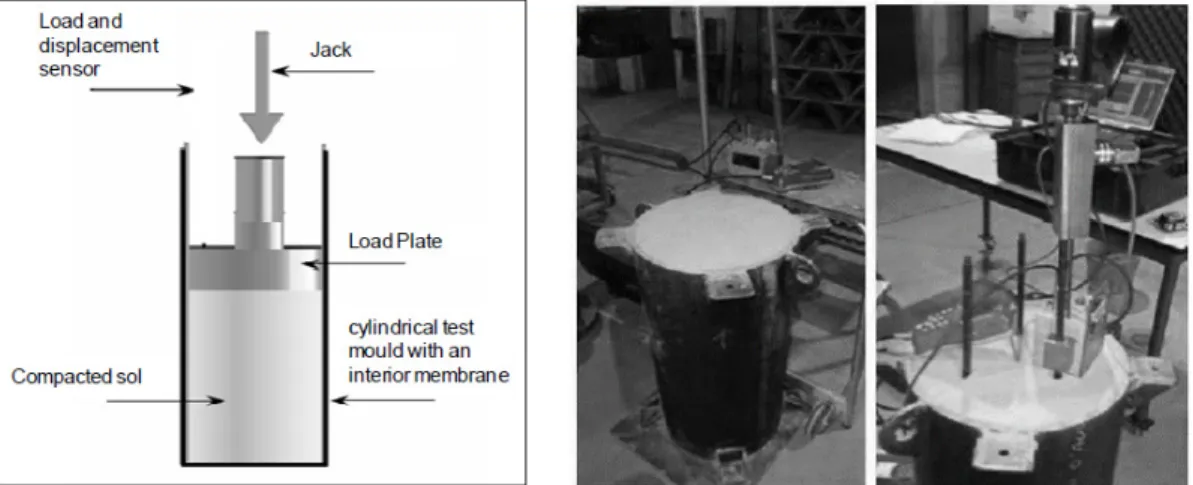
A series of tests was carried out in a calibration chamber made of a steel cylinder of 400 mm in diameter and 800 mm in height (Figure 4.a).The goal was on one hand to confirm the results obtained by exploiting the σp-sp curve of the Panda 3® and, on the other hand, to verify their sensibility to the
soil state. Two types of soils have been used: Allier’s sand and Laschamp’s clay at different densities. Different tests were conducted using different densities γs and different moisture states w for every
soil studied (Table 1). The compaction of the samples was carried out within a cylinder equipped with different sensors according to the procedure described by [9]. Once the specimens made, three penetration tests were performed with the Panda 2 and the Panda 3 (Figure 4.c).
Figure 4: (a) oedometrical load tests during compaction of the sample, (b) compacted sample in calibration
chamber (c) Panda 3® test.
3.2
Results
A total of thirteen Panda 3® tests were conducted, one for each sample of soil (Table 1). For each test and therefore for each blow given during the driving, the σp-sp curve was determined. An example
of the curves obtained in a test for four different specimens is shown in Figure 5. In the example, the scales of load σp and penetration sp are normalized to the maximum load σp max and the maximum
penetration sp-max measured for each plot impact. From the σp-sp curves exposed, we can see that they
are specific and repetitive for each soil studied. Likewise, the shape curves are sensitive to the soil state. In the case presented, we can see that:
for Allier sand: increasing of soil’s density results with nearly asymptotic σp-sp curves
shape and with increasing of elastic springback (Figure 5.a, b),
for Laschamps clay: the shape of the σp-sp curves is sensitive to the soil's water status.
When the soil is very wet (Figure 5.c) the stress increases rapidly to its peak σp-max, then
falls at the same speed to the residual value. The peak is less pronounced when the soil is dry and more dense (Figure 5.d).
Dynamic Characterization of the Supporting Layers in Railway Tracks using Panda 3 Escobar et al.
Figure 5: σp-sp curves for Allier sand (a) γs : 16,26kN/m 3 , w% :14,6, (b) γs : 16,83kN/m 3 , w% :0,8 and Laschamps clay (c) γs :16,72kN/m3, w% :19,15 et (d) γs :17,43kN/m3, w% :0,6.
Moreover, the calculated parameters are displayed as penetrograms, as shown in Figure 3. In the example, the penetrograms obtained in specimens of Laschamps clay (medium dense 16,6 kN/m3) is presented. From these penetrograms we calculated the average value for each parameter from the exploitation of the σp-sp curves (Table 1). It may be noted that these ones vary according to the nature
and condition of the soil studied. Likewise, the magnitude of the calculated parameters, such as the
cpP3 and csP3 wave velocity has a good correspondence with those proposed in the literature [10].
Characteristi
cs Allier sand (GTR : B1 - USCS : SP)
Laschamps clay (GTR : A2 - USCS : ML) Samples 1 2 3 4 5 6 7 1 2 3 4 5 6 w (%) 0,8 0,8 10 10 10 14, 6 14, 6 0,6 0,6 0,6 15, 3 15, 6 19, 1 γd (kN/m3) 16, 1 16, 8 15, 3 16, 7 18, 2 16, 2 16, 5 15, 7 16, 6 17, 4 16, 6 17, 4 16, 7 Panda 3® results (mean values for each sample)
- qd (MPa) 2,3 11 1,7 8,2 41, 7 2,6 4,6 11 32 61 1,5 3,0 4,0 - cpP3 (m/s) 388 103 9 398 801 376 2 383 504 238 0 615 1 577 5 597 989 108 1 - csP3 (m/s) 188 568 212 428 201 1 184 242 114 5 295 5 277 3 286 475 519 - EdP3 (MPa) 32 72 29 60 173 26 49 60 130 221 31 62 64 - Js (Ns/m) 0,3 1 0,0 9 0,4 5 0,6 1 0,7 1 0,1 5 0,1 8 0,6 3 0,6 5 0,7 0 0,4 3 0,5 6 0,7 5 Table 1: Summary of results obtained using the Panda 3® in a calibration chamber.
To show the interest of this new auscultation technique, three railway sites were submitted to tests: Vernouillet (78), Vierzon (18) and Thionville (57). Those tests are briefly described in the following chapter.
4
Experimental Campaign at Railway Line
4.1
Sites Description: Vernouillet, Vierzon and Thionville
The site Vernouillet (78) is an experimental site where various geotechnical works were conducted as part of the RUFEX project [11]. The observed site is located at the sorting level of the train station
which consist of about twenty lines, the tests were realized in Zone 2 of the line 32 (V32) (Figure 6.a). Regarding the geology of the site, it is expected to find ancient alluvium soil all along the line 32. They consist of gravel and sand, frequently encountered by large blocks of sandstone. The thickness of alluvium varies from 3 to 10 m. At this site, a total of three surveys Panda 3® were conducted until the penetrometer reached its capacity (about 3.5 m deep). Other tests have also been realized; they are summarized by [12].
Similarly, as part of technical exchanges between Sol Solution and SNCF, it was possible to intervene on a second test site in Salbris / Theillay near Vierzon (18). This site, on the line Aubrais - Orléans to Montauban-Ville-Bourbon is located in an excavation area (Fig 6 b.). The geology of the site of Vierzon consists at the superficial level (z <7 m) of sandy-clay formations, clay and sandy clays. Seismic characterization tests (Method MASW) and dynamic penetration tests with Panda 2® (31 samples) and Panda 3® (4 samples) were realized as well as further characterization of the surface stiffness (dynamic load plate test) (Figure 7.d) [13].
Figure 6: Locations of tested railway sites: (a) Vernouillet (78), (b) Vierzon (18) and (c) Thionville (57) [14]. Furthermore, as part of the European Project RIVAS (Railway Induced Vibration Abatement Solutions) a third railway site was tested. This site is located at the line Mohon-Thionville at embankments level near Florange (Figure 6c). The geology of the Florange site near the village of old vineyards consists of silt-gravel railroad embankments, followed by clay-like silt and silty, sandy gravel. Blackish gray clay appears at about 6m depth and compact marl about 11m depth. During the series of in-situ tests, dynamic penetration tests accompanied by geo-endoscopic [15] tests were realized at the center of the line. In addition, we conducted seismic characterization tests (MASW and Refraction) and dynamic penetration tests, including one test using the Panda 3®, on the embankment of the line (penetrometer refusal at about 7 m depth).
Figure 7: Test campaign carried out on the Vierzon site, (a) Panda 3®, (b) geo-endoscopic tests, (c) MASW and
(d) dynamic load plate test [13].
Dynamic Characterization of the Supporting Layers in Railway Tracks using Panda 3 Escobar et al.
4.2
Summary and Results Comparison
In these experiments the feasibility of tests was observed in real conditions which allow to validate the repeatability and quality of measurements made with the Panda 3®. Among the results obtained from analyzing the signals and load-penetration curves which are previously presented, the characterization of the failure behavior and stiffness of the line using the measures of dynamic resistance of the tip qd, and dynamic stiffness EKdP3, as well as the shear waves velocity csP3 are of
particular interest.
Table 2 provides a summary of results for each of sites presented in the preceding paragraphs. They are organized in function of the site and each horizon identified along the survey. The results thus presented in the table are the average values for each parameter and for each layer.
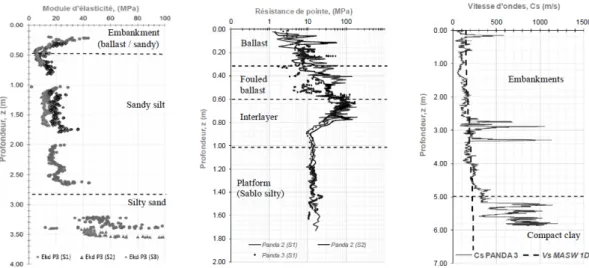
Site Horizon Thickness (m) qd (Mpa) EkdP3 (Mpa) CsP3 (m/s)
Vernouillet Embankment (ballast /
sandy) 0,00 – 0,40 5,9 20,0 178 Sandy silt 0,40 – 2,75 3,2 16,0 273 Silty sand 2,75 – 3,50 13,3 64,0 829 Vierzon Ballast 0,00 – 0,35 5,0 50,0 336 fouled ballast 0,35 – 0,60 35,0 48,0 357 Interlayer 0,60 – 1,05 60,0 84,0 516
Platform Sablo silty 1,05 – 1,65 13,4 33,0 389
Thionville Embankments (Clay with
blocked passage) 0,00 – 5,20 2,5 26,0 256
Compact clay 5,20– 5,90 17,0 45,0 679
Table 2: Summary of Panda 3® results for each horizon identified along the survey.
In following, a comparison of the results with the Panda 3® (resistance, modulus, wave velocity) with those obtained using other techniques (MASW geophysical testing and penetrometer Panda 2) is proposed. The aim is to study, through this comparison, the reliability of results.
Figure 8: Results of Panda 3® at railway sites (a) repeatability of measurements of dynamic stiffness EkdP3 out of
three tests Panda 3 ˗ Vernouillet (Center of the line V32), (b) comparative tests between dynamic resistance at the tip qd Panda 2 and qd Panda 3 ˗ Vierzon (Center of the line 2) and (c) comparative tests between wave velocity
With regards to the site of Vernouillet Figure 8.a, the variation of the dynamic stiffness EkdP3 in
function of the depth z. is presented in a form of penetrogram. Three tests using Panda 3 were conducted along the line 32, each spaced from the next one for about ten meters. Moreover, the measurements were carried out by measuring levels at different depths. The good repeatability of measurements and correspondence of the values found for each identified horizon is evident.
At the site in Vierzon, Figure 8.b shows the superposition of penetrograms, the first one qd PANDA 2
obtained using Panda 2, and the second one qd PANDA 3 using Panda 3. The tests in question were
realized on the axis of the line 2 spaced from each other 5 m. With regard to the layers under line, it is possible to identify a first relatively compact layer (qd> 40 MPa) between 0.35 m and 0.90 m of depth.
Beyond that depth is the natural soil (soil support platform) for which tip resistances values qd are
between 10 MPa and 20 MPa. Although calculation of the tip resistance qd is based on different
principles [16], it is possible to find the correct correspondence among the results obtained for both devices.
Figure 8.c shows the results obtained in terms of wave velocity, on the railway site Thionville. It is observed that superposition of obtained curves follows the same velocity as the shear wave velocity of the seismic method Vs. However there are occasional passages where the results obtained using Panda
3® and seismic measurement MASW 1D are less compatible. This could be explained by the integrative character of the seismic method which takes into account a large volume of soil and tends to homogenize the results, making it an unsuitable tool for site reconnaissance at low depth.
5
Conclusion
This article presents the recent developments made on the Panda 3® penetrometer in order to characterize the geomechanical behavior of the different layers forming the railway line structure. The test allows, from the measurement and the decoupling of waves created by the impact, to obtain for each impact a load-penetration σp-sp curve of the tested soil. The exploitation of this curve permits to
determine the resistance parameters (cone resistance qd and qc), deformation (EkdP3 and EdP3), damping
characteristics (Js) and wave velocity of soils (cpP3 and csP3) inspected in function of the depth
throughout the survey. The tests performed in a calibration chamber showed good repeatability of the measurements as well as their sensitivity to soil conditions (density and moisture state) and aligned with the literature values. Subsequently this new technique was applied on three railway sites. The realization of this analysis has allowed us first to show the feasibility of such a test in real conditions as well as the relevance of the results. The results of comparative tests between Panda 3® and seismic method MASW reveals all the interest on this new auscultation technique because it provides realistic wave velocity values and identifies different layers and transitions between them that other techniques fail to highlight. This technique would allow engineers to provide satisfactory data for the rational design of railway foundation structure.
References
[1] R. Gourvès, Le PANDA – pénétromètre dynamique léger à énergie variable, LERMES CUST, Université Blaise Pascal Clermont-Ferrand, 1991.
[2] E. Escobar, Mise au point et exploitation d'une nouvelle technique pour la reconnaissance des sols : le Panda 3®, Phd Thesis Université Blaise Pascal, Clermont-Ferrand, France, 2015.
[3] M.A. Benz Navarrete, E. Escobar, R. Gourvès, Y. Haddani, P. Breul, C. Bacconnet. "Mesures dynamiques lors du battage pénétromètrique – Détermination de la courbe charge-enfoncement dynamique en pointe", in Proceedings of the 18th International Conférence on Soil Mechanics and Geotechnical Engineering, Paris, France, 2013, pp. 409-503.
Dynamic Characterization of the Supporting Layers in Railway Tracks using Panda 3 Escobar et al.
[4] E.A.L. Smith, Pile-Driving Analysis by the Wave Equation, ASCE. Paper No. 3306, Volume 127, Partie I, 1962, pp 1145-1193.
[5] H. Arbaoui, R. Gourvès, Ph. Bressolette, L. Bodé, “Mesure de la déformabilité des sols in situ à l’aide d’un essai de chargement statique d’une pointe pénétromètrique”, Revue Canadienne de géotechnique 43(4), 2006, pp. 355-369.
[6] J. Paquet, Etude vibratoire des pieux en béton, réponse harmonique et impulsionnelle. Application au contrôle. Annales de l'ITBTP, n°245, 1968.
[7] C.R. Caballero, Evaluación Numérico Experimental del comportamiento bajo carga axial de Pilotes. Tesis Doctoral. Facultad de Ciencias Exactas, Fisicas y Naturales de la Universidad Nacional de Cordoba, Argentina, 2007.
[8] G. Aussedat, Sollicitations rapides des sols, Phd Thesis, Faculté de sciences de l’Université de Grenoble, Grenoble, France, 1970.
[9] L. Chaigneau, “Caractérisation des milieux granulaires de surface à l’aide d’un pénétromètre”, Phd. Thesis de l’Université Blaise Pascal, Clermont-Ferrand, France, 2001.
[10] I. Sharour, R. Gourvès. “Reconnaissance des terrains in situ”, Ed. Hermes-Lavoisier. 192p, 2005.
[11] N. Calon, A. Robinet, S. Costa D’Aguiar, L. Briançon, C. Cojean, J.-F. Mosser, Renforcement de plates-formes ferroviaires par colonnes de soil mixing réalisées sans enlever la voie, Proceedings of the 18th International Conférence on Soil Mechanics and Geotechnical Engineering, Paris, 2013, pp 1245-1248.
[12] M.A. Benz-Navarrete, E. Escobar, Y. Haddani, R. Gourvès, S. Costa D’Aguiar and N. Calon, Determination of Soil Dynamic Parameters by the Panda 3®: Railways Platform Case, Proceedings of the Second International Conference on Railway Technology: Research, Development and Maintenance, Ajaccio, France, n°56, 2014.
[13] E. Escobar, M.A. Benz-Navarrete, Y. Haddani, F. Lamas-Lopez, N. Calon and S. Costa D’Aguiar, Reconnaissance dynamique des sites ferroviaires à l'aide du pénétromètre Panda 3®, Journées Nationales de Géotechnique et de Géologie de l’Ingénieur JNGG2014, Beauvais, France, n°179, 2014.
[14] M.A. Benz-Navarrete, R. Gourvès, E. Escobar, Y. Haddani, N. Calon, S. Costa D’Aguiar and A. Robinet, Détermination de la raideur dynamique des plateformes ferroviaires à l’aide de l’essai pénétrométrique Panda 3®, 2ème Symposium International en Géotechnique Ferroviaire, Marne la Vallée, France, 2014.
[15] Y. Haddani, P. Breul, R. Gourvès, Géoendoscopie : application au diagnostic d’ouvrages enterrés en service, Journées Nationales de Géotechnique et de Géologie de l’Ingénieur, Optimisation de l’insertion des ouvrages dans le sol et le sous-sol, Nancy, 2002.
[16] M.A. Benz Navarrete, Mesures dynamiques lors du battage du pénétromètre Panda 2®, Phd Thesis Université Blaise Pascal, Clermont-Ferrand, France, 2009.
![Figure 2: Interpretation of the signals recorded during the driving from the time and frequency analysis: (a) analytical model of interaction cone/soil [4] and (b) mobility curves obtained in the laboratory for different](https://thumb-eu.123doks.com/thumbv2/123doknet/14595146.543095/4.816.98.700.539.768/interpretation-recorded-frequency-analysis-analytical-interaction-laboratory-different.webp)

![Figure 7: Test campaign carried out on the Vierzon site, (a) Panda 3®, (b) geo-endoscopic tests, (c) MASW and (d) dynamic load plate test [13]](https://thumb-eu.123doks.com/thumbv2/123doknet/14595146.543095/8.816.107.700.718.893/figure-test-campaign-carried-vierzon-panda-endoscopic-dynamic.webp)