1 This is an accepted manuscript of an article published by Elsevier in Transportation Research Part D: Transport and Environment on March 28 2016, available at http://dx.doi.org/10.1016/j.trd.2016.03.005
This manuscript version is made available under de CC-BY-NC-ND 4.0 license http://creativecommons.org/licenses/by-nc-nd/4.0/
Please cite as:
Carrier, M., Apparicio, P., Séguin, A.‐M, & Crouse, Dan. (2016). The cumulative effect of nuisances from road transportation in residential sectors on the Island of Montreal – Identification of the most exposed groups and areas. Transportation Research Part D: Transport and Environment, 46, 11‐25. doi: 10.1016/j.trd.2016.03.005.
1. Introduction
Road transportation represents a major element of a given area’s spatial organization, in allowing for personal mobility and fostering economic development (Geurs et al., 2009). On the other hand, quality of life has been found to be lower for populations living in the immediate proximity of major traffic arteries (Barros et al., 2013; Liu, 2001). Indeed, areas located less than 200 metres from the centre of a highway generally show high concentrations of air pollutant and road traffic noise levels, creating substantial impacts on the health and well-being of the people living there (Brugge et al., 2007; Rioux et al., 2010; Zhu et al., 2002b). Exposure to high concentrations of road transportation-related air pollutants, such as nitrogen dioxide (NO2), can lead to increases in respiratory difficulties and asthma (Jerrett et al., 2008; McConnell et al., 2006), impaired lung development in children (Gauderman et al., 2007) and heart problems (Hoffmann et al., 2009; Kan et al., 2008; Van Hee et al., 2009). As for road traffic noise, prolonged exposure can lead to sleep problems (Bluhm et al., 2004; Öhrström and Skånberg, 2004), high blood pressure (Bluhm et al., 2007), development of cardiovascular disease (Babisch, 2008), increased cognitive difficulties in children (Evans et al., 2001), issues with diabetes (Sorensen et al., 2012), and hearing loss (Moudon, 2009; Seto et al., 2007; van Kempen et al., 2002). Air pollution and road traffic noise-related health impacts are also said to be greater in children and the elderly. Children are in fact more vulnerable to the effects of pollutants because their organs and nervous systems are not fully developed (Bolte et al., 2010) and they breathe in more air per unit of body mass (Landrigan et al., 2004) than do adults. Older people are also vulnerable to the negative aspects of their environment given that some of their vital functions decline with age (Day, 2008; Kelly et al., 2003; OMS, 2007). In addition, due to their more limited mobility, these two groups tend to be more restricted to their residential area (Day, 2010; Greenberg, 1993; Philipps et al., 2005). So if there are poor conditions in that area, they may be affected more strongly than those in other age groups.
1.1 Environmental equity and nuisances from road transportation
Proximity to major traffic arteries and disproportionate exposure to concentrations of road transportation-related pollutants have been the subject of studies from an environmental equity perspective. These studies have focused on the identification of social inequities in exposure to transportation-related pollution. The main objective of these studies is to answer the following question, which we paraphrase from Schweitzer and Valenzuela (2004)’s query: “Who gets what kind of environmentally undesirable effects, and why?”
The first generation of environmental equity studies, performed in the United States, analyzed the propensity of low-income populations and visible minorities to live near expressways and other major
3
traffic arteries by using buffer zones ranging from 0 to 200 metres around major roads (Bae et al., 2007; Chakraborty, 2006; Chakraborty et al., 1999; English et al., 1999; Jacobson et al., 2004) or creating density indices based on road network hierarchy (Houston et al., 2004). In the past decade, other studies carried out in Canada (Carrier et al., 2014; Crouse et al., 2009b; Jerrett et al., 2004; Jerrett et al., 2007), the United Kingdom (Briggs et al., 2008; Mitchell, 2005; Namdeo and Stringer, 2008; Wheeler and Ben-Shlomo, 2005), New Zealand (Kingham et al., 2007) and the United States (Chakraborty, 2009; Grineski, 2007) showed, with varying statistical evidence, that low-income individuals were overrepresented in areas where concentrations of air pollutants from transportation or other sources were significantly higher compared with more advantaged groups. Similar findings were also obtained in Germany (Schikowski et al., 2008), Finland (Rotko et al., 1999), France (Havard et al., 2009) and Norway (Næss et al., 2007). Considering their physiological vulnerability to exposure to air pollution, the category of children has recently been addressed in environmental equity studies on transportation-related pollution. These studies have most often concentrated on the location of schools near major roads and the children’s socioeconomic backgrounds. A number of U.S. studies have shown that children from low-income backgrounds and Hispanic or African-American communities are more likely to attend schools that are located near major roads and in the most polluted areas than are children from the least deprived backgrounds (Green et al., 2004; Gunier et al., 2003; Houston et al., 2006). Regarding the population over 65 years of age, Brainard et al. (2002), Mitchell and Dorling (2003), and Chakraborty (2009) found no environmental inequities experienced by this group in terms of air pollution exposure in Birmingham (United Kingdom) and Tampa Bay (United States). In considering potential environmental inequities related to the socioeconomic status of this group, we found only one study comparing the level of pollutant emissions that looks at different characteristics of the population over 65 years of age. Collins et al. (2011) examined disparities linked to risks of cancer from pollutant emissions in El Paso, Texas, and concluded that Hispanics aged 65 and older were more likely to develop various health problems when compared with the white population of the same age.
Studies on road traffic noise conducted from an environmental equity perspective have for their part shown inconsistent results. On the one hand, Nega et al. (2013) found that low-income individuals and visible minorities in Minneapolis, in the United States, were likely to live in sectors where road traffic noise levels were higher. Brainard et al. (2004) and Lam and Chen (2006) respectively showed that low-income individuals in Birmingham (United Kingdom) and Hong Kong live in residential areas where the level of road traffic noise is slightly higher. On the other hand, Bocquier et al. (2012) and Havard et al. (2011) report that road traffic noise levels are not statistically correlated with the level of socioeconomic
disadvantage, whether in the cities of Marseille or Paris (France). Despite their observed physiological vulnerability to the effects of noise on their state of health, people younger than 15 years of age and those aged 65 and over have rarely been considered in studies on noise. We identified only two studies, those of Brainard et al. (2004) and Nega et al. (2013), which moreover conclude that there is no environmental inequity with regard to noise for these groups.
1.2 Cumulative effects of nuisances from road transportation
The spatial distributions of road traffic noise and air pollution have long been examined separately in the literature. Some studies have reported a significant and strong correlation between air pollutant concentrations and road traffic noise levels (Allen et al., 2009; Davies et al., 2009; Foraster et al., 2011). They have emphasized that the combination of strong air pollutant concentrations and high road traffic noise levels can intensify certain health impacts, especially in relation to cardiovascular disease (Davies et al., 2009; Foraster et al., 2011; Gan et al., 2012). The cumulative effect of these two nuisances is currently the focus of sustained interest in the public health literature, particularly in terms of the individual and combined effects of these contaminants on the health and well-being of the most vulnerable population groups (Gan et al., 2012; Tétreault et al., 2013). However, analysis of the cumulative effect of several nuisances in the urban environment is as yet a little explored avenue in the sphere of environmental equity. For example, road transportation is often studied by only considering air pollution or noise. To our knowledge, only two studies have incorporated several elements of the environment into their analysis in order to assess environmental equity. Pearce et al. (2010) first measured the distribution of polluting industrial plants and facilities, the concentration of certain air pollutants (CO, NO2, PM10 and SO2) and the distribution of parks according to the level of socioeconomic disadvantage in wards across the United Kingdom. For their part, Kruize et al. (2007) measured the distribution of postal code areas in the province of Rijnmond in the Netherlands according to their income quintile and the concentrations of air pollutants (NO2), along with road traffic noise levels estimated in decibels (dB(A)). So, consideration of only one of the consequences of road transportation represents a limitation in environmental equity research, as the simultaneous effect of air pollution and road traffic noise can have potentially negative impacts on health and well-being (Evans and Kantrowitz, 2002; Pearce et al., 2010; Walker, 2011). It therefore seems important to analyze the cumulative effect of the two main road transportation-related nuisances in regard to various socioeconomic categories.
5
The results of earlier research carried out by Crouse et al. (2009b) and Carrier et al. (2014) on the Island of Montreal show that low-income individuals and, to a lesser extent, visible minorities, are overrepresented in residential sectors characterized by having some of the highest levels of transportation-related air pollutants (that is, ambient concentrations of NO2). Similarly, a recent study by Carrier et al. (2016) on road traffic noise concerning a portion of the Island of Montreal reports that low-income individuals and visible minorities are also more likely to live in neighbourhoods where the level of this nuisance is slightly higher.
The objective of this article is to determine whether individuals aged 15 years and younger, those aged 65 and over, visible minorities, and low-income individuals are overrepresented in areas where there are both relatively high concentrations of NO2 and high road traffic noise levels (quintile 5 for each nuisance), or whether, on the contrary, they are overrepresented in areas where air and noise pollution levels are among the lowest in the study area (quintile 1 for each nuisance), compared with the rest of the population and compared with their presence in the rest of the study area. Here, we define visible minorities as persons (other than Aboriginal persons) who are non-Caucasian in race or non-white in colour.1
2 Methodology 2.1 Study area
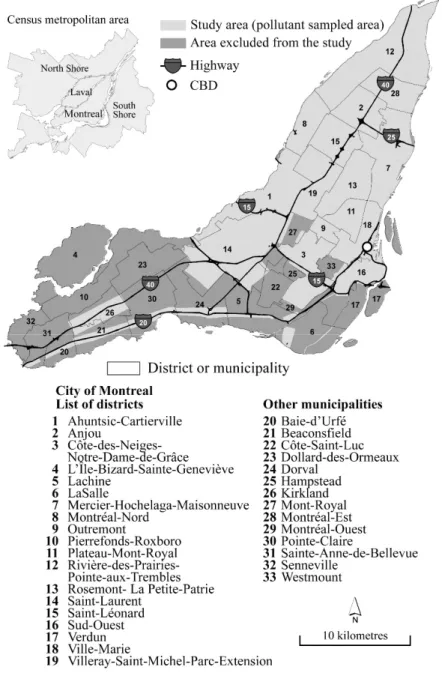
This study involves 14 of the 19 boroughs on the Island of Montreal (Canada), which, in 2011, had 1.65 million inhabitants. The Island of Montreal represents the most densely populated portion of the census metropolitan area (CMA) (Figure 1). Firstly, we only considered the Island of Montreal because traffic-related air pollution and road traffic noise data were only available for that geographic area. Secondly, the Island of Montreal is also an area of interest due to the presence there of the primary sources of pollutants from the road transportation network that enables users to travel to the metropolitan area’s main employment centres, in particular (Crouse et al., 2009b). It is also important to analyze the spatial distribution of environmental nuisances from road transportation given the continual increases in traffic volumes on the Island of Montreal’s main road network since the 1990s (MTQ, 2013). Finally, the socioeconomic profile of the population of the Island of Montreal differs from that in the metropolitan area’s suburbs, in that it includes higher proportions of low-income individuals and visible minorities.
1 The variable of visible minorities refers to all non-white individuals, except Aboriginal people: that is, the census
categories of Chinese, South Asian, Filipino, Latin American, Black, Arab, Korean, Japanese, South East Asian, West Asian and South Sea Islander (Statistics Canada, 2006).
Figure 1. Study Area
However, we had to exclude some areas due to the lack of data on traffic flows for collector and arterial roads located in the autonomous municipalities in the western part of the Island of Montreal and for some City of Montreal boroughs. The portions that we have excluded from the study area represent approximately 400,000 people: that is, 24% of the Island’s population). The study area, shown in Figure 2, does however include all the sections of highway and the main arterial and collector roads that connect the City of Montreal to its suburbs (Carrier et al., 2013). The central Island of Montreal boroughs also represent a major employment pole for the 3.92 million inhabitants of the Montreal Metropolitan Community (MMC) (Carrier et al., 2016).
7 Figure 2. Distribution of the groups in quintiles in the study area
2.2 Target groups and spatial unit of analysis
Studies in the environmental justice stream initially looked at the presence of urban nuisances in neighbourhoods of large American cities with high concentrations of low-income populations or certain racial groups, particularly of African-American and Hispanic individuals. Researchers are now introducing new social categories, often defined by age (Chakraborty, 2006; Walker, 2009). Walker
(2009) moreover advocates considering other categories of people, especially given the different types of vulnerabilities which vary from one group to another.
Our study identified four target groups: 1) low-income individuals, 2) persons claiming to be members of visible minorities, 3) young people under 15 years old, and 4) individuals aged 65 and over. We are interested in two classic groups in environmental equity studies: that is, low-income individuals and members of visible minorities (the reality in Canada making this group a more relevant category than African-American or Hispanic populations). We will also be looking at two groups that exhibit particular vulnerabilities to air pollutants and road traffic noise, as we mentioned above: older people and children. The numbers of these groups and of the total population were taken from the 2006 Statistics Canada census at the level of the dissemination area, namely, the finest unit of analysis, in which some 400 to 700 people live.
Next, checking for environmental inequities for a given population group requires that analyses be performed at a fine geographic scale, as air pollutant and road traffic noise levels can vary greatly within a neighbourhood and even within a census tract or dissemination area. We consequently selected the city block as the spatial unit from which air pollutant and road traffic noise indicators and the proportions of the four groups studied are generated. It should be noted, however, that Statistics Canada provides, at the city block level, only the total population and the number of dwellings. To address this issue, we estimated the numbers of each group as follows (equation 1), as recently proposed by Pham et al. (2012):
[1] Where tb represents the estimated population of the group (low-income individuals, for example) in city block b, td is the total population of the group in dissemination area d, and Tb and Td are the total
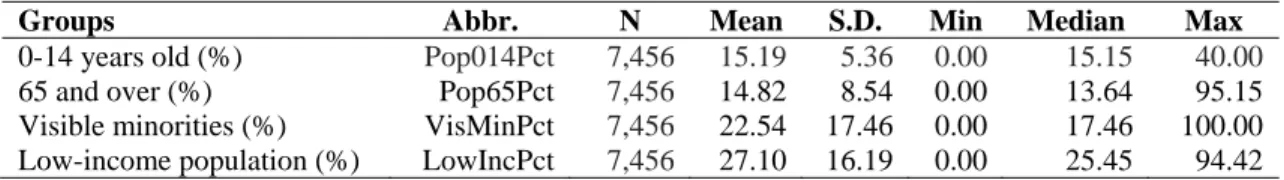
populations in the city block and dissemination area respectively. The summary statistics for the socioeconomic variables analyzed at the city block level are reported in Table 1.
Table 1. Univariate statistics of studied groups at the city block scale
Groups Abbr. N Mean S.D. Min Median Max
0-14 years old (%) Pop014Pct 7,456 15.19 5.36 0.00 15.15 40.00
65 and over (%) Pop65Pct 7,456 14.82 8.54 0.00 13.64 95.15 Visible minorities (%) VisMinPct 7,456 22.54 17.46 0.00 17.46 100.00 Low-income population (%) LowIncPct 7,456 27.10 16.19 0.00 25.45 94.42
After estimating the numbers of the four groups at the level of city blocks, the groups were distributed into quintiles based on their proportions in each of the city blocks making up the study area (Figure 3).
9 Figure 3. Air pollutant concentrations and road traffic noise levels by city block
2.3 Nuisance risk indicators
For the first indicator of nuisance, namely, exposure to ambient NO2, we used a land-use regression model describing annual mean concentrations across Montreal for the year 2006. The details of this model have been described elsewhere, but briefly, the exposure surface was developed with samples of NO2 collected in December 2005, May 2006 and August 2006 at 133 locations across the Island of Montreal, in conjunction with data describing population density, land use patterns, and locations of major traffic arteries (Crouse et al., 2009a). Based on this exposure model, we next simply set out to calculate mean NO2 values for inhabited city blocks in the study area, that is, those where the total population was greater than 0.
For the second indicator of nuisance, that is, road traffic noise measured in dB(A), road traffic noise levels were calculated using LimA 5.0 software, developed by the Netherlands firm Bruël & Kjaer. This software, compatible with ArcGIS, was previously used in various studies conducted around the world by Carrier et al. (2016), Brainard et al. (2004) and Lam and Chen (2006). The XPS 31-133 calculation method was selected to model the level of road traffic noise using LimA software and the associated prediction module 9.3.1. This calculation method was also recently employed in European Union countries to implement the road traffic noise directive for identifying areas where daily road traffic noise levels exceed the 65 dB(A) threshold, commonly called “black zones” (King et al., 2011; Murphy and King, 2010). The parameters needed to model road traffic noise are traffic flows, the characteristics of the road geometry (number of traffic lanes and road surface materials), building heights, land elevation, the presence of noise barriers and the average meteorological conditions for a summer day. The characteristics of a summer day were considered as that is the time of year when people most feel the undesirable effects of road traffic noise. Once the modeling of road traffic noise had been carried out, the mean level of this nuisance was calculated for each city block in the study area in ArcGIS software. We thus obtained measures of NO2 concentrations and noise levels in dB(A) at a common geographic scale. The summary statistics for the NO2 and the road traffic noise indicators calculated at the city block level are reported in Table 2.
Table 2. Univariate statistics of the pollutant indicators at the city block scale
Groups N Mean S.D. Min P25 P50 P75 Max
Road traffic noise (dB(A)) 7,456 62.30 5.15 50.00 58.56 61.56 65.25 91.17
NO2 (ppb) 7,456 12.46 2.70 4.45 10.32 12.08 14.49 24.22
2.4 Statistical and cartographic analyses
The spatial distribution of air pollutants and road traffic noise has already been the focus of statistical and cartographic analyses on the territory of the Island of Montreal, but the distribution of each nuisance has been analyzed separately. The results of the spatial regressions performed by Carrier et al. (2014) and Carrier et al. (2016) to measure air pollution and road traffic noise respectively show that low-income individuals and, to a lesser extent, visible minorities are overrepresented in residential sectors where the levels of these nuisances are significantly higher compared with the mean values obtained for the territory of the City of Montreal.
In the present case, the goal of the research is to measure the presence of the four groups under study in sectors associated with the highest quintiles of both air pollution and road traffic noise levels. We have
11
used quintiles for the main reason that almost 20% of the city blocks in the study area are characterized by a mean level of road traffic noise that exceeds the 65 dB(A) threshold set by Canadian transportation authorities. In the same vein, quintiles are appropriate for the calculation of NO2 concentrations. In metropolitan Montreal, some 80% to 85% of NO2 emissions have been attributed to transportation (Crouse et al., 2009; King et al., 2005). Considering that the minimal value in the fifth quintile is 15.02 parts per billion (ppb), and that transportation represents almost 80% of all the NO2 emissions, it is conceivable that the concentration of this pollutant could reach 20 ppb in some city blocks in the fifth quintile. In this regard, the World Health Organization (WHO) has determined that the annual NO2 threshold should not exceed 20 ppb. It could then be appropriate to consider city blocks in the fifth quintile for NO2 and road traffic noise as potentially disadvantaged areas due to the levels of traffic-related pollutants that may be seen as problematic by health authorities.
It is in a way a matter of observing whether the proportion of people under 15 years of age, persons aged 65 and over, visible minorities and low-income individuals is significantly higher or lower in areas seen as disadvantaged or, on the other hand, in areas defined as being advantaged. The areas defined as being advantaged are characterized by significantly lower levels of NO2 and road traffic noise in dB(A)). We have considered the city blocks located in the first quintiles for both NO2 and road traffic noise as advantaged areas. In order to do this, we drew inspiration from the environmental equity indicators proposed by Chakraborty (2006) to measure the impacts of highway redevelopment projects on the most vulnerable population groups in the United States. The first indicator allows us to assess whether one of the groups is overrepresented in disadvantaged or so-called advantaged areas compared with the rest of the population (equation 2). This involves comparing the proportion of the groups present in disadvantaged areas with that of the rest of the population in the same area. If one group is overrepresented in the disadvantaged areas compared with the rest of the population, an indicator value of greater than 1 is obtained. The second indicator allows us to determine whether one of the groups is overrepresented in disadvantaged areas compared with its presence in the rest of the study area (equation 3).
[2]
Where LII, PNLI and TOTPOP represent low-income individuals, persons above the low-income threshold and the total population respectively in disadvantaged areas (A), outside disadvantaged areas (B), and in the entire study area (T).
To conduct these analyses, we first calculated the numbers of the four population groups under study in each quintile of air pollution and road traffic noise. We also calculated the numbers of individuals over age 15, people under age 65, persons not members of a visible minority and people above the low-income threshold. We then estimated their numbers in the highest and lowest quintiles of the two nuisances. Finally, we conducted two statistical analyses. Firstly, we used a two-sample test of proportions (one-tailed) to determine the statistical significance of the indicators measured for each of the groups studied. Secondly, we used multinomial logistic regression to determine which group was significantly 1) overrepresented in the advantaged areas and 2) overrepresented in the disadvantaged areas. The main objective of this statistical method is to determine whether the associations between the proportions of the groups’ presence in the advantaged or disadvantaged areas remain significant after controlling for the independent effects of the other explanatory variables. All of these analyses were performed in SAS 9.2 (SAS Institute Inc., 2009).
3. Results
3.1 Spatial distribution of air pollution and road traffic noise
Daily NO2 concentrations and road traffic noise levels were calculated in the 7,456 city blocks in the study area. Figures 4a and 4b show the spatial concentration of NO2 and road traffic noise levels respectively, by quintile, in inhabited city blocks in the study area. We first see that the NO2 indicator generated by land-use regression is at its highest level (quintile 5) in sectors near the intersection of two or more highways, along highways 40 and 15, and in central boroughs on the Island of Montreal with high urban densities (Ville-Marie, Plateau-Mont-Royal, Rosemont–La Petite Patrie, Villeray–Saint-Michel–Parc-Extension). Secondly, city blocks with the highest road traffic noise levels (quintile 5) are located near the highway network (highways 40, 15 and 20) and near the main traffic arteries crossing the Island of Montreal.
13 Figure 4. Location of advantaged and disadvantaged areas
We calculated Pearson correlation coefficients to compare the two indicators. We obtained a weak correlation value of 0.21 (P<0.0001) between the two indicators. At first sight, we might have expected a stronger correlation, as other studies on this topic have found higher values, but over smaller territories (Davies et al., 2009; Gan et al., 2012). Two main reasons may explain this lower correlation. First, the modes of propagation of road traffic noise and air pollution are different. Noise is at its highest near the source and diminishes considerably after encountering an obstacle, whether this is a row of buildings or a noise barrier (Forkenbrock and Schweitzer, 1999; Hokanson et al., 1981). In normal atmospheric and wind conditions, the concentrations of air pollutants from road traffic generated on major traffic arteries, such as NO2, are highest within a 30-metre radius (Morawska et al., 1999; Zhu et al., 2002a; Zhu et al., 2002b) and then gradually decline up to about 200 metres from the source (Brugge et al., 2007). Relatively high concentrations of air pollutants can thus be measured at a certain distance from the source, whereas the road traffic noise level is greatest at the immediate edge of the traffic artery, and then may abruptly diminish in the presence of obstacles. Secondly, the number of monitors used to measure NO2 concentrations was determined according to an attribution model based on, among other things, population density (Crouse et al., 2009a). This means that there are a smaller number of monitors in less densely inhabited sectors, such as the eastern and western ends of the Island of Montreal. When we look at the two maps in Figure 3, we see that city blocks in the western part of the study area are not in the same quintiles of air pollutants and road traffic noise. We can thus advance the hypothesis that the concentration of air pollutants could potentially have been underestimated and that some local variations
in this nuisance may not have been measured in areas located along highways in this part of the study territory due to the small number of monitors in these areas.
3.2 Location of disadvantaged and advantaged areas
Of the 7,456 city blocks comprising the study area, 460 are considered disadvantaged: that is, they are associated with the highest quintiles of both air pollution and road traffic noise. In most cases, these blocks are located less than 300 metres from a highway (highways 40, 15 and 25), at the intersection of several highways or along the main arterial and collector roads in the central boroughs (Villeray–Saint-Michel–Parc-Extension, Plateau Mont-Royal and Ville-Marie) spanning the Island of Montreal from north to south between Highway 40 and the south shore of the island. Conversely, 387 city blocks are seen as advantaged, as they are in the lowest quintiles of both air pollution and road traffic noise. Most of these city blocks are located in sectors of the Island of Montreal characterized by a large proportion of local streets and few major traffic arteries (the borough of Rivière-des-Prairies–Pointe-aux-Trembles and the western part of the borough of Ahuntsic–Cartierville). Disadvantaged and advantaged city blocks are shown in Figure 5.
15 3.3 Distribution of the groups studied in quintiles of the pollution indicators
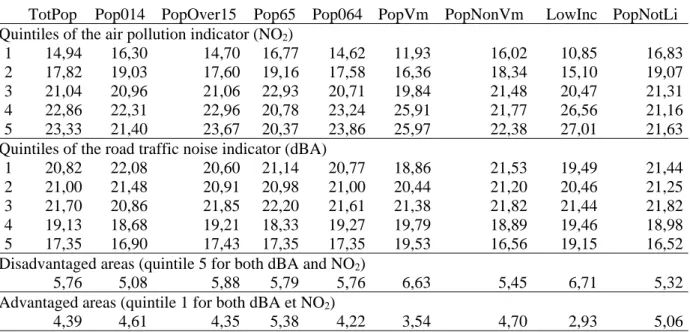
The 7,456 city blocks in the study area, with a combined population of 1,412,187 individuals, were first grouped into quintiles according to their NO2 concentration and road traffic noise level estimated in dB(A) (Table 1). The last part of this table shows the proportions of the groups living in areas considered as disadvantaged, that is, living in a block classified in the fifth quintile for the two nuisances, and the proportions of the groups living in advantaged areas, that is, living in a block classified in the first quintile for both nuisances.
Going back to the first two horizontal sections of Table 3, we see the distributions of the different groups under study by quintile of the NO2 pollution indicator and the road traffic noise indicator. The last two quintiles of air pollution include larger proportions of the total population than the first three quintiles. This can be explained by the fact that the NO2 concentration is highest in city blocks with the highest population density. Conversely, the two highest quintiles of road traffic noise are characterized by lower proportions of the total population than the first three. Road traffic noise levels in the highest quintiles are restricted to spaces along the main traffic arteries in the study area. The city blocks located along several major traffic arteries are very small in surface area and thus contain smaller numbers of people. Furthermore, 60% of city blocks in the last quintile of road traffic noise are inhabited by fewer than 150 people, whereas 60% of city blocks in the highest quintile of air pollution are inhabited by more than 150 people.
The distribution of the groups studied was then calculated for each quintile of air pollution and road traffic noise. First, low-income individuals and visible minorities are more strongly concentrated in the highest quintile of air pollution than is the population as a whole (27.01% and 25.97% respectively, compared with 23.33%). In this same quintile, persons under 15 years of age and people over 65 years old are represented in lower proportions (21.40% and 20.37%, versus 23.33%). The situation is more or less the same for road traffic noise, as there are higher proportions of low-income individuals and visible minorities than of the population as a whole in the last quintile (19.15% and 19.53% respectively, versus 17.35%). Conversely, the under 15 age group is found in a lower proportion in the last quintile than the population as a whole (16.90% versus 17.35%), whereas people aged 65 and over are present in the same proportion as the population as a whole (17.35% for both).
For city blocks in the fifth quintile for both the NO2 indicator and the noise pollution indicator, we then calculated the proportions of the different groups living there. This was also done for blocks in the first quintile for the two pollution indicators. As was the case with both nuisances, low-income individuals and visible minorities in the study area are relatively more concentrated in disadvantaged
areas (6.71% and 6.63% respectively, compared with 5.76% for the population as a whole). Children under age 15 are found in a lower proportion, whereas the concentration of people aged 65 and over is very slightly greater (5.08% and 5.79%, versus 5.76%). Finally, the proportions of young people under age 15 and individuals aged 65 and over are higher in advantaged sectors (4.61% and 5.38% respectively, versus 4.39%). On the other hand, there are far lower proportions of low-income individuals and visible minorities in advantaged areas (2.93% and 3.54% respectively, versus 4.39%).
Table 3. Distribution (%) of population groups in block quintiles of the two pollution indicators
TotPop Pop014 PopOver15 Pop65 Pop064 PopVm PopNonVm LowInc PopNotLi Quintiles of the air pollution indicator (NO2)
1 14,94 16,30 14,70 16,77 14,62 11,93 16,02 10,85 16,83 2 17,82 19,03 17,60 19,16 17,58 16,36 18,34 15,10 19,07 3 21,04 20,96 21,06 22,93 20,71 19,84 21,48 20,47 21,31 4 22,86 22,31 22,96 20,78 23,24 25,91 21,77 26,56 21,16 5 23,33 21,40 23,67 20,37 23,86 25,97 22,38 27,01 21,63 Quintiles of the road traffic noise indicator (dBA)
1 20,82 22,08 20,60 21,14 20,77 18,86 21,53 19,49 21,44 2 21,00 21,48 20,91 20,98 21,00 20,44 21,20 20,46 21,25 3 21,70 20,86 21,85 22,20 21,61 21,38 21,82 21,44 21,82 4 19,13 18,68 19,21 18,33 19,27 19,79 18,89 19,46 18,98 5 17,35 16,90 17,43 17,35 17,35 19,53 16,56 19,15 16,52 Disadvantaged areas (quintile 5 for both dBA and NO2)
5,76 5,08 5,88 5,79 5,76 6,63 5,45 6,71 5,32 Advantaged areas (quintile 1 for both dBA et NO2)
4,39 4,61 4,35 5,38 4,22 3,54 4,70 2,93 5,06 TotPop: Total population; Pop014: Population aged 0 to 14; PopOver15: Population aged 15 and over; Pop65: Population aged 65 and over; Pop64: Population aged 0 to 64; PopVm: Population of visible minorities; PopNotVm: Population of persons not members of a visible minority; LowInc: Low-income individuals before income taxes; PopNotLi: Persons above the poverty threshold before income taxes.
3.4 Using the indicators to identify environmental inequities for the four groups
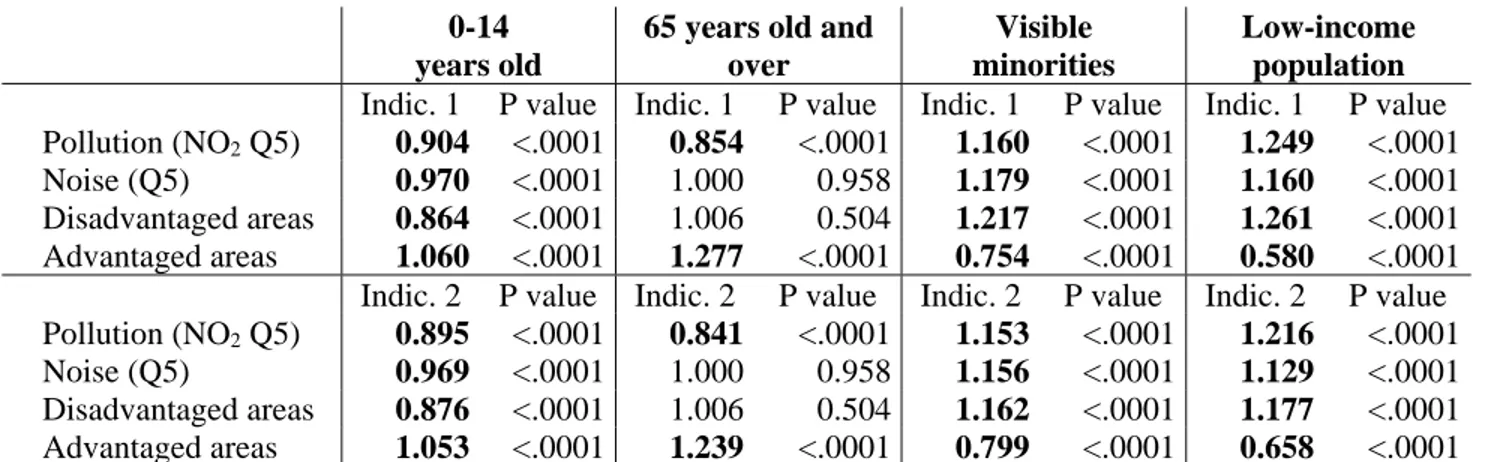
In this section, we present the results of the calculations of the two types of environmental equity indicators for the population groups under consideration. These results will enable us to quickly determine whether any of the four groups are overrepresented in disadvantaged or advantaged areas. The results shown in Table 4 indicate that individuals under 15 years old are significantly underrepresented in the highest quintiles of both air pollution (indicator 1 = 0.904, P<.0001; indicator 2 = 0.895, P<.0001) and road traffic noise (indicator 1 = 0.970, P<.0001; indicator 2 = 0.969, P<.0001), as well as in disadvantaged areas, whether compared with people over age 15 (indicator 1 = 0.864, P<.0001) or compared with their presence in the rest of the study area (indicator 2 = 0.876, P<.0001). Next, young people under age 15 are slightly more present in residential areas where nuisance levels are lowest,
17
compared with individuals aged 15 and over (indicator 1 = 1.060, P<.0001), and also compared with their presence in the rest of the study area (indicator 2 = 1.053, P<.0001). So the situation appears to be rather favourable for people under 15 years of age.
The situation also seems to be beneficial for individuals aged 65 and over, but to a lesser degree. These individuals are in fact less present in areas with high concentrations of NO2 (indicator 1 = 0.854, P<.0001; indicator 2 = 0.841, P<.0001) and more present in areas with low levels of air pollution and noise (indicator 1 = 1.277, P<.0001; indicator 2 = 1.239, P<.0001). On the other hand, the indicators are not significant for areas with the highest road traffic noise or for disadvantaged areas.
For their part, visible minorities and low-income individuals are significantly overrepresented in the areas most polluted by NO2 (indicator 1 = 1.160 and 1.249, P<.0001; indicator 2 = 1.153 and 1.216, P<.0001), in the noisiest areas (indicator 1 = 1.179 and 1.160, P<.0001; indicator 2 = 1.156 and 1.129, P<.0001) and in disadvantaged areas (indicator 1 = 1.217 and 1.261, P<.0001; indicator 2 = 1.162 and 1.177, P<.0001). Conversely, these two groups are underrepresented in areas with both low air pollution and low noise levels (indicator 1 = 0.754 and 0.580, P<.0001; indicator 2 = 0.799 and 0.658, P<.0001). So there seems to be a situation of environmental inequity for these two groups, from the perspective of the concentration of air pollution, the level of road traffic noise, and the cumulative effect of these two nuisances.
Table 4. Indicators of representation of the groups under study in the highest quintiles of air pollution and road traffic noise and in disadvantaged and advantaged areas
0-14 years old
65 years old and over
Visible minorities
Low-income population
Indic. 1 P value Indic. 1 P value Indic. 1 P value Indic. 1 P value Pollution (NO2 Q5) 0.904 <.0001 0.854 <.0001 1.160 <.0001 1.249 <.0001
Noise (Q5) 0.970 <.0001 1.000 0.958 1.179 <.0001 1.160 <.0001 Disadvantaged areas 0.864 <.0001 1.006 0.504 1.217 <.0001 1.261 <.0001 Advantaged areas 1.060 <.0001 1.277 <.0001 0.754 <.0001 0.580 <.0001 Indic. 2 P value Indic. 2 P value Indic. 2 P value Indic. 2 P value Pollution (NO2 Q5) 0.895 <.0001 0.841 <.0001 1.153 <.0001 1.216 <.0001
Noise (Q5) 0.969 <.0001 1.000 0.958 1.156 <.0001 1.129 <.0001 Disadvantaged areas 0.876 <.0001 1.006 0.504 1.162 <.0001 1.177 <.0001 Advantaged areas 1.053 <.0001 1.239 <.0001 0.799 <.0001 0.658 <.0001 Indic. 1: Indicator 1 Indic. 2: Indicator 2
P value indicates that the null hypothesis of equal proportions can be rejected and that the proportions are unequal.
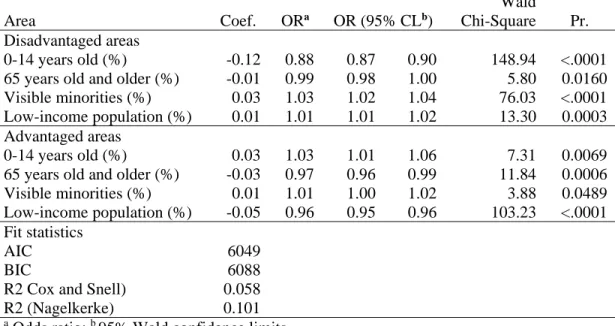
3.5 Using multinomial logistic regression to confirm environmental inequities for the four groups The multinomial logistic model was built by using the city blocks not included in disadvantaged or advantaged areas as the reference category. This model can then be used to estimate the probability (odds ratios) of a city block being located in disadvantaged or advantaged areas with each increase in a unit of percentage of one of the four groups (after controlling for the percentages of the other groups). The results of this model are shown in Table 5.
The results of the multinomial logistic model (Table 5) corroborate the findings of the analyses previously conducted using the two indicators. On the one hand, the proportion of young people is negatively and significantly associated with the probability of their living in a city block located in a disadvantaged area (OR = 0.87, P<.0001). Conversely, the proportions of visible minorities and low-income individuals are positively and significantly associated with the likelihood of their living in a city block located in a disadvantaged area (OR = 1.03, P<.0001 and OR = 1.01, P = 0003 respectively). On the other hand, the proportion of people under 15 years of age is a significant predictor of their living in a city block in an advantaged area (OR = 1.03, P = 0.0069). As for the two-sample test of proportions, the proportions of low-income individuals (OR = 0.96, P<.0001) are underrepresented in the advantaged areas. However, contrary to the previous bivariate results, people aged 65 and over (OR = 0.97, P = 0.0006) are negatively and significantly associated with their living in an advantaged area.
Table 5. Multinomial logistic regression (dependent variable: types of areas according to the levels of noise and air pollution)
Area Coef. ORa OR (95% CLb)
Wald
Chi-Square Pr. Disadvantaged areas
0-14 years old (%) -0.12 0.88 0.87 0.90 148.94 <.0001 65 years old and older (%) -0.01 0.99 0.98 1.00 5.80 0.0160 Visible minorities (%) 0.03 1.03 1.02 1.04 76.03 <.0001 Low-income population (%) 0.01 1.01 1.01 1.02 13.30 0.0003 Advantaged areas
0-14 years old (%) 0.03 1.03 1.01 1.06 7.31 0.0069 65 years old and older (%) -0.03 0.97 0.96 0.99 11.84 0.0006 Visible minorities (%) 0.01 1.01 1.00 1.02 3.88 0.0489 Low-income population (%) -0.05 0.96 0.95 0.96 103.23 <.0001 Fit statistics
AIC 6049 BIC 6088 R2 Cox and Snell) 0.058
R2 (Nagelkerke) 0.101
a
19 4. Discussion
4.1 Overview of the results of the environmental equity assessment
In light of the results, individuals under 15 years of age enjoy a favourable situation from every point of view. For their part, people over age 65 are underrepresented in disadvantaged areas after controlling for the other explanatory variables. Conversely, visible minorities and low-income individuals are overrepresented in disadvantaged areas. These findings are in line with those of earlier studies conducted on the Island of Montreal regarding air pollution (Carrier et al., 2014; Crouse et al., 2009b) and road traffic noise (Carrier et al. 2016). As for the values obtained for the environmental equity indicators, the results of the case under study here for low-income individuals and visible minorities are nonetheless substantially lower than those reported by Chakraborty (2006) in the context of his study in a Florida county.
It should be noted that, however, two values significantly differ from the multinomial logistic regression in comparison to the results previously obtained from the two-sample proportions test. Firstly, the people over age 65 are underrepresented in the advantageous areas. Secondly, the visible minorities are overrepresented in the advantageous areas. For the last case, it signifies that visible minorities are positively and significantly associated with the likelihood of their living in a city block located in an advantaged area after controlling for the independent effects of the other explanatory variables. The differences that we have obtained between the two-sample test of proportions and the multinomial logistic regression show the importance to use more rigorous inferential statistical to complement the descriptive analysis and compare the significant predictors of disproportionate exposure to both air pollution and road traffic noise. The importance to control for the independent effects of the other explanatory variables have been recently raised in a few studies on environmental equity in terms of road traffic noise (Carrier et al., 2016), air pollution (Chakraborty, 2009; Carrier et al., 2014) and the presence of urban vegetation (Pham et al., 2013; Pham et al., 2012).
Globally, the environmental equity assessment reached in the Montreal context is in part explained by the social geography of the four groups examined and the location of the main traffic arteries on the Island of Montreal. To begin with, it is not surprising that the low-income population and, to a lesser extent, visible minorities are overrepresented in the disadvantaged areas as they have been largely concentrated in Montreal’s central neighbourhoods for many decades (Apparicio and Seguin, 2006). These spaces are above all characterized by higher road density, residential density, the diversity of urban functions, and the greater concentration and lengths of collector roads, arteries, expressways, and
highways. These neighbourhoods are also characterized by a large concentration of sections of highway with traffic flows of more than 100,000 vehicles a day, and are crossed by a number of arterial and collector roads, all of which link up the Island of Montreal’s major poles of attraction and provide access to the bridges and the metropolitan area’s main suburban municipalities. More than half of the city blocks in the category of the disadvantaged areas that are the focus of this analysis are in fact located in a sector bound by highways 15 (Décarie), 40 (Metropolitan), 25 and 720, which more or less corresponds to the central boroughs of the Island of Montreal. So the geography of road transportation and the location of this group in the centre of the Island of Montreal explain, in part at least, the higher concentration of pollutants for this group (Carrier et al., 2014).
Next, data from the 2006 Statistics Canada census indicate that disadvantaged sectors in the study area are largely comprised of rental buildings where the average monthly rent is less than $650, compared with an average of $685 for monthly residential rentals across the Island of Montreal (Statistique Canada, 2006). The study by Sénécal et al. (2000) also shows that buildings located near urban expressways on the Island of Montreal, especially the Metropolitan and Décarie expressways, are mostly lower-value rental residential dwellings such as “walk-ups”2 (Moretti et al., 2004) or consist of large concentrations of low-income housing (social housing). Other research has moreover found that high road traffic noise levels (Brandt and Maennig, 2011; Kim et al., 2007; Theebe, 2004; Wilhelmsson, 2000) and the high concentration of various air pollutants (Bayer et al., 2009; Smith and Huang, 1995) have negative impacts on rental values. We can thus propose the hypothesis that the values of rents in the residential buildings largely characterizing the disadvantaged sectors of the study area may be negatively influenced by the cumulative effect of the nuisances, and consequently attract lower-income individuals.
As for young people aged 15 and under, they are significantly less present in disadvantaged areas, with a high proportion living in urban environments where there are more local streets and fewer major traffic arteries. Since the 1950s, the proportion of under-15-year-olds has substantially declined in the central boroughs of the Island of Montreal, sectors where disadvantaged residential spaces predominate, whereas their presence has considerably increased in the lower-density Montreal Island suburbs (Apparicio et al., 2010). Finally, people aged 65 and over living on the Island of Montreal are not overrepresented in disadvantaged areas. This can be explained by the fact that the distribution of individuals over age 65 in Montreal from 1981 to 2006 was marked by a process of decentralization (Séguin et al., 2013). In other words, older people are becoming more and more dispersed over the
2 A walk-up is a collective residential building without an elevator, usually no more than three stories high, and with no
21
territory of the island and, especially, are increasingly present in the first-ring suburbs, where there are very few disadvantaged areas.
4.2 Potential repercussions in terms of government interventions and public policies
Some solutions have been highlighted in the literature to reduce the levels of pollutant emissions in residential areas located near major traffic arteries. First, the U.S. highway transportation agency, the Federal Highway Administration (FHWA), has suggested identifying uses compatible with proximity to a highway (FHWA, 2002). The FHWA notes that the planning of industrial, commercial or institutional uses should be given preference along highways, as these uses can be considered to constitute a transition zone that captures a large portion of the intensity of the nuisances generated by major traffic arteries (FHWA, 2002). The FHWA also recommends developing green spaces between highways and residential areas to mitigate nuisances. Approaches of this kind could thus be prioritized in disadvantaged sectors in the study area.
The disadvantaged areas concerned are in most cases located near a section of highway or along major traffic arteries that converge toward an even busier section of highway. It would therefore be relevant to set up mitigation measures such as noise barriers, green buffers or any other measure fostering a decrease in the levels of air pollutants and road traffic noise in the residential spaces targeted. However, the configuration of the main highway sections on the Island of Montreal represents an important limitation in this regard. These sections of highway are linked to service roads and to a series of zones of convergence and divergence that act as highway access and exit areas. However, from the viewpoint of road safety, it is vital that feeder roads leading onto the highway be long enough, which in many cases limits the feasibility of some of the interventions designed to reduce nuisances.
In Québec, the provincial legislation governing land use planning and development, the Loi sur
l’aménagement et l’urbanisme, stipulates that the RCMs’3 land use and development plans must “identify the thoroughfares whose present or planned presence in a place results in land occupation near this place being subject to major restrictions for reasons of public safety, public health or general welfare” (Government of Quebec, 2013). In their planning bylaws, municipalities must therefore regulate areas subject to high concentrations of nuisances for reasons of public safety or public health and welfare. In these areas, they must provide for certain categories of land uses, structures or cadastral operations. To this effect, the Montreal Metropolitan Community (MMC)’s master plan, adopted in 2011, specifies that measures should be implemented to ensure a harmonious coexistence of uses through a normative
approach, in order to minimize the impact of road transportation-related nuisances as much as possible (Government of Quebec, 2013). One of the anticipated actions to be taken would be to control future development along major traffic arteries. For example, all Québec municipalities would be obliged to prohibit uses deemed to be sensitive to pollutant emissions less than 200 metres from an artery where there is a daily traffic flow of more than 40,000 vehicles,4 such as schools, hospitals, childcare centres, seniors’ residences and other residential uses. With such a normative approach, it would thus be possible to minimize the negative effects of transportation on the health and well-being of the population groups most vulnerable to noise and air pollution.
Finally, the solutions proposed above in this paper involve the scale of the Island of Montreal. However, it should be remembered that only 460 city blocks in the study area are characterized by high concentrations of traffic-related pollutants. Possible actions could be targeted in municipal land use policies to further mitigate the consequences of traffic in these city blocks. For example, investments could be made in planting trees and carrying out greening measures in available spaces in these 460 city blocks. These actions would be beneficial in, among other things, helping to reduce noise pollution, to absorb a portion of the effect of pollutant emissions and to eventually provide a more effective visual barrier (Akbari et al., 2001).
5. Conclusion
The results of the analysis have shown that low-income individuals and visible minorities in the study area are more likely to live in city blocks that are considered disadvantaged than is the general population. Additionally, individuals under 15 years of age tend to live in areas with the lowest exposures to these risks, as compared with individuals in other age groups. Various elements may help to explain these results: the social geography of the study area, the location of the major traffic arteries, and rental values near some major traffic arteries. We have also shown that diagnoses of environmental equity relating to the traffic-related pollutants vary from one statistic technique to another. According to numerous authors (Bowen, 2002; Walker, 2009), it is essential to accurately measure a studied phenomenon in order to properly assess health risks for targeted groups.
A number of solutions were then mentioned to reduce the concentrations of pollutant emissions from road transportation in residential areas. In the Montreal context, one possible solution is to use urban planning tools to better control land use and development along major traffic arteries. The systematic
23
employment of these tools could thus enable planners to prohibit the development of new residential projects or any other incompatible uses in areas with high concentrations of pollutant emissions from road transportation. Another way of decreasing the levels of pollutant emissions would be to reduce the number of vehicles travelling on the main road network on the Island of Montreal. Several ways of accomplishing this have been identified in the literature, such as allocating increased funding for public transit, creating incentives to reduce the number of vehicles in central city sectors, setting up reserved carpool lanes during rush hours and developing programs with employers to encourage teleworking. However, putting any of these measures into practice requires that a consensus be reached between a number of actors from various sectors, such as, among others, planning departments in the MMC and the cities that comprise it, including the City of Montreal, the Québec transportation department, the Société de transport de Montréal (Montreal transit authority), the Agence métropolitaine de transport, and public health experts. Finally, the findings of this study also suggest identifying priority locations that should be targeted in municipal land use policies in order to reduce traffic-related pollutant emissions.
The analyses performed in this article also open up new research avenues. This study focused on estimated levels of pollutants in the central portion of the Island of Montreal. Some studies have recently examined individual exposure to air pollution and road traffic noise. It would thus be relevant to use monitors to measure the exposure of individuals living in disadvantaged areas in order to precisely determine whether the latter are potentially exposed to levels of pollutant emissions that exceed the tolerance thresholds set by public health authorities. Once the measures of exposure have been obtained, it would also be interesting to link them to health data.
References
Akbari, H., Pomerantz, M., Taha, H., 2001. Cool surfaces and shade trees to reduce energy use and improve air quality in urban areas. Solar Energy 70(3), 295-310.
Allen, R.W., Davies, H., Cohen, M.A., Mallach, G., Kaufman, J.D., Adar, S.D., 2009. The spatial relationship between traffic-generated air pollution and noise in 2 US cities. Environmental Research 109(3), 334-342.
Apparicio, P., Cloutier, M., Séguin, A., Ades, J., 2010. Accessibilité spatiale aux parcs urbains pour les enfants et injustice environnementale. Exploration du cas montréalais. Revue internationale de
géomatique 20(3), 363-389.
Babisch, W., 2008. Road traffic noise and cardiovascular risk. Noise and Health 10(38), 27.
Bae, C.-H.C., Sandlin, G., Bassok, A., Kim, S., 2007. The exposure of disadvantaged populations in freeway air-pollution sheds: a case study of the Seattle and Portland regions. Environment and Planning
B: Planning and Design 34(1), 154.
Barros, N., Fontes, T., Silva, M., Manso, M., 2013. How wide should be the adjacent area to an urban motorway to prevent potential health impacts from traffic emissions? Transportation Research Part A:
Policy and Practice 50, 113-128.
Bayer, P., Keohane, N., Timmins, C., 2009. Migration and hedonic valuation: The case of air quality.
Journal of Environmental Economics and Management 58(1), 1-14.
Bluhm, G., Berglind, N., Nordling, E., Rosenlund, M., 2007. Road traffic noise and hypertension.
Occupational and Environmental Medicine 64(2), 122-126.
Bluhm, G., Nordling, E., Berglind, N., 2004. Road traffic noise and annoyance-An increasing environmental health problem. Noise and Health 6(24), 43.
Bocquier, A., Cortaredona, S., Boutin, C., David, A., Bigot, A., Chaix, B., Gaudart, J., Verger, P., 2012. Small-area analysis of social inequalities in residential exposure to road traffic noise in Marseilles, France. The European Journal of Public Health, cks059.
Bolte, G., Tamburlini, G., Kohlhuber, M., 2010. Environmental inequalities among children in Europe— evaluation of scientific evidence and policy implications. The European Journal of Public Health 20(1), 14-20.
Bowen, William M. 2002. « An analytical review of environmental justice research: what do we really know? » Environmental Management 29 (1), 3-15.
Brainard, J.S., Bateman, I., Lovett, A., Fallon, P., 2002. Modelling environmental equity: access to air quality in Birmingham, England. Environment and Planning A 34(4), 695-716.
Brainard, J.S., Jones, A.P., Bateman, I.J., Lovett, A.A., 2004. Exposure to environmental urban noise pollution in Birmingham, UK. Urban Studies 41(13), 2581-2600.
Brandt, S., Maennig, W., 2011. Road noise exposure and residential property prices: Evidence from Hamburg. Transportation Research Part D: Transport and Environment 16(1), 23-30.
Briggs, D., Abellan, J.J., Fecht, D., 2008. Environmental inequity in England: small area associations between socio-economic status and environmental pollution. Social Science & Medicine 67(10), 1612-1629.
Brugge, D., Durant, J.L., Rioux, C., 2007. Near-highway pollutants in motor vehicle exhaust: a review of epidemiologic evidence of cardiac and pulmonary health risks. Environmental Health 6(1), 23.
25
Carrier, M., Apparicio, P., Séguin, A.-M., 2016. Road traffic noise in Montreal and environmental equity: What is the situation for the most vulnerable population groups? Journal of Transport Geography, 51, 1-8.
Carrier, M., Apparicio, P., Séguin, A.-M., Crouse, D., 2014. The application of three methods to measure the statistical association between different social groups and the concentration of air pollutants in Montreal: A case of environmental equity. Transportation Research Part D: Transport and Environment 30, 38-52.
Carrier, M., Séguin, A.-M., Apparicio, P., Crouse, D., 2013. Les résidences pour personnes âgées de l’île de Montréal appartenant aux parcs social et privé: une exposition inéquitable à la pollution de l’air?
Cahiers de Géographie du Québec 57(161), 239-256.
Chakraborty, J., 2006. Evaluating the environmental justice impacts of transportation improvement projects in the US. Transportation Research Part D: Transport and Environment 11(5), 315-323. Chakraborty, J., 2009. Automobiles, air toxics, and adverse health risks: Environmental inequities in Tampa Bay, Florida. Annals of the Association of American Geographers 99(4), 674-697.
Chakraborty, J., Schweitzer, L.A., Forkenbrock, D.J., 1999. Using GIS to assess the environmental justice consequences of transportation system changes. Transactions in GIS 3(3), 239-258.
Collins, T.W., Grineski, S.E., Chakraborty, J., McDonald, Y.J., 2011. Understanding environmental health inequalities through comparative intracategorical analysis: Racial/ethnic disparities in cancer risks from air toxics in El Paso County, Texas. Health & Place 17(1), 335-344.
Crouse, D.L., Goldberg, M.S., Ross, N.A., 2009a. A prediction-based approach to modelling temporal and spatial variability of traffic-related air pollution in Montreal, Canada. Atmospheric Environment 43(32), 5075-5084.
Crouse, D.L., Ross, N.A., Goldberg, M.S., 2009b. Double burden of deprivation and high concentrations of ambient air pollution at the neighbourhood scale in Montreal, Canada. Social Science & Medicine 69(6), 971-981.
Davies, H.W., Vlaanderen, J., Henderson, S., Brauer, M., 2009. Correlation between co-exposures to noise and air pollution from traffic sources. Occupational and Environmental Medicine 66(5), 347-350. Day, R., 2008. Local Urban Environments and the Wellbeing of Older People, In: Justice, S.C.f.R.o.S. (Ed.). University of Birmingham.
Day, R., 2010. Environmental justice and older age: consideration of a qualitative neighbourhood-based study. Environment and Planning. A 42(11), 2658.
English, P., Neutra, R., Scalf, R., Sullivan, M., Waller, L., Zhu, L., 1999. Examining associations between childhood asthma and traffic flow using a geographic information system. Environmental
Health Perspectives 107(9), 761.
Evans, G.W., Kantrowitz, E., 2002. Socioeconomic status and health: the potential role of environmental risk exposure. Annual Review of Public Health 23(1), 303-331.
Evans, G.W., Lercher, P., Meis, M., Ising, H., Kofler, W.W., 2001. Community noise exposure and stress in children. The Journal of the Acoustical Society of America 109(3), 1023-1027.
FHWA, 2002. Entering the quiet zone : Noise compatible and land use planning
Foraster, M., Deltell, A., Basagaña, X., Medina-Ramón, M., Aguilera, I., Bouso, L., Grau, M., Phuleria, H.C., Rivera, M., Slama, R., 2011. Local determinants of road traffic noise levels versus determinants of air pollution levels in a Mediterranean city. Environmental Research 111(1), 177-183.
Forkenbrock, D., Schweitzer, L., 1999. Environmental justice in transportation planning. Journal of the
American Planning Association 65(1), 96-112.
Gan, W.Q., Davies, H.W., Koehoorn, M., Brauer, M., 2012. Association of long-term exposure to community noise and traffic-related air pollution with coronary heart disease mortality. American
Journal of Epidemiology 175(9), 898-906.
Gauderman, W.J., Vora, H., McConnell, R., Berhane, K., Gilliland, F., Thomas, D., Lurmann, F., Avol, E., Kunzli, N., Jerrett, M., 2007. Effect of exposure to traffic on lung development from 10 to 18 years of age: a cohort study. The Lancet 369(9561), 571-577.
Geurs, K.T., Boon, W., Van Wee, B., 2009. Social impacts of transport: literature review and the state of the practice of transport appraisal in the Netherlands and the United Kingdom. Transport Reviews 29(1), 69-90.
Government of Quebec, 2013. Loi sur l'aménagement et l'urbanisme. Gazette officielle du Québec. Green, R.S., Smorodinsky, S., Kim, J.J., McLaughlin, R., Ostro, B., 2004. Proximity of California public schools to busy roads. Environmental Health Perspectives 112(1), 61.
Greenberg, M., 1993. Proving environmental inequity in siting locally unwanted land uses. Risk 4, 235. Grineski, S.E., 2007. Incorporating health outcomes into environmental justice research: The case of children's asthma and air pollution in Phoenix, Arizona. Environmental Hazards 7(4), 360-371.
Gunier, R.B., Hertz, A., Von Behren, J., Reynolds, P., 2003. Traffic density in California: socioeconomic and ethnic differences among potentially exposed children. Journal of Exposure Science and
Environmental Epidemiology 13(3), 240-246.
Havard, S., Deguen, S., Zmirou-Navier, D., Schillinger, C., Bard, D., 2009. Traffic-related air pollution and socioeconomic status: a spatial autocorrelation study to assess environmental equity on a small-area scale. Epidemiology 20(2), 223-230.
Havard, S., Reich, B.J., Bean, K., Chaix, B., 2011. Social inequalities in residential exposure to road traffic noise: an environmental justice analysis based on the RECORD Cohort Study. Occupational and
Environmental Medicine 68(5), 366-374.
Hoffmann, B., Kolahgar, B., Rauchfuss, K., Eberwein, G., Franzen-Reuter, I., Kraft, M., Wilhelm, M., Ranft, U., Jöckel, K.-H., 2009. Childhood social position and associations between environmental exposures and health outcomes. International Journal of Hygiene and Environmental Health 212(2), 146-156.
Hokanson, B., Minkoff, M., Nichols, S., Cowart, S., 1981. Measures of noise damage costs attributable to motor vehicle travel.
Houston, D., Ong, P., Wu, J., Winer, A., 2006. Proximity of licensed child care facilities to near-roadway vehicle pollution. American Journal of Public Health 96(9), 1611-1617.
Houston, D., Wu, J., Ong, P., Winer, A., 2004. Structural disparities of urban traffic in southern California: Implications for vehicle‐related air pollution exposure in minority and high‐poverty neighborhoods. Journal of Urban Affairs 26(5), 565-592.
Jacobson, J.O., Hengartner, N.W., Louis, T.A., 2004. Inequity measures for evaluations of environmental justice: a case study of close proximity to highways in NYC, Environment and Planning A, 37(1), 21-43.
27
Jerrett, M., Arain, A., Kanaroglou, P., Beckerman, B., Potoglou, D., Sahsuvaroglu, T., Morrison, J., Giovis, C., 2004. A review and evaluation of intraurban air pollution exposure models. Journal of
Exposure Science and Environmental Epidemiology 15(2), 185-204.
Jerrett, M., Arain, M., Kanaroglou, P., Beckerman, B., Crouse, D., Gilbert, N., Brook, J., Finkelstein, N., Finkelstein, M., 2007. Modeling the intraurban variability of ambient traffic pollution in Toronto, Canada. Journal of Toxicology and Environmental Health, Part A 70(3-4), 200-212.
Jerrett, M., Shankardass, K., Berhane, K., Gauderman, W.J., Künzli, N., Avol, E., Gilliland, F., Lurmann, F., Molitor, J.N., Molitor, J.T., 2008. Traffic-related air pollution and asthma onset in children: a prospective cohort study with individual exposure measurement. Environmental Health Perspectives 116(10), 1433-1438.
Kan, H., Heiss, G., Rose, K.M., Whitsel, E.A., Lurmann, F., London, S.J., 2008. Prospective analysis of traffic exposure as a risk factor for incident coronary heart disease: the Atherosclerosis Risk in Communities (ARIC) study. Environmental Health Perspectives 116(11), 1463-1468.
Kelly, F., Dunster, C., Mudway, I., 2003. Air pollution and the elderly: oxidant/antioxidant issues worth consideration. European Respiratory Journal 21(40), 70-75.
Kim, K.S., Park, S.J., Kweon, Y.-J., 2007. Highway traffic noise effects on land price in an urban area.
Transportation Research Part D: Transport and Environment 12(4), 275-280.
King, E.A., Murphy, E., Rice, H.J., 2011. Implementation of the EU environmental noise directive: lessons from the first phase of strategic noise mapping and action planning in Ireland. Journal of
environmental management 92(3), 756-764.
King, N., Morency, P., Lapierre, L. 2005. Les impacts du transport sur la santé publique, Synthese report, Direction de la santé publique, 5 p.
Kingham, S., Pearce, J., Zawar-Reza, P., 2007. Driven to injustice? Environmental justice and vehicle pollution in Christchurch, New Zealand. Transportation Research Part D: Transport and Environment 12(4), 254-263.
Kruize, H., Driessen, P.P., Glasbergen, P., van Egmond, K.N., 2007. Environmental equity and the role of public policy: experiences in the Rijnmond region. Environmental management 40(4), 578-595. Lam, K.-c., Chan, P.-K., 2006. Socio-economic status and inequalities in exposure to transportation noise in Hong Kong. Transportation, 107-113.
Landrigan, P.J., Kimmel, C.A., Correa, A., Eskenazi, B., 2004. Children's health and the environment: public health issues and challenges for risk assessment. Environmental Health Perspectives 112(2), 257. Liu, F., 2001. Equity analysis of transportation systems, projects, plans, and policies, In: Publishers, L. (Ed.), Environmental Justice Analysis: Theories, Methods, and Practice, New York.
McConnell, R., Berhane, K., Yao, L., Jerrett, M., Lurmann, F., Gilliland, F., Künzli, N., Gauderman, J., Avol, E., Thomas, D., 2006. Traffic, susceptibility, and childhood asthma. Environmental Health
Perspectives, 766-772.
Mitchell, G., 2005. Forecasting environmental equity: Air quality responses to road user charging in Leeds, UK. Journal of Environmental Management 77(3), 212-226.
Mitchell, G., Dorling, D., 2003. An environmental justice analysis of British air quality. Environment
Morawska, L., Thomas, S., Gilbert, D., Greenaway, C., Rijnders, E., 1999. A study of the horizontal and vertical profile of submicrometer particles in relation to a busy road. Atmospheric Environment 33(8), 1261-1274.
Moretti, G., Vachon, G., Despres, C., 2004. Les immeubles locatifs de type walk-up de la première couronne de banlieue de Québec, In: Service de l’Aménagement du territoire, V.d.Q. (Ed.), p. 96. Moudon, A.V., 2009. Real noise from the urban environment: how ambient community noise affects health and what can be done about it. American Journal of Preventive Medicine 37(2), 167-171.
Murphy, E., King, E.A., 2010. Strategic environmental noise mapping: Methodological issues concerning the implementation of the EU Environmental Noise Directive and their policy implications.
Environment International 36(3), 290-298.
Næss, Ø., Nafstad, P., Aamodt, G., Claussen, B., Rosland, P., 2007. Relation between concentration of air pollution and cause-specific mortality: four-year exposures to nitrogen dioxide and particulate matter pollutants in 470 neighborhoods in Oslo, Norway. American Journal of Epidemiology 165(4), 435-443. Namdeo, A., Stringer, C., 2008. Investigating the relationship between air pollution, health and social deprivation in Leeds, UK. Environment International 34(5), 585-591.
Nega, T.H., Chihara, L., Smith, K., Jayaraman, M., 2013. Traffic Noise and Inequality in the Twin Cities, Minnesota. Human and Ecological Risk Assessment: An International Journal 19(3), 601-619.
Öhrström, E., Skånberg, A., 2004. Sleep disturbances from road traffic and ventilation noise—laboratory and field experiments. Journal of Sound and Vibration 271(1), 279-296.
OMS, 2007. Global Age-friendly Cities: A guide, In: Organization, W.H. (Ed.), Ageing and Life Course,
Family and Community Health p. 82.
Pearce, J., Richardson, E.A., Mitchell, R.J., Shortt, N.K., 2010. Environmental justice and health: the implications of the socio‐spatial distribution of multiple environmental deprivation for health inequalities in the United Kingdom. Transactions of the Institute of British Geographers 35(4), 522-539.
Pham, Thi-Thanh-Hien, Philippe Apparicio, Shawn Landry, Anne-Marie Séguin et Martin Gagnon. 2013. Predictors of the distribution of street and backyard vegetation in Montreal, Canada. Urban
Forestry & Urban Greening 12 (1): 18-27.
Pham, T.-T.-H., Apparicio, P., Séguin, A.-M., Landry, S., Gagnon, M., 2012. Spatial distribution of vegetation in Montreal: An uneven distribution or environmental inequity? Landscape and Urban
Planning 107(3), 214-224.
Philipps, D., Siu, O.-L., Yeh, A., Cheng, K., 2005. Ageing and the urban environment, In: Routledge (Ed.), Ageing and Place: Perspectives, policy, practice, pp. 147-163.
Rioux, C.L., Gute, D.M., Brugge, D., Peterson, S., Parmenter, B., 2010. Characterizing urban traffic exposures using transportation planning tools: an illustrated methodology for health researchers. Journal
of Urban Health 87(2), 167-188.
Rotko, T., Koistinen, K., Haenninen, O., Jantunen, M., 1999. Sociodemographic descriptors of personal exposure to fine particles (PM2. 5) in EXPOLIS Helsinki. Journal of Exposure Analysis and
Environmental Epidemiology 10(4), 385-393.
SAS Institute Inc. 2009 SAS version 9.3. Cary, NC, USA.
Schikowski, T., Sugiri, D., Reimann, V., Pesch, B., Ranft, U., Krämer, U., 2008. Contribution of smoking and air pollution exposure in urban areas to social differences in respiratory health. BMC Public Health 8(1), 179.