HAL Id: hal-00302879
https://hal.archives-ouvertes.fr/hal-00302879
Submitted on 19 Jun 2007HAL is a multi-disciplinary open access
archive for the deposit and dissemination of sci-entific research documents, whether they are pub-lished or not. The documents may come from teaching and research institutions in France or abroad, or from public or private research centers.
L’archive ouverte pluridisciplinaire HAL, est destinée au dépôt et à la diffusion de documents scientifiques de niveau recherche, publiés ou non, émanant des établissements d’enseignement et de recherche français ou étrangers, des laboratoires publics ou privés.
A new comprehensive approach to characterizing
carbonaceous aerosol with an application to wintertime
Fresno, California PM2.5
P. Herckes, J. A. Leenheer, J. L. Collett Jr.
To cite this version:
P. Herckes, J. A. Leenheer, J. L. Collett Jr.. A new comprehensive approach to characterizing carbona-ceous aerosol with an application to wintertime Fresno, California PM2.5. Atmospheric Chemistry and Physics Discussions, European Geosciences Union, 2007, 7 (3), pp.8423-8453. �hal-00302879�
ACPD
7, 8423–8453, 2007 Comprehensive carbonaceous aerosol characterization P. Herckes et al. Title Page Abstract Introduction Conclusions References Tables Figures ◭ ◮ ◭ ◮ Back CloseFull Screen / Esc
Printer-friendly Version Interactive Discussion
Atmos. Chem. Phys. Discuss., 7, 8423–8453, 2007 www.atmos-chem-phys-discuss.net/7/8423/2007/ © Author(s) 2007. This work is licensed
under a Creative Commons License.
Atmospheric Chemistry and Physics Discussions
A new comprehensive approach to
characterizing carbonaceous aerosol with
an application to wintertime Fresno,
California PM
2.5
P. Herckes1, J. A. Leenheer2, and J. L. Collett Jr.3
1
Arizona State University, Department of Chemistry and Biochemistry, Tempe, AZ 85287-1604, USA
2
U.S. Geological Survey, Building 95, MS408, Federal Center, Denver, CO 80225, USA
3
Colorado State University, Department of Atmospheric Science, Fort Collins, CO 80523-1371, USA
Received: 23 April 2007 – Accepted: 9 June 2007 – Published: 19 June 2007 Correspondence to: P. Herckes (pierre.herckes@asu.edu)
ACPD
7, 8423–8453, 2007 Comprehensive carbonaceous aerosol characterization P. Herckes et al. Title Page Abstract Introduction Conclusions References Tables Figures ◭ ◮ ◭ ◮ Back CloseFull Screen / Esc
Printer-friendly Version Interactive Discussion
Abstract
Fine particulate matter (PM2.5) samples were collected during a three week winter
pe-riod in Fresno (CA). A composite sample was characterized by isolating several distinct fractions and characterizing them by infrared and nuclear magnetic resonance (NMR) spectroscopy. More than 80% of the organic matter in the aerosol samples was
recov-5
ered and characterized. Only 35% of the organic matter was water soluble with another third soluble in dichloromethane and the remainder insoluble. Within the isolated water soluble material, hydrophobic acid and hydrophilic acids plus neutrals fractions tained the largest amounts of carbon. The hydrophobic acids fraction appears to con-tain significant amounts of lignin type structures, spectra of the hydrophilic acids plus
10
neutrals fraction are indicative of carbohydrates and secondary organic material. The dichloromethane soluble fraction contains a variety of organic compound families typi-cal of many previous studies of organic aerosol speciation, including alkanes, alkanols, alkanals and alkanoic acids. Finally the water and solvent insoluble fraction exhibits a strong aromaticity as one would expect from black or elemental carbon like material;
15
however, these spectra also show a substantial amount of aliphaticity consistent with linear side chains on the aromatic structures.
1 Introduction
Carbonaceous material is an important component of ambient particulate matter. In many environments carbon contributes several µg/m3 to ambient aerosol loadings
20
(Malm et al., 2004). Despite its importance on global (climate) and local (visibility, health effects) scales (Kanakidou et al., 2005; Turpin et al., 2000), organic material has only in the past decade or so become a topic of systematic investigation.
For many years specific, usually toxic, species including polycyclic aromatic hydro-carbons or dioxins were studied in the particulate phase. More detailed speciation
stud-25
ACPD
7, 8423–8453, 2007 Comprehensive carbonaceous aerosol characterization P. Herckes et al. Title Page Abstract Introduction Conclusions References Tables Figures ◭ ◮ ◭ ◮ Back CloseFull Screen / Esc
Printer-friendly Version Interactive Discussion
used for aerosol source apportionment (e.g. Rogge et al., 1993; Schauer et al., 1996). Despite the large number of species quantified in source apportionment studies, they frequently account for less than 20% by mass of the total organic matter present (Brown et al., 2002), the remainder being largely uncharacterized.
In recent years some efforts have also been directed towards comprehensive
ap-5
proaches to characterizing particulate organic matter, focusing on bulk compound prop-erties rather than on detailed molecular speciation. This general approach promises to provide more insight into modeling carbonaceous aerosol behavior in the atmosphere and, hopefully, to point out fruitful directions for future molecular speciation efforts. Some of the approaches taken include investigating solubility (Decesari et al., 2001),
10
structure (Gelencser et al., 2000), functionality (Decesari et al., 2000; Graham et al., 2002; Maria et al., 2002; Reff et al., 2005; Suzuki et al., 2001), and molecular size (Kalberer et al., 2004). Several studies investigated the fraction of organic particu-late matter that is water-soluble to better understand the hygroscopic growth potential of these particles and likely impacts on cloud and haze formation. In some cases
15
the water soluble organic carbon (WSOC) was further analyzed by chromatographic and/or spectroscopic techniques (Chang et al., 2005; Decesari et al., 2000; Duarte et al., 2004, 2005; Graham et al., 2002; Kiss et al., 2002; Sullivan and Weber, 2006a; Sullivan and Weber, 2006b).
Early organic matter characterization efforts by Havers and co-workers concluded
20
that carbonaceous aerosol, or a fraction thereof, shows properties similar to humic sub-stances and the terminology HUmic LIke Subsub-stances (HULIS) was introduced (Havers et al., 1998). Many efforts have focused since on demonstrating similarities or differ-ences between aerosol carbon and soil carbon, as extensively discussed by Graber and Rudich (2006). Recent work has also suggested that polymeric or oligomeric
ma-25
terial, potentially from secondary atmospheric formation, might comprise a substantial component of ambient particulate matter(Gao et al., 2004; Kalberer et al., 2004; Sam-burova et al., 2005a; SamSam-burova et al., 2005b; Tolocka et al., 2004).
ACPD
7, 8423–8453, 2007 Comprehensive carbonaceous aerosol characterization P. Herckes et al. Title Page Abstract Introduction Conclusions References Tables Figures ◭ ◮ ◭ ◮ Back CloseFull Screen / Esc
Printer-friendly Version Interactive Discussion
investigators have attempted to formulate simplified models of organic aerosol com-position that would be useful conceptually as well as for use in both laboratory and numerical modeling studies. Among these efforts is the work by Fuzzi et al. (2001) and McFiggans et al. (2005).
In order to continue improving our understanding of carbonaceous aerosol, and to
5
suggest fruitful directions for future organic speciation efforts, an approach previously developed for organic matter characterization in surface waters (Leenheer et al., 2000) and applied recently for fog organic matter (Herckes et al., 2007) was applied to atmo-spheric aerosol. Aerosol samples were collected in Fresno, California. A composite sample was characterized by fractionating and isolating organic matter into several
10
classes based upon molecule size, solubility, polarity, and acid/base/neutral character-istics. Resulting organic isolates were then characterized by infrared and13C-nuclear magnetic resonance (NMR) spectrometry and elemental analyses. Observed charac-teristics of the aerosol are reported here and compared with previous organic aerosol models.
15
2 Experimental methods
2.1 Sampling
Ambient aerosol samples were collected at five locations in the city of Fresno, Cali-fornia from 24 December 2003 until 15 January 2004. A detailed description of the sampling protocols and concentrations of organic source marker species is given
else-20
where (Gorin et al., 2006). In brief, the five sites included an urban site (downtown Fresno), three residential sites (California State University, Fresno campus; Fresno Pa-cific University campus and Clovis) and one site located in an industrial park in south Fresno near state highway 99. High-volume collectors were operated at all five sites to collect 20-h samples at a nominal flow rate of 1.13 m3/min, periodically checked with a
25
ACPD
7, 8423–8453, 2007 Comprehensive carbonaceous aerosol characterization P. Herckes et al. Title Page Abstract Introduction Conclusions References Tables Figures ◭ ◮ ◭ ◮ Back CloseFull Screen / Esc
Printer-friendly Version Interactive Discussion
from 02:00 p.m. to 10:00 a.m., local time, to allow sufficient time for daily filter exchange by a single site operator at all sites. The period of collection might bias the 20-h average sample concentrations somewhat higher than a 24-h average as local diurnal trends in winter PM2.5concentrations demonstrate that from 10:00 a.m. to 02:00 p.m.
concentra-tions are typically at a minimum (Chow et al., 1999). All samplers were equipped with a
5
Tisch Series 231 PM2.5impactor plate, providing simultaneous coarse particle samples
(on a slotted pre-filter) and PM2.5 samples. At two sites (Drummond and Clovis) the
high-volume collector was equipped with a PM10inlet upstream of the PM2.5impactor. In the current study we only focused on PM2.5samples.
Total as well as organic and elemental carbon were determined on each individual
10
filter using a thermo optical transmission method (Birch and Cary, 1996) on a Sunset Laboratories carbon analyzer. In order to provide enough particulate organic carbon for fractionation and analysis, a single composite sample was prepared by combining portions of each of the individual PM2.5 filters. Observations of aerosol composition, therefore, should be interpreted as being representative of a cross-section of Fresno
15
urban and suburban environments during winter.
2.2 Preparative organic matter fractionation and isolation procedure
The overall sample processing is described in Fig. 1 and is patterned after protocols used previously to characterize surface waters (Leenheer et al., 2000, 2004). 96 quartz fiber filter sections, 1/8 of each collected PM2.5 sample, were divided into smaller
por-20
tions that were inserted into six 250 mL Teflon centrifuge bottles. A solution of 200 mL of 0.01 M HCl was added to each centrifuge bottle, and the bottles were mixed by ro-tating on a GlasCol laboratory rotator overnight. The acid solutions were decanted and vacuum-filtered through a 47 mm, 1 µm porosity glass fiber filter. 200 mL of deionized water were added to each bottle, the bottles rotated for one hour, and the water
solu-25
tions decanted, filtered, and combined with the acid solution. This water extract was vacuum rotary evaporated to approximately 20 mL. The distillate containing volatile organic acids was titrated to pH 8.0 with 0.1 M NaOH. This distillate was vacuum
evap-ACPD
7, 8423–8453, 2007 Comprehensive carbonaceous aerosol characterization P. Herckes et al. Title Page Abstract Introduction Conclusions References Tables Figures ◭ ◮ ◭ ◮ Back CloseFull Screen / Esc
Printer-friendly Version Interactive Discussion
orated and freeze-dried to isolate the sodium salts of volatile organic acids.
The 20 mL water extract was placed in a Spectra/Por 3 regenerated cellulose dialysis bag (29 mm diameter, 3500 dalton pore size cutoff). It was dialyzed for three days against 1.1 L of deionized water. The particulate fraction in the dialysis bag was freeze-dried to give a colloid fraction free from salts.
5
The glass fiber filters used to filter the water extract were added to the quartz fiber filters in the centrifuge bottles, and the filters were freeze-dried while in the centrifuge bottles. Methylene chloride (100 mL) was added to each centrifuge bottle and the sam-ple was placed on the samsam-ple rotator overnight. The methylene chloride was vacuum-filtered through a 47 mm, 1 µm porosity glass fiber filter, and was vacuum rotary
evap-10
orated to 5 mL. This 5 mL concentrate was transferred to a 5 mL glass vial and was blown down to dryness under a stream of nitrogen gas. This fraction is designated CH2Cl2-extractable organic matter.
The quartz fiber filters in the six centrifuge bottles and the glass fiber filters used to filter the water and methylene chloride extracts were transferred to six Spectra/Por
15
3 regenerated cellulose dialysis bags (29 mm diameter, 3500 dalton pore size cutoff), and each bag was dialyzed against 4 L of 0.2 M HF. The HF solutions were changed daily for four days until the filters were completely dissolved. The bags were then dialyzed against deionized water until the permeate specific conductance was less than 10 µS/cm, and the particulate suspension inside the bags was freeze-dried to
20
isolate the particulate organic matterfraction.
The 1.1 L of dialysis permeate from the water extract was passed through a 20 mL column (1 cm ID ×28.5 cm) of MSC-1H cation exchange resin. The resin was rinsed with 50 mL of deionized water and then desorbed with 50 mL of 75% acetonitrile/25% water. This solution was evaporated and freeze-dried to isolate the hydrophobic neutral
25
fraction. The MSC-1H column was then desorbed with 50 mL of 3 M NH4OH which was evaporated and freeze dried to isolate the base fraction. The sample and rinse effluents from the MSC-1H column were then passed through a 20 mL column (1 cm ID ×28.5 cm) of Amberlite XAD-8 resin followed by 50 mL of 0.01 M HCl rinse. The column
ACPD
7, 8423–8453, 2007 Comprehensive carbonaceous aerosol characterization P. Herckes et al. Title Page Abstract Introduction Conclusions References Tables Figures ◭ ◮ ◭ ◮ Back CloseFull Screen / Esc
Printer-friendly Version Interactive Discussion
was desorbed with 50 mL of 75% acetonitrile/25% water. This solution was evaporated and freeze-dried to isolate a hydrophobic acid fraction.
The pH of the sample and HCl rinse from the column effluent was adjusted to pH 5 with NaOH. The volume was then reduced to 100 mL by vacuum rotary evapora-tion in a large Buchi R-220 vacuum rotary evaporator. The sample was transferred to
5
a small Buchi R-111 vacuum rotary evaporator and most of the NaCl, KCl, Na2SO4,
and CaSO4was removed by a zeotrophic distillation procedure (Leenheer et al., 2000) in which water from the sample is evaporated from glacial acetic acid, and inorganic salts are removed by vacuum filtration through a 1 µm glass fiber filter while hydrophilic acids and neutrals remain in solution. The filtrate volume was diluted with an equal
10
volume of deionized water and 30 mL of 1 M barium formate was added to precipitate the remaining sulfate as barium sulfate which was removed by centrifugation. The precipitate was washed with 20 mL of 1.0M HCl, separated by centrifugation, and the supernatant was evaporated to dryness with acetonitrile to remove HCl. The dry wash residue was added to the supernatant from the first centrifugation step. Excess
bar-15
ium in the supernatant was removed by passing the supernatant through an 80 mL (1.5 cm inside diameter (ID) ×30 cm in length) MSC-1H cation-exchange resin column at a flow rate of 20 mL/min. The column effluent was vacuum evaporated to dryness by repeatedly adding anhydrous acetonitrile to the moist residue which removed water, HCl, acetic acid and formic acid as volatile azeotrophs with acetonitrile. Fifty milliliters
20
of 98% formic acid was added to the dry residue and evaporated to dryness. This process reduces nitric acid in the sample to volatile nitrogen dioxide which is removed during evaporation. Formic acid in the moist residue was removed by evaporation with acetonitrile, and 50 ml of methanol was added and evaporated to dryness to re-move boric acid as volatile trimethyl borate. The residue was dissolved in 5.0 mL water
25
and saturated LiOH was added to adjust to pH 12 to precipitate Li3PO4. The solution was vacuum filtered through a 1 µm glass fiber filter and excess lithium was removed with a 20 mL MSC-1H cation exchange resin column (1 cm inside diameter ×28.5 cm in length). The column effluent was freeze-dried to isolate a Hydrophilic acids plus
ACPD
7, 8423–8453, 2007 Comprehensive carbonaceous aerosol characterization P. Herckes et al. Title Page Abstract Introduction Conclusions References Tables Figures ◭ ◮ ◭ ◮ Back CloseFull Screen / Esc
Printer-friendly Version Interactive Discussion
neutrals fraction.
2.3 Chemical characterization
2.3.1 Fourier Transform-Infrared (FT-IR) Spectrometry
Infrared spectra were collected using 1–2 mg of organic matter fraction isolates in potassium bromide pellets. A Perkin Elmer System 2000 FT-IR, using an infrared
5
source with a pulsed laser carrier and a deuterated triglycine sulfate detector, scanned from 4000 to 400 cm−1, averaging 10 scans at 1.0 cm−1 intervals with a resolution of
4.0 cm−1. All spectra were normalized after acquisition to a maximum absorbance of
1.0 for comparative purposes. For peak frequency assignments for organic compound classes see Table 1; assignments for inorganic solutes commonly found in water
sam-10
ples are given in Table 2.
2.3.2 Solid state cross polarization magic angle spinning13C-Nuclear Magnetic Res-onance (NMR) Spectrometry
Solid State Cross Polarization Magic Angle Spinning (CPMAS)13CNMR spectra were obtained on 10 mg or greater masses of organic matter fractions. Freeze-dried samples
15
were packed in ceramic rotors. CPMAS 13C-NMR spectra were obtained on a 200-megahertz (MHz) Chemagnetics CMX spectrometer with a 7.5-mm-diameter probe. The spinning rate was 5000 Hz. The acquisition parameters included a contact time of 5 ms, pulse delay of 1 s, and a pulse width of 4.5 µs for the 90◦pulse. Variable contact
time studies and comparison of liquid-state with solid state13C-NMR spectra by
Wer-20
shaw and coworkers (Wershaw et al., 2000) indicate these are the optimum parameters for quantitatively determining different organic carbon structural group contributions to the NMR spectra. The small fraction masses and hydroscopic nature of certain sample fractions created difficulties in obtaining13C-NMR spectra. Sample runs of two to three days were required to obtain 13C-NMR spectra with adequate signal to noise ratios.
ACPD
7, 8423–8453, 2007 Comprehensive carbonaceous aerosol characterization P. Herckes et al. Title Page Abstract Introduction Conclusions References Tables Figures ◭ ◮ ◭ ◮ Back CloseFull Screen / Esc
Printer-friendly Version Interactive Discussion
Organic structural assignments for peaks in the CPMAS13C-NMR spectra are given in Table 3.
2.3.3 Elemental analyses
Elemental analyses (C, H, N ) and moisture content of organic matter fractions were conducted by Huffman Laboratories, Golden, Colorado (Huffman and Stuber, 1985).
5
The small fraction masses created some difficulties in obtaining complete elemental and moisture analyses. Moisture and nitrogen contents were omitted when there was insufficient material available to analyze.
3 Results and discussion
The fractionation procedure described above isolates carbon in the samples from
in-10
organic salts, mineral components, and quartz fiber filters. The sample is fractionated into more homogeneous fractions based upon molecule size, polarity, volatility, and acid/base/neutral properties. The infrared and13C-NMR spectra and elemental analy-ses yield complementary organic structural information at a compound-class level for each of the isolated fractions. Both the experimental approach and resulting
informa-15
tion are unique, yielding original information on the composition of organic matter in Fresno winter aerosol.
Fraction weights and elemental analyses of organic matter fractions from the com-posite Fresno aerosol sample are presented in Table 4. A bar diagram of the total organic carbon fractionation is presented in Fig. 2. The largest fractions of carbon
20
are represented by the particulate organic matter fraction and the CH2Cl2extractable
organic matter fraction, at 34 and 31%, respectively. The hydrophilic acids plus neu-trals fraction contained 12% of the carbon and the hydrophobic acids fraction 10%. Other fractions individually contained 1–6% of the carbon recovered in the fractiona-tion scheme.
ACPD
7, 8423–8453, 2007 Comprehensive carbonaceous aerosol characterization P. Herckes et al. Title Page Abstract Introduction Conclusions References Tables Figures ◭ ◮ ◭ ◮ Back CloseFull Screen / Esc
Printer-friendly Version Interactive Discussion
The total mass of organic carbon recovered by the organic matter fractionation pro-cedure was 85.2 mg. The total organic carbon mass the quartz fiber filter composite was determined by the Sunset carbon analyzer measurements to be 102.3 mg (to-tal carbon mass was 122.4 mg). Therefore, the organic carbon recovery of the frac-tionation procedure is 83%. This recovery percentage is approximate because of the
5
various corrections and estimates for certain fractions presented in Table 4. Moisture contents were not determined for these fractions so that sufficient fraction mass would be left for nitrogen determinations. Recovery of 83% of the organic carbon (70% if one considers the total carbon) in the aerosol sample is quite good considering the following two factors. First, the organic carbon mass of the sample is exceptionally
10
small for a total organic carbon fractionation of this type. Handling and transfer losses tend to increase percentage carbon losses as the sample mass decreases. Second, semivolatile neutral compounds, such as alcohols, aldehydes, and ketones, might be lost during the fractionation and isolation procedure. The recovery seen here is also comparable to other “comprehensive” approaches to particulate organic carbon
char-15
acterization (Chang et al., 2005; Decesari et al., 2000; Graham et al., 2002).
The water soluble fractions account for 29.4 mg of the 85.3 mg of isolated material suggesting a WSOC fraction of 35%. This percentage compares reasonably well with an independent determination of dissolved organic carbon (DOC) in a filter leachate which estimated 25% of the organic carbon is soluble in water. The fraction of WSOC
20
in Fresno aerosol samples is at the low end of the typical range of 35–80% commonly reported in the literature (Alves et al., 2002; Decesari et al., 2001; Graham et al., 2002; Kiss et al., 2002). Highly polluted urban areas, however, tend to have a lower frac-tion of water soluble organic particulates since freshly emitted carbonaceous particles, especially from combustion processes, tend to be more hydrophobic than processed
25
aerosol particles or secondary organic species. The absence of chemically aged parti-cles is probably enhanced by reduced photochemistry in the winter time period studied here. Second, Fresno experiences frequent fog and haze conditions in winter and saw a substantial amount of precipitation and drizzle during the study period (Collett et al.,
ACPD
7, 8423–8453, 2007 Comprehensive carbonaceous aerosol characterization P. Herckes et al. Title Page Abstract Introduction Conclusions References Tables Figures ◭ ◮ ◭ ◮ Back CloseFull Screen / Esc
Printer-friendly Version Interactive Discussion
2007; Gorin et al., 2006). Under these conditions, the water soluble species are prefer-entially scavenged and removed from the atmosphere. Finally, fresh wood combustion is a major source of the ambient particle particulate matter observed in Fresno during the study period (Gorin et al., 2006). The main combustion source is fireplace and woodstove emissions. Flaming combustion, common in fireplaces, exhibits a WSOC
5
fraction as low as 4% (Novakov and Corrigan, 1996) while smoldering conditions, like those in large biomass burning events commonly yield a much higher WSOC fraction (Graham et al., 2002).
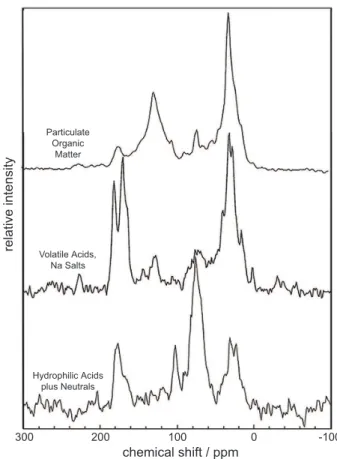
The particulate organic matter fraction is the largest fraction in the aerosol sample (Fig. 2). The isolated fraction appeared black, having substantial (35.6%) aromatic
(el-10
emental) carbon content based upon the13C-NMR spectrum of Fig. 3. The elemental carbon content determined by13C-NMR spectrometry is 10.2 mg, about half the con-tent (20.1 mg) of elemental carbon directly determined on the quartz fiber filters by the NIOSH method (Birch and Cary, 1996). The infrared spectrum (Fig. 4) of this fraction is free from any bands indicating inorganic substances such as the quartz fiber
fil-15
ter in which the aerosols were entrained. The sharp band at 2920 cm−1 and the sharp
peak at 30 ppm in the13C-NMR spectrum are indicative of methylene groups in straight chain hydrocarbons. The band at 1700 cm−1 and small peak at 174 ppm indicate the
presence of carboxylic acid groups. The broad band near 1620 cm−1 in the infrared
spectrum indicates aromatic and hydrogen-bonded quinone groups.
20
The large difference in “elemental carbon” measured by the thermo-optical method in individual filters and the aromatic (elemental) carbon content measured in the par-ticulate organic carbon fraction is intriguing. It is unlikely that such a large difference (approximately a factor of 2) can be explained by uncertainties associated with con-structing the filter composite or by losses in the isolation procedure. More likely, a
25
large fraction of what is measured as EC by the thermo-optical method is not a pure graphite (aromatic) structure but rather contains a substantial amount of other refrac-tory organic material. EC is only operationally defined and its amount can vary largely with the analytical method used (Chow et al., 2001; Currie et al., 2002). The fact that a
ACPD
7, 8423–8453, 2007 Comprehensive carbonaceous aerosol characterization P. Herckes et al. Title Page Abstract Introduction Conclusions References Tables Figures ◭ ◮ ◭ ◮ Back CloseFull Screen / Esc
Printer-friendly Version Interactive Discussion
large aliphatic component (shown in the13C-NMR spectrum of Fig. 3) in the particulate organic matter fraction was not extractable with methylene chloride suggests that the aliphatic hydrocarbons are covalently bonded with the black carbon component, per-haps as the result of radical coupling reactions. Unfortunately our understanding of the chemical structure of soot in general and aerosol EC in particular is poor. This is not a
5
problem unique to the aerosol science community; black carbon has also recently been found to be overestimated in soils and sediments because of methodological artifacts (Simpson and Hatcher, 2004).
The CH2 Cl2-extractable organic matter fraction is the second highest organic car-bon mass fraction (see Fig. 2). The extractable organic matter in the sample consisted
10
mainly of straight chain aliphatic hydrocarbons. These aliphatic hydrocarbons may be attached to carboxylic acid (1710 cm−1), ester (1735 cm−1), and aromatic (1620 cm−1)
structures which contribute small peaks to the infrared spectrum of this fraction (Fig. 4). Many aerosol organic speciation studies use methylene chloride or similar solvents to extract the organic fraction prior to GC/MS analysis. Hence solvent extractable
frac-15
tions are well characterized and it has been shown that straight and branched alkanes, alkanols, alkanoic acids, and alkanals are substantial components of particulate or-ganic matter (Alves et al., 2001; Fraser et al., 2002; Limbeck and Puxbaum, 1999; Rogge et al., 1993; Schauer et al., 1996). A more detailed discussion of the methylene chloride extractable fraction of these Fresno aerosol samples is given elsewhere (Gorin
20
et al., 2006) and several other studies also addressed the solvent extractable fraction of Fresno aerosol (Poore, 2002; Schauer and Cass, 2000). Silicone bands (1260, 1100, 1053 and 804 cm−1) are also present in the methylene chloride extract fraction as a
result of contamination by silicone lubricant used on the seals in the vacuum rotary evaporator. The silicone bands are a minor mass contaminant as the organic
car-25
bon percentage of these silicone lubricants is about 33% whereas the organic carbon percentage of this fraction is 72.2% (Table 4). The organic carbon contribution by the silicone lubricants was estimated in Table 4 by measuring the ratio of the peak intensity at 2960 cm−1 (methyl groups in silicones) to the peak intensity at 2920 cm−1
(methy-ACPD
7, 8423–8453, 2007 Comprehensive carbonaceous aerosol characterization P. Herckes et al. Title Page Abstract Introduction Conclusions References Tables Figures ◭ ◮ ◭ ◮ Back CloseFull Screen / Esc
Printer-friendly Version Interactive Discussion
lene groups in sample hydrocarbons) and calculating the relative contributions of sili-cone versus sample components based upon absorptivity ratios of standard compound spectra published by Pouchert (Pouchert, 1985). The organic carbon contribution with the silicones was calculated as 3.13 mg.
The volatile acid fraction in aerosol samples has substantially less percentage mass
5
(Fig. 2) than in fog samples collected in this region (Herckes et al., 2007). This is not surprising given the high solubility of weak gas phase organic acids in high pH (6–8) Fresno fogwaters. The aerosol volatile acid fractions is also substantially differ-ent in that acetic acid (measured as acetate), which is the dominant volatile acid in the fogwater samples (Ervens et al., 2003), is a major component (peak at 26 ppm in
10
the13C-NMR spectrum), but longer-chain (methylene peak at 30 ppm), and branched chain (methine peak at 38 ppm and methyl peak at 14 ppm) acids are present as well. The broad peak at 72 ppm might be indicative of volatile ether acids and the peak at 127 ppm indicates the presence of volatile aromatic acids. Many low molecular weight acids, including formic and acetic acid along with branched and aromatic species have
15
been reported in speciation studies of atmospheric particulate matter (Falkovich et al., 2005; Souza et al., 1999). The NMR peak at 171 ppm is indicative of sodium carbon-ate which is also indiccarbon-ated by the broad band at 1440 cm−1in the infrared spectrum of
Fig. 4. Sodium carbonate might result from drying this fraction at too high a pH value. The mass of the colloid fraction, respresenting just 2% of the total recovered
car-20
bon, was sufficient only for an infrared spectrum (see Fig. 4). Inorganic sulfates are indicated by bands at 1125 and 607 cm−1; silicates are indicated by bands at 1095
and 460 cm−1. Organic-structure bands at 1720, 1665, 1627, 1513, and 1413 cm−1
are suggestive of lignin structures (Faix, 1991). The hydrophobic neutral fraction con-tributes the smallest mass to the total organic carbon fractionation (1%), and only an
25
infrared spectrum (Fig. 4) was obtained. Organic-structure bands at 1720, 1630, 1515, 1280 and 1113 cm−1
are again suggestive of lignin structures (Faix, 1991); the differing position of these bands relative to the similar bands reported in the colloid fraction may reflect a greater degree of oxidation and degradation of lignins in the hydrophobic
neu-ACPD
7, 8423–8453, 2007 Comprehensive carbonaceous aerosol characterization P. Herckes et al. Title Page Abstract Introduction Conclusions References Tables Figures ◭ ◮ ◭ ◮ Back CloseFull Screen / Esc
Printer-friendly Version Interactive Discussion
tral fraction. A small, sharp band at 1260 cm−1suggests the presence of nitrate esters.
Bands for nitrite esters and nitroso groups were not found in this fraction, in contrast to their presence in analysis of a Fresno composite fog sample collected over the study period (Herckes et al., 2007).
The hydrophobic acid fraction was isolated as a very “sticky” fraction which precluded
5
obtaining a13C-NMR spectrum; however, an infrared spectrum (Fig. 4) and elemental analyses (Table 4) were obtained. Sharp bands in the infrared spectrum at 1630 and 1280 cm−1indicate nitrate esters. The nitrogen content of this fraction (1.95%) is
con-sistent with the presence of nitrate esters. Bands at 1515, 1335, and 1120 cm−1 may
indicate again degraded lignin components (Faix, 1991).
10
The colloid, hydrophobic neutral, and hydrophobic acid fractions all show aromatic structures suggestive of lignin precursors. Humic-like substances derived from lignin-type precursors were reported to form in model cloud water (Hoffer et al., 2004). It is interesting that the lignin signal is stronger in the aerosol sample than in a fogwater sample collected at this location (Herckes et al., 2007) where fulvic acid was found to
15
be derived from terpenoid precursors. Possibly, the phenol groups in lignin are more susceptible to oxidative degradation than in terpenoids where the phenol content is much lower. Organic nitrate esters were also found in the hydrophobic neutral and hydrophobic acid fractions, consistent with earlier findings of Garnes and Allen (2002). The hydrophilic acid plus neutral fraction contains the majority of the water-soluble
20
organic carbon (Fig. 2). The infrared spectrum (Fig. 4) has a strong C-O band at 1050 cm−1 and only a moderate carboxylic acid band at 1720 cm−1. The ratio of these
two bands indicates that neutral components rich in aliphatic alcohols are greater than carboxylic acid components. The 13C-NMR spectrum (Fig. 3) indicates the fraction is very rich in carbohydrates (anomeric carbon peak at 102 ppm and alcohol peak at
25
72 ppm) this could be indicative of carbohydrates and anhydrosugars. The presence of a substantial amount of anhydrosugars, including levoglucosan, is consistent with sep-arate measurements made on individual sample filters in a joint speciation study (Gorin et al., 2006) in which levoglucosan concentrations averaged 0.6 µg/m3and wood
com-ACPD
7, 8423–8453, 2007 Comprehensive carbonaceous aerosol characterization P. Herckes et al. Title Page Abstract Introduction Conclusions References Tables Figures ◭ ◮ ◭ ◮ Back CloseFull Screen / Esc
Printer-friendly Version Interactive Discussion
bustion emissions were demonstrated to be a dominant contributor to the collected aerosol. Previous studies have found levoglucosnan, a cellulose pyrolysis product, at concentrations up to 4.8% of the total organic carbon present (Schauer and Cass, 2000).
Both the infrared and the13C-NMR spectra for the hydrophilic acid plus neutral
frac-5
tion indicate the presence of structural methyl groups (2960 cm−1 band and 21 ppm
peak) that are not typically found in carbohydrate structures. Methylene hydrocarbon structures are indicated by the 2920 cm−1 band and 30 ppm peak. No aromatic
car-bon structures are found in this fraction. A possible explanation for the presence of branched methyl groups in this fraction is the formation of secondary organic aerosols
10
through photooxidation of isoprene (Claeys et al., 2004). A number of methyl branched-chain polyols are formed through this atmospheric reaction, and their structures are consistent with spectral signatures in this fraction.
The base fraction is a relatively minor component of the Fresno aerosol (4% of re-covered carbon), but it is a fraction that is very rich is nitrogen (Table 4) with an atomic
15
C:N ratio of 3.5. The infrared spectrum (Fig. 4) of the base hydrochlorides does not show any indication of ammonium chloride; thus, the nitrogen content of this fraction is derived from the sample and not the ammonia eluent. The broad bands at 1720, 1600, and 1500 cm−1are typical for a mixture of amino acids and peptides (Pouchert, 1985).
The plateau between 3200 and 3000 cm−1 are N-H stretching modes of these amino
20
acids and peptides. The atomic C:N ratio also supports the amino acid and peptide assignment. Again the presence of these species is not surprising in the nitrogen rich environment of Fresno. Zhang and Anastasio have shown high concentrations of free and total amino acids in different locations in the Central Valley of California (Zhang and Anastasio, 2003; Zhang et al., 2002). Separate measurements of dissolved organic
ni-25
trogen in Fresno fog samples collected during the study period confirm the importance of organic nitrogen in the area (Collett et al., 2007).
Comparing our results to other studies using fractionation techniques must be done with caution as other studies use different procedures and hence isolated fractions
ACPD
7, 8423–8453, 2007 Comprehensive carbonaceous aerosol characterization P. Herckes et al. Title Page Abstract Introduction Conclusions References Tables Figures ◭ ◮ ◭ ◮ Back CloseFull Screen / Esc
Printer-friendly Version Interactive Discussion
are not directly comparable. In addition, wintertime Fresno is a particular environment influenced by substantial agriculture emissions combined with dust, biomass burning (domestic wood burning) and vehicle emissions; frequently processed by local radiation fogs. The resulting fine carbonaceous material is only poorly water soluble. However comparing our results with the model composition proposed by Fuzzi et al. (2001) for
5
water soluble organic aerosol, there are many similarities. In our case a fulvic acid type material could reasonably represent ∼40% of the water soluble organic material as suggested by Fuzzi. Levoglucosan and polyol type material also have similar impor-tance as in Fuzzi’s model, although small organic acid molecules are less important in our case. Finally our observations reveal a higher organic nitrogen content than
pro-10
posed for the aerosol model, perhaps reflecting different source types characteristic of the Fresno region.
Similar processing and analysis of organic material in Fresno fogs collected on sev-eral days during the same study (Herckes et al., 2007) permits an interesting compari-son of the water soluble organic carbon (WSOC) fraction studied here with
character-15
istics of the organic material actually scavenged by Fresno fog drops. Some important similarities and significant differences are both seen. The main organic fraction in both fog and PM2.5WSOC are the hydrophilic acids, not surprising given their solubility and
the likelihood that significant carbonaceous material is contributed to the fog drops by nucleation scavenging. On the other hand the volatile acid fraction, mostly formic and
20
acetic acid, is more important in fog droplets. As discussed above, this is not surprising given the high vapor pressure of these compounds which keep them mostly in the gas phase, except when high pH liquid water is available to dissolve them. We also note that the fog organic matter contained a substantial amount of biological organic ma-terial (cell wall fragments, proteins, acetylaminosugars,. . . ) while this was not seen in
25
the PM2.5 aerosol fraction. This difference might result from fog scavenging of coarse
particulate matter, rich in biological material, excluded from our PM2.5analysis. Finally hydrophobic, lignin precursor-type material is less important in fog compared to PM2.5
ACPD
7, 8423–8453, 2007 Comprehensive carbonaceous aerosol characterization P. Herckes et al. Title Page Abstract Introduction Conclusions References Tables Figures ◭ ◮ ◭ ◮ Back CloseFull Screen / Esc
Printer-friendly Version Interactive Discussion
This might reflect different formation pathways, although more investigation is certainly necessary to test such a hypothesis.
4 Conclusions
The organic composition of fine particulate matter was investigated in Fresno (CA) during a 3 week winter period. A composite sample was characterized by isolating
5
several distinct fractions and characterizing them by infrared and nuclear magnetic resonance (NMR) spectroscopy.
More than 80% of the organic carbon in the aerosol samples was recovered in the extraction and separation process and characterized. A majority of the organic matter was insoluble in water. The small water soluble organic carbon fraction (35%) is
consis-10
tent with local winter time conditions with fresh, local particle emissions from domestic wood burning and urban traffic as well as preferential removal of soluble material by frequent radiation fog episodes.
An insoluble carbon fraction, which did not dissolve in water or dichloromethane, showed a strong aliphatic character paired with the expected aromaticity of this
frac-15
tion which might be expected to reflect the presence of black carbon. Our results suggest that the aerosol black carbon is likely made up by aromatic structures asso-ciated with linear hydrocarbon chains. The methylene chloride soluble carbon fraction featured many spectral characteristics, typical of species commonly identified in speci-ation studies using this solvent, including alkanes, alkanols and alkanoic acids.
20
The main water soluble organic carbon fraction, the hydrophilic acid fraction, ex-hibited characteristics suggestive of carbohydrates, compounds common in biomass emissions. Potential polyol type compounds, suggestive of the presence of secondary organic material, were also observed. Several other carbon fractions appeared to contain phenolic material like lignin precursors, not unlike some suggested humic like
25
structures.
ACPD
7, 8423–8453, 2007 Comprehensive carbonaceous aerosol characterization P. Herckes et al. Title Page Abstract Introduction Conclusions References Tables Figures ◭ ◮ ◭ ◮ Back CloseFull Screen / Esc
Printer-friendly Version Interactive Discussion
material showed a number of similarities to an earlier organic aerosol model published by Fuzzi et al. (2001), although greater amounts of nitrogen were found in Fresno par-ticles. Comparison of the same water soluble fraction of PM2.5 OC with OC in Fresno
fog water revealed that both were dominated by hydrophilic acids. Uptake of water soluble, low molecular weight carboxylic acids and the presence of greater amounts
5
of biological material distinguished the fog water organic composition from the water soluble organic carbon particles that likely acted as cloud condensation nuclei.
Acknowledgements. We are grateful to T. Lee, and A. Simpson for field assistance. Loan of
high-volume collectors and assistance procuring sampling sites by the SJV Air District and the California Air Resources Board (CARB) is gratefully acknowledged. Support for this work
10
was provided by the National Science Foundation (ATM-0222607). Additional support was provided by the San Joaquin Valleywide Air Pollution Study Agency and the San Joaquin Valley Air Pollution Control District. The statements and conclusions in this paper are those of the contractor and not necessarily those of the CARB, the San Joaquin Valleywide Air Pollution Study Agency or its policy committee, their employees or their members. Any use of trade, firm
15
and product names is for descriptive purposes only and does not imply endorsement by the U.S. Government.
References
Alves, C., Carvalho, A., and Pio, C.: Mass balance of organic carbon fractions in atmospheric aerosols, J. Geophys. Res., 107, 8345, doi:10.1029/2001JD000616, 2002.
20
Alves, C., Pio, C., and Duarte, A.: Composition of extractable organic matter of air particles from rural and urban Portuguese areas, Atmos. Environ., 35, 5485–5496, 2001.
Birch, M. E. and Cary, R. A.: Elemental carbon-based method for monitoring occupational exposures to particulate diesel exhaust, Aerosol Sci. Technol., 25, 221–241, 1996.
Brown, S. G., Herckes, P., Ashbaugh, L., Hannigan, M. P., Kreidenweis, S. M., and Collett, J.
25
L.: Characterization of organic aerosol in Big Bend National Park, Texas. Atmos. Environ., 36, 5807–5818, 2002.
ACPD
7, 8423–8453, 2007 Comprehensive carbonaceous aerosol characterization P. Herckes et al. Title Page Abstract Introduction Conclusions References Tables Figures ◭ ◮ ◭ ◮ Back CloseFull Screen / Esc
Printer-friendly Version Interactive Discussion
for the characterization of water soluble organic carbon, Geophys. Res. Lett., 32, L01810, doi:10.1029/2004GL021322, 2005.
Chow, J. C., Watson, J. G., Crow, D., Lowenthal, D. H., and Merrifield, T.: Comparison of IMPROVE and NIOSH carbon measurements, Aerosol Sci. Technol., 34, 23–34, 2001. Chow, J. C., Watson, J. G., Lowenthal, D. H., Hackney, R., Magliano, K., Lehrman, D., and
5
Smith, T.: Temporal variations of PM2.5, PM10, and gaseous precursors during the 1995 integrated monitoring study in central California, J. Air Waste Manage. Assoc., 49, 16–24, 1999.
Claeys, M., Wang, W., Ion, A. C., Kourtchev, I., Gelencser, A., and Maenhaut, W.: Formation of secondary organic aerosols from isoprene and its gas-phase oxidation products through
10
reaction with hydrogen peroxide, Atmos. Environ., 38, 4093–4098, 2004.
Collett, J. L., Herckes, P., Youngster, S., and Lee, T.: Processing of atmospheric organic matter by California radiation fogs, Atmos. Res., in press, 2007.
Currie, L. A., Benner, B. A., Kessler, J. D., Klinedinst, D. B., Klouda, G. A., Marolf, J. V., Slater, J. F., Wise, S. A., Cachier, H., Cary, R., Chow, J. C., Watson, J., Druffel, E. R. M., Masiello,
15
C. A., Eglinton, T. I., Pearson, A., Reddy, C. M., Gustafsson, O., Quinn, J. G., Hartmann, P. C., Hedges, J. I., Prentice, K. M., Kirchstetter, T. W., Novakov, T., Puxbaum, H., and Schmid, H.: A critical evaluation of interlaboratory data on total, elemental, and isotopic carbon in the carbonaceous particle reference material, NIST SRM 1649a, J. Res. Natl. Inst. Stand. Technol., 107, 279–298, 2002.
20
Decesari, S., Facchini, M. C., Fuzzi, S., and Tagliavini, E.: Characterization of water-soluble organic compounds in atmospheric aerosol: A new approach, J. Geophys. Res., 105, 1481– 1489, 2000.
Decesari, S., Facchini, M. C., Matta, E., Lettini, F., Mircea, M., Fuzzi, S., Tagliavini, E., and Putaud, J. P.: Chemical features and seasonal variation of fine aerosol water- soluble organic
25
compounds in the Po Valley, Italy, Atmos. Environ., 35, 3691–3699, 2001.
Duarte, R., Pio, C. A., and Duarte, A. C.: Synchronous scan and excitation-emission matrix fluorescence spectroscopy of water-soluble organic compounds in atmospheric aerosols, J. Atmos. Chem., 48, 157–171, 2004.
Duarte, R., Pio, C. A., and Duarte, A. C.: Spectroscopic study of the water-soluble organic
30
matter isolated from atmospheric aerosols collected under different atmospheric conditions, Anal. Chim. Acta, 530, 7–14, 2005.
ACPD
7, 8423–8453, 2007 Comprehensive carbonaceous aerosol characterization P. Herckes et al. Title Page Abstract Introduction Conclusions References Tables Figures ◭ ◮ ◭ ◮ Back CloseFull Screen / Esc
Printer-friendly Version Interactive Discussion
drop-size dependence of organic acid and formaldehyde concentrations in fog, J. Atmos. Chem., 46, 239–269, 2003.
Faix, O.: Classification Of Lignins From Different Botanical Origins By Ft-Ir Spectroscopy, Holz-forschung, 45, 21–27, 1991.
Falkovich, A. H., Graber, E. R., Schkolnik, G., Rudich, Y., Maenhaut, W., and Artaxo, P.:
5
Low molecular weight organic acids in aerosol particles from Rondonia, Brazil, during the biomass-burning, transition and wet periods, Atmos. Chem. Phys., 5, 781–797, 2005,
http://www.atmos-chem-phys.net/5/781/2005/.
Fraser, M. P., Yue, Z. W., Tropp, R. J., Kohl, S. D., and Chow, J. C.: Molecular composition of organic fine particulate matter in Houston, TX. Atmos. Environ., 36, 5751–5758, 2002.
10
Fuzzi, S., Decesari, S., Facchini, M. C., Matta, E., Mircea, M., and Tagliavini, E.: A simplified model of the water soluble organic component of atmospheric aerosols, Geophys. Res. Lett., 28, 4079–4082, 2001.
Gao, S., Ng, N. L., Keywood, M., Varutbangkul, V., Bahreini, R., Nenes, A., He, J. W., Yoo, K. Y., Beauchamp, J. L., Hodyss, R. P., Flagan, R. C., and Seinfeld, J. H.: Particle phase acidity
15
and oligomer formation in secondary organic aerosol, Environ. Sci. Technol., 38, 6582–6589, 2004.
Garnes, L. A. and Allen, D. T.: Size distributions of organonitrates in ambient aerosol collected in Houston, Texas. Aerosol Sci. Technol., 36, 983–992, 2002.
Gelencser, A., Meszaros, T., Blazso, M., Kiss, G., Krivacsy, Z., Molnar, A., and Meszaros, E.
20
Structural characterisation of organic matter in fine tropospheric aerosol by pyrolysis-gas chromatography-mass spectrometry, J. Atmos. Chem., 37, 173–183, 2000.
Gorin, C. A., Collett, J. L., and Herckes, P.: Wood smoke contribution to winter aerosol in Fresno, CA, J. Air Waste Manage. Assoc., 56, 1584–1590, 2006.
Graber, E. R. and Rudich, Y.: Atmospheric HULIS: How humic-like are they? A comprehensive
25
and critical review, Atmos. Chem. Phys., 6, 729–753, 2006,
http://www.atmos-chem-phys.net/6/729/2006/.
Graham, B., Mayol-Bracero, O. L., Guyon, P., Roberts, G. C., Decesari, S., Facchini, M. C., Artaxo, P., Maenhaut, W., Koll, P., and Andreae, M. O.: Water-soluble organic compounds in biomass burning aerosols over Amazonia – 1. Characterization by NMR and GC-MS, J.
30
Geophys. Res., 107, 8047, doi:10.1029/2001JD000336, 2002.
Havers, N., Burba, P., Klockow, D., and Klockow-Beck, A.: Characterization of humic-like sub-stances in airborne particulate matter by capillary electrophoresis, Chromatographia, 47,
ACPD
7, 8423–8453, 2007 Comprehensive carbonaceous aerosol characterization P. Herckes et al. Title Page Abstract Introduction Conclusions References Tables Figures ◭ ◮ ◭ ◮ Back CloseFull Screen / Esc
Printer-friendly Version Interactive Discussion
619–624, 1998.
Havers, N., Burba, P., Lambert, J., and Klockow, D.: Spectroscopic characterization of humic-like substances in airborne particulate matter, J. Atmos. Chem., 29, 45–54, 1998.
Herckes, P., Leenheer, J. A., and Collett, J. L.: Comprehensive Characterization of Atmospheric Organic Matter in Fresno, California Fog Water, Environ. Sci. Technol., 41, 393–399, 2007.
5
Huffman Jr., E. W. D. and Stuber, H. A.: Analytical methodology for elemental analysis of humic substances, in: Humic Substances in Soil Sediment, edited by: Aiken, G. R., McKnight, D. M., Wershaw, R. L., and MacCarthy, P., John Wiley and Sons, New York, pp. 433–455, 1985. Kalberer, M., Paulsen, D., Sax, M., Steinbacher, M., Dommen, J., Prevot, A. S. H., Fisseha, R.,
Weingartner, E., Frankevich, V., Zenobi, R., and Baltensperger, U.: Identification of polymers
10
as major components of atmospheric organic aerosols, Science, 303, 1659–1662, 2004. Kanakidou, M., Seinfeld, J. H., Pandis, S. N., Barnes, I., Dentener, F. J., Facchini, M. C., Van
Dingenen, R., Ervens, B., Nenes, A., Nielsen, C. J., Swietlicki, E., Putaud, J. P., Balkanski, Y., Fuzzi, S., Horth, J., Moortgat, G. K., Winterhalter, R., Myhre, C. E. L., Tsigaridis, K., Vignati, E., Stephanou, E. G., and Wilson, J.: Organic aerosol and global climate modelling:
15
a review, Atmos. Chem. Phys., 5, 1053–1123, 2005,
http://www.atmos-chem-phys.net/5/1053/2005/.
Kiss, G., Varga, B., Galambos, I., and Ganszky, I.: Characterization of water-soluble organic matter isolated from atmospheric fine aerosol, J. Geophys. Res., 107, 8339, doi:10.1029/2001JD000603, 2002.
20
Leenheer, J. A., Croue, J. P., Benjamin, M., Korshin, G. V., Hwang, G. J., Bruchet, A., and Aiken, G. R.: Comprehensive Isolation of Natural Organic Matter from Water for Spectral Characterizations and Reactivity Testing, in: Natural Organic Matter and Disinfection By-Products, edited by: Barrett, S. E., Krasner, A. W., and Amy, G. L., American Chemical Society, Washington, D.C., pp. 68–83, 2000.
25
Leenheer, J. A., Noyes, T. I., Rostad, C. E., and Davisson, M. L.: Characterization and origin of polar dissolved organic matter from the Great Salt Lake, Biogeochemistry, 69, 125–141, 2004.
Limbeck, A. and Puxbaum, H.: Organic acids in continental background aerosols, Atmos. Env-iron., 33, 1847–1852, 1999.
30
Malm, W. C., Schichtel, B. A., Pitchford, M. L., Ashbaugh, L. L., and Eldred, R. A.: Spatial and monthly trends in speciated fine particle concentration in the United States, J. Geophys. Res., 109, D03306, doi:10.1029/2003JD003739, 2004.
ACPD
7, 8423–8453, 2007 Comprehensive carbonaceous aerosol characterization P. Herckes et al. Title Page Abstract Introduction Conclusions References Tables Figures ◭ ◮ ◭ ◮ Back CloseFull Screen / Esc
Printer-friendly Version Interactive Discussion
Maria, S. F., Russell, L. M., Turpin, B. J., and Porcja, R. J.: FTIR measurements of functional groups and organic mass in aerosol samples over the Caribbean, Atmos. Environ., 36, 5185– 5196, 2002.
McFiggans, G., Alfarra, M. R., Allan, J., Bower, K., Coe, H., Cubison, M., Topping, D., Williams, P., Decesari, S., Facchini, C., and Fuzzi, S.: Simplification of the representation of the organic
5
component of atmospheric particulates, Faraday Discuss., 130, 341–362, 2005.
Novakov, T. and Corrigan, C. E.: Cloud condensation nucleus activity of the organic component of biomass smoke particles, Geophys. Res. Lett., 23, 2141–2144, 1996.
Poore, M. W.: Levoglucosan in PM2.5 at the Fresno supersite, J. Air Waste Manage. Assoc., 52, 3–4, 2002.
10
Pouchert, C. J.: The Aldrich Library of FT-IR Spectra. The Aldrich Chemical Company Inc., Milwaukee, Wisconsin, 1985.
Reff, A., Turpin, B. J., Porcja, R. J., Giovennetti, R., Cui, W., Weisel, C. P., Zhang, J., Kwon, J., Alimokhtari, S., Morandi, M., Stock, T., Maberti, S., Colome, S., Winer, A., Shendell, D., Jones, J., and Farrar, C.: Functional group characterization of indoor, outdoor, and personal
15
PM2.5: results from RIOPA, Indoor Air, 15, 53–61, 2005.
Rogge, W. F., Mazurek, M. A., Hildemann, L. M., Cass, G. R., and Simoneit, B. R. T.: Quan-tification of Urban Organic Aerosols at a Molecular-Level – IdenQuan-tification, Abundance and Seasonal-Variation, Atmos. Environ., 27, 1309–1330, 1993.
Samburova, V., Szidat, S., Hueglin, C., Fisseha, R., Baltensperger, U., Zenobi, R.,
20
and Kalberer, M.: Seasonal variation of high-molecular-weight compounds in the water-soluble fraction of organic urban aerosols, J. Geophys. Res., 110, D23210, doi:10.1029/2005JD005910, 2005a.
Samburova, V., Zenobi, R., and Kalberer, M.: Characterization of high molecular weight com-pounds in urban atmospheric particles, Atmos. Chem. Phys., 5, 2163–2170, 2005b.
25
Schauer, J. J. and Cass, G. R.: Source apportionment of wintertime gas-phase and particle-phase air pollutants using organic compounds as tracers, Environ. Sci. Technol., 34, 1821– 1832, 2000.
Schauer, J. J., Rogge, W. F., Hildemann, L. M., Mazurek, M. A., and Cass, G. R.: Source apportionment of airborne particulate matter using organic compounds as tracers, Atmos.
30
Environ., 30, 3837–3855, 1996.
Simpson, M. J. and Hatcher, P. G.: Overestimates of black carbon in soils and sediments, Naturwissenschaften, 91, 436–440, 2004.
ACPD
7, 8423–8453, 2007 Comprehensive carbonaceous aerosol characterization P. Herckes et al. Title Page Abstract Introduction Conclusions References Tables Figures ◭ ◮ ◭ ◮ Back CloseFull Screen / Esc
Printer-friendly Version Interactive Discussion
Souza, S. R., Vasconcellos, P. C., and Carvalho, L. R. F.: Low molecular weight carboxylic acids in an urban atmosphere: Winter measurements in Sao Paulo City, Brazil, Atmos. Environ., 33, 2563–2574, 1999.
Sullivan, A. P. and Weber, R. J.: Chemical characterization of the ambient organic aerosol soluble in water: 1. Isolation of hydrophobic and hydrophilic fractions with a XAD-8 resin, J.
5
Geophys. Res., 111, D05314, doi:10.1029/2005JD006485, 2006a.
Sullivan, A. P. and Weber, R. J.: Chemical characterization of the ambient organic aerosol soluble in water: 2. Isolation of acid, neutral, and basic fractions by modified size-exclusion chromatography, J. Geophys. Res., 111, D05315, doi:10.1029/2005JD006486, 2006b. Suzuki, Y., Kawakami, M., and Akasaka, K.: H-1 NMR application for characterizing
water-10
soluble organic compounds in urban atmospheric particles, Environ. Sci. Technol., 35, 2656– 2664, 2001.
Tolocka, M. P., Jang, M., Ginter, J. M., Cox, F. J., Kamens, R. M., and Johnston, M. V.: For-mation of oligomers in secondary organic aerosol, Environ. Sci. Technol., 38, 1428–1434, 2004.
15
Turpin, B. J., Saxena, P., and Andrews, E.: Measuring and simulating particulate organics in the atmosphere: problems and prospects, Atmos. Environ., 34, 2983–3013, 2000.
Wershaw, R. L., Aiken, G. R., Leenheer, J. A., and Tregellas, J. R.: Structural-group quantitation by CP/MAS13C-NMR measurements of dissolved organic matter from natural waters, in: Humic substances: Versatile components of plants, soil, and water, edited by: Ghabbour, E.
20
A. and Davis, G., Royal Society of Chemistry, Cambridge, England, pp. 63–81, 2000. Zhang, Q. and Anastasio, C.: Free and combined amino compounds in atmospheric fine
par-ticles (PM2.5) and fog waters from Northern California, Atmos. Environ., 37, 2247–2258, 2003.
Zhang, Q., Anastasio, C., and Jimemez-Cruz, M.: Water-soluble organic nitrogen in
at-25
mospheric fine particles (PM2.5) from northern California, J. Geophys. Res., 107, 4112, doi:10.1029/2001JD000870, 2002.
ACPD
7, 8423–8453, 2007 Comprehensive carbonaceous aerosol characterization P. Herckes et al. Title Page Abstract Introduction Conclusions References Tables Figures ◭ ◮ ◭ ◮ Back CloseFull Screen / Esc
Printer-friendly Version Interactive Discussion
Table 1.Infrared frequency bands for various structures in organic matter isolates.
Compound Class Frequencies (cm−1
), Structure (φ=aromatic car-bon ring), and Elements (C=carcar-bon, H=hydrogen, N=nitrogen, O=oxygen)
Carbohydrates 3400–3300 (O-H), 1100–1000 (C-O)
Fulvic Acid 3400–3300 (O-H), 2700–2500 (COOH), 1760
(COOR),1720(COOH),1660–1630(φ-C=O), 1280–1150 (φ-O, COOH)
Aliphatic Hydrocarbons 2960 (CH3), 2940 (CH2), 1460 (CH2),1380(CH3) Aromatic Hydrocarbons ∼1,600 (φ), ∼1500 (φ),700–900, φ-H
Proteins 1660 (Amide 1 band, N-C=O), 1,540 (Amide
2 band, N=C-O)
N-Acetyl Amino Sugars 1660 (Amide 1 band, N-C=O), 1,550 (Amide
2 band, N=C-O)1380 (CH3)
Lipids 1760 (COOR), 1720 (COOH), 2960 (CH3), 2940
(CH2), 1460 (CH2), 1380(CH3)
Nitrate Esters 1630 (N=O), 1280 (N-O)
Nitrite Esters 1650 (N=O), 1370 (N-O)
ACPD
7, 8423–8453, 2007 Comprehensive carbonaceous aerosol characterization P. Herckes et al. Title Page Abstract Introduction Conclusions References Tables Figures ◭ ◮ ◭ ◮ Back CloseFull Screen / Esc
Printer-friendly Version Interactive Discussion
Table 2.Characteristic infrared spectral peaks of inorganic solutes (in KBr pellets.)
Inorganic Solute Characteristic IR Peaks (cm−1)
Boric Acid 3212, 2260, 1450, 1194, 548
Sodium Bicarbonate 2541, 1920, 1695, 1618, 1307, 1000, 837, 696 Sodium Carbonate 1440, 880
Sodium Nitrate 1385, 838 Phosphoric Acid 1007, 490
Disodium Hydrogen Phosphate 1159, 1074, 950, 860, 544, 521 Silicic Acid 1093, 964, 798, 468
Sulfuric Acid 1288,1176,1071,1012,889,852,617,577,455 Sodium Hydrogen Sulfate 1251,1182, 1046, 865, 607,577, 481 Sodium Sulfate 1122, 640, 608
ACPD
7, 8423–8453, 2007 Comprehensive carbonaceous aerosol characterization P. Herckes et al. Title Page Abstract Introduction Conclusions References Tables Figures ◭ ◮ ◭ ◮ Back CloseFull Screen / Esc
Printer-friendly Version Interactive Discussion
Table 3.Structural assignments for13C-NMR spectra.
[C, carbon; H, hydrogen; N, sulfur; O, oxygen; S, sulfur; φ, aromatic carbon ring]
Chemical Linkage Compound Type Chemical Shift Range
Between Elements (parts per million)
C-H Aliphatic Hydrocarbon 0–55
C-N Amines, Amides, Proteins 40–55
O-CH3 Methoxy Groups in Tannins and Lignins 55–60
C-O Aliphatic Alcohols, Ethers, and Esters 60–90
O-C-O Anomeric Carbon in Carbohydrates, Lactols 90–110
φ Aromatic Carbon 95–165
φ−O Aromatic Esters, Ethers, and Phenols 135–165
φ−SO3H Aromatic Sulfonic Acids 140–145
O=C-O, O=C-N Carboxylic Acids, Esters, Amides 160–190
O=C-C=C Flavones, Quinones 170–200
ACPD
7, 8423–8453, 2007 Comprehensive carbonaceous aerosol characterization P. Herckes et al. Title Page Abstract Introduction Conclusions References Tables Figures ◭ ◮ ◭ ◮ Back CloseFull Screen / Esc
Printer-friendly Version Interactive Discussion
Table 4. Weight, and Elemental Analyses of Organic Matter Fractions from Fresno Aerosols (ND=Not Determined).
Fraction mg Percent Carbon Percent Hydrogen Percent Nitrogen Milligrams Carbon Corrected Carbon (mg) % C Particulate Organic Matter 49.4 60.83 4.65 2.37 30.05 28.81 34 Colloids 6.1 ND ND ND ND 1.81,2 2 Volatile Acids, Na Salts 72.2 8.53 0.58 0.45 6.16 4.81,3 6 CH2Cl2 Ex-tractable Organic Matter 38.3 78.69 9.07 0.66 30.13 27.04 31 Hydrophobic Neutrals 1.5 ND ND ND ND 0.71,2 1 Hydrophobic Acids 19.3 45.56 5.24 1.95 8.79 8.51 10 Hydrophilic Acids plus Neutrals 48.7 23.50 3.62 1.81 11.44 10.51 12 Bases 9.9 33.37 5.66 11.14 3.30 3.11 4
1. Corrected for estimated moisture content. Moisture estimate based upon moisture content of same fraction in isolated fractions from Fresno fog samples (Herckes et al., 2007)
2. Corrected for estimated carbon percentages. Carbon percentage estimate based upon same fraction in isolated fractions from Fresno fog samples (Herckes et al., 2007)
3. Corrected by subtraction of inorganic carbonate percentage determined from13C-NMR spectra of Fig. 3. 4. Corrected by subtraction of silicone organic carbon percentages estimated from the infrared spectrum of Fig. 4.
ACPD
7, 8423–8453, 2007 Comprehensive carbonaceous aerosol characterization P. Herckes et al. Title Page Abstract Introduction Conclusions References Tables Figures ◭ ◮ ◭ ◮ Back CloseFull Screen / Esc
Printer-friendly Version Interactive Discussion Water soluble fraction
concentrate distillate Sodium salts of volatile acids Vacuum distillation Dialysis step Colloid fraction Hydrophobic neutral fraction Hydrophilic acid plus neutral CH3CN/H2O NH4OH Base fraction Hydrophobic acid fraction CH3CN/H2O XAD-8 column HCl rinse
Removal of inorganic salts by ion exchange, distillation, precipitation
Water insoluble fraction
Sample Water, dilute HCl filtration Filtration filtrate filter Freeze drying Particulate Organic Matter Dilute HF Freeze drying permeate permeate CH3CN/H2O NH4OH MSC-1H H2O rinse -1H permeate permeate CH3CN/H2O Freeze drying Extraction with CH22Cl22 CH2Cl2 extractable organic matter 2 2
ACPD
7, 8423–8453, 2007 Comprehensive carbonaceous aerosol characterization P. Herckes et al. Title Page Abstract Introduction Conclusions References Tables Figures ◭ ◮ ◭ ◮ Back CloseFull Screen / Esc
Printer-friendly Version Interactive Discussion 0 5 10 15 20 25 30 35 40 Particulate Organic Matter
Colloids Volatile Acids, Na Salts CH2Cl2 Extractable Organic Matter Hydrophobic Neutrals Hydrophobic Acids Hydrophilic Acids plus Neutrals Bases % extracted carbon
ACPD
7, 8423–8453, 2007 Comprehensive carbonaceous aerosol characterization P. Herckes et al. Title Page Abstract Introduction Conclusions References Tables Figures ◭ ◮ ◭ ◮ Back CloseFull Screen / Esc
Printer-friendly Version Interactive Discussion 300 Particulate Organic Matter Volatile Acids, Na Salts Hydrophilic Acids plus Neutrals chemical shift / ppm 200 100 0 -100 relative intensity
ACPD
7, 8423–8453, 2007 Comprehensive carbonaceous aerosol characterization P. Herckes et al. Title Page Abstract Introduction Conclusions References Tables Figures ◭ ◮ ◭ ◮ Back CloseFull Screen / Esc
Printer-friendly Version Interactive Discussion 4000 3000 2000 1500 1000 400 Particulate Organic Matter Colloids Volatile Acids, Na Salts CH2Cl2-Extractable Organic Matter Hydrophobic Neutrals