HAL Id: hal-00301668
https://hal.archives-ouvertes.fr/hal-00301668
Submitted on 25 Jul 2005HAL is a multi-disciplinary open access
archive for the deposit and dissemination of sci-entific research documents, whether they are pub-lished or not. The documents may come from teaching and research institutions in France or abroad, or from public or private research centers.
L’archive ouverte pluridisciplinaire HAL, est destinée au dépôt et à la diffusion de documents scientifiques de niveau recherche, publiés ou non, émanant des établissements d’enseignement et de recherche français ou étrangers, des laboratoires publics ou privés.
Importance of the organic aerosol fraction for modeling
aerosol hygroscopic growth and activation: a case study
in the Amazon Basin
M. Mircea, M. C. Facchini, S. Decesari, F. Cavalli, L. Emblico, S. Fuzzi, A.
Vestin, J. Rissler, E. Swietlicki, G. Frank, et al.
To cite this version:
M. Mircea, M. C. Facchini, S. Decesari, F. Cavalli, L. Emblico, et al.. Importance of the organic aerosol fraction for modeling aerosol hygroscopic growth and activation: a case study in the Amazon Basin. Atmospheric Chemistry and Physics Discussions, European Geosciences Union, 2005, 5 (4), pp.5253-5298. �hal-00301668�
ACPD
5, 5253–5298, 2005
Organic aerosol and modeling aerosol hygroscopicity and activation M. Mircea et al. Title Page Abstract Introduction Conclusions References Tables Figures J I J I Back Close
Full Screen / Esc
Print Version Interactive Discussion
Atmos. Chem. Phys. Discuss., 5, 5253–5298, 2005 www.atmos-chem-phys.org/acpd/5/5253/
SRef-ID: 1680-7375/acpd/2005-5-5253 European Geosciences Union
Atmospheric Chemistry and Physics Discussions
Importance of the organic aerosol fraction
for modeling aerosol hygroscopic growth
and activation: a case study in the
Amazon Basin
M. Mircea1, M. C. Facchini1, S. Decesari1, F. Cavalli1, L. Emblico1, S. Fuzzi1, A. Vestin2, J. Rissler2, E. Swietlicki2, G. Frank3, M. O. Andreae3, W. Maenhaut4, Y. Rudich5, and P. Artaxo6
1
Istituto di Scienze dell’Atmosfera e del Clima, Consiglio Nazionale delle Ricerche, I-40129 Bologna, Italy
2
Division of Nuclear Physics, Lund University, S-221 00 Lund, Sweden 3
Biogeochemistry Department, Max Planck Institute for Chemistry, D-55020, Mainz, Germany 4
Department of Analytical Chemistry, Institute for Nuclear Sciences, Ghent University, B-9000 Gent, Belgium
5
Department of Environmental Sciences, Weizmann Institute, 76100 Rehovot, Israel 6
Instituto de Fisica, Universidade de Sao Paulo, CEP 05508-900 Sao Paulo, Brazil Received: 20 April 2005 – Accepted: 8 June 2005 – Published: 25 July 2005 Correspondence to: M. Mircea (m.mircea@isac.cnr.it)
ACPD
5, 5253–5298, 2005
Organic aerosol and modeling aerosol hygroscopicity and activation M. Mircea et al. Title Page Abstract Introduction Conclusions References Tables Figures J I J I Back Close
Full Screen / Esc
Print Version Interactive Discussion
EGU
Abstract
The aerosol in the Amazon basin is dominated throughout the year by organic matter, for the most part soluble in water. In this modeling study, we show how the knowl-edge of water-soluble organic compounds (WSOC) and the associated physical and chemical properties (e.g. solubility, surface tension, dissociation into ions) affect the 5
hygroscopic growth and activation of the aerosol in this area. The study is based on data obtained during the SMOCC field experiment carried out in Rond ˆonia, Brazil, over a period encompassing the dry (biomass burning) season to the onset of the wet sea-son (September to mid-November, 2002). The comparisea-son of predicted and measured cloud condensation nuclei (CCN) number concentration shows that the knowledge of 10
aerosol WSOC composition in terms of classes of compounds and of their relative molecular weights and acidic properties may be sufficient to predict aerosol activation, without any information on solubility. Conversely, the lack of knowledge on WSOC sol-ubility leads to a high overestimation of the observed diameter growth factors (DGF) by the theory. Moreover, the aerosol water soluble inorganic species describe reasonably 15
well the aerosol hygroscopic behavior at 90% relative humidity, but fail to predict CCN number concentration. In fact, this study shows that a good reproduction of the mea-sured DGF does not result in realistic estimations of CCN concentration if the chemical composition of aerosol, especially that of WSOC, is not appropriately taken into ac-count in the calculations. New parameterizations for the computed CCN spectra are 20
also derived which take into account the variability caused by chemical effects (surface tension, molecular composition, solubility, degree of dissociation of WSOC).
1. Introduction
The Amazon basin is an important source of aerosols and gases, which are transported to high levels in the atmosphere due to intense convection at the tropics, and therefore 25
ACPD
5, 5253–5298, 2005
Organic aerosol and modeling aerosol hygroscopicity and activation M. Mircea et al. Title Page Abstract Introduction Conclusions References Tables Figures J I J I Back Close
Full Screen / Esc
Print Version Interactive Discussion
1988; Andreae et al., 2004).
In this region in particular, the effect of aerosol on climate can be forced by the dramatic changes in aerosol load occurring during the dry season, when agricultural fires pursue extensive deforestation. Aerosol scattering and absorption of solar radia-tion, along with the cloud properties generated by very low pristine aerosol concentra-5
tions, are highly sensitive to small changes in aerosol concentration and composition (Lohmann and Feichter, 2005; Keil and Haywood, 2003).
Despite the very different sources characterizing the wet and dry seasons, through-out the year, Amazonian aerosol is dominated by organic matter in both the fine and coarse fraction (Andreae et al., 1988; Talbot et al., 1990; Wouters et al., 1993; Ar-10
taxo and Hansson, 1995; Ferek et al., 1998; Mayol-Bracero et al., 2002; Fuzzi et al., 20051). Moreover, recent studies have shown that the water-soluble organic com-pounds (WSOC) may account for a large fraction of organic aerosol mass (Mayol-Bracero et al., 2002; Graham et al., 2002; Decesari et al., 2005; Falkovich et al., 2005; Schkolnik et al., 2005), and therefore potentially influence aerosol hygroscopic growth 15
and activation.
The role of organic material on aerosol activation has been the focus of considerable attention in the recent literature (Novakov and Corrigan, 1996; Cruz and Pandis, 1997; Facchini et al., 1999; Charlson et al., 2001; Nenes et al., 2002; Lohmann et al., 2004). The results of such studies are sometimes contradictory due to the different organic 20
compounds considered, and to differences in the treatment of chemical and physical properties, such as surface tension, solubility, and degree of dissociation.
Recently, a few studies have attempted to model the observed cloud condensation nuclei (CCN) number concentrations over the Amazon basin during the wet season
1
Fuzzi, S., Decesari, S., Facchini, M. C., Cavalli, F., Emblico, L., Mircea, M., Andreae, M. O., Trebs, I., Hoffer, A., Guyon, P., Artaxo, P., Rizzo, L. V., Lara, L. L., Pauliquevis, T., and the SMOCC Community: Overview of the inorganic and organic composition of size-segregated aerosol in Rond ˆonia, Brazil, from the biomass burning period to the onset of the wet season, J. Geophys. Res., to be submitted, 2005.
ACPD
5, 5253–5298, 2005
Organic aerosol and modeling aerosol hygroscopicity and activation M. Mircea et al. Title Page Abstract Introduction Conclusions References Tables Figures J I J I Back Close
Full Screen / Esc
Print Version Interactive Discussion
EGU
(Roberts et al., 2001; Roberts et al., 2002; Zhou et al., 2002) and the wet-to-dry transi-tion period (Rissler et al., 2004). The potential influence of WSOC on aerosol activatransi-tion was overlooked by Zhou et al. (2002) and Rissler et al. (2004) since their studies were based on the physical properties of the aerosol particles (number size distributions and hygroscopic properties) rather than the chemical composition. Instead, Roberts 5
et al. (2001, 2002) showed that the WSOC comprised in the Amazonian aerosol might play an important role in aerosol activation, similar to that of sulfate. However, the in-fluence of WSOC was not accurately evaluated since the molecular characterization of the organic fraction of aerosol was unavailable.
The approach of Zhou et al. (2002) and Rissler et al. (2004) applied to data from the 10
SMOCC campaign (Vestin et al., 20052) showed a tendency to underestimate the mea-sured CCN concentrations with increasing supersaturation, while Zhou et al. (2002) and Rissler et al. (2004) showed good agreement between predicted and measured CCN.
These previous studies indicate the chemical composition of the aerosol, especially 15
the molecular characterization of WSOC, as a key factor for explaining the hygroscopic properties of Amazonian aerosol and its ability to activate as CCN.
Therefore, in the present paper, we examine how the chemical composition of the organic soluble fraction of aerosol and associated physical properties (e.g. solubility, surface tension, dissociation into ions) affect the hygroscopic growth and activation 20
in the case of Amazonian aerosol, mainly composed of organic material, in both the dry and wet seasons. The study is based on data acquired during the SMOCC field experiment carried out in 2002 in Rond ˆonia, Brazil, from September to mid-November, covering the last part of the dry season and the beginning of the wet season.
The number of activated aerosol particles, the CCN concentration, and wet diam-25
eter of aerosol particles at 90% RH were calculated using a K ¨ohler equation, which includes surface tension effect and a modified Raoult term that takes into account the
2
Vestin, A., Rissler, J., Swietlicki, E., Frank, G., et al.: Cloud nucleating properties of aerosol from Amazonian deforestation fires, Atmos. Chem. Phys. Discuss., to be submitted, 2005.
ACPD
5, 5253–5298, 2005
Organic aerosol and modeling aerosol hygroscopicity and activation M. Mircea et al. Title Page Abstract Introduction Conclusions References Tables Figures J I J I Back Close
Full Screen / Esc
Print Version Interactive Discussion
contribution of WSOC. The diameter growth factor (DGF) of the aerosol particles (ratio of the wet diameter at 90% RH to dry diameter), and the CCN number concentrations were computed using the chemical composition given by Fuzzi et al. (2005)1, Decesari et al. (2005), and Falkovich et al. (2005), and were compared to simultaneous mea-surements performed by H-TDMA (Rissler et al., 20053) and CCN counter (Vestin et 5
al., 20052), respectively.
Finally, the paper reports the derived parameterizations of CCN spectra in the Ama-zon basin, which comprise all the variability caused by the chemical effects (surface tension, molecular composition, solubility, degree of dissociation of WSOC), for dry, transition and wet periods.
10
2. Field experiment
The data used in this study were acquired during the LBA-SMOCC experiment (Large Scale Biosphere Atmospheric Experiment-Aerosol, Clouds, Rainfall, and Climate). The field campaign was carried out in Rond ˆonia, Brazil, at Fazenda Nossa Senhora Apare-cida (10◦1501100S, 62◦2102700W, 315 m a.s.l.). Physical and chemical measurements 15
of aerosol properties were performed from September to mid-November 2002, cov-ering different atmospheric conditions: from the end of the smoky dry season to the beginning of the wet season. Based on analyses of observed parameters such as aerosol mass, the SMOCC field campaign was divided into three periods: dry period (14 September–7 October), transition period (8–30 October) and wet period (after 30 20
October) (Fuzzi et al., 20051). During these periods, continuous measurements of hy-groscopic growth of aerosol (H-TDMA instrument – Rissler et al., 20053), aerosol spec-tra (DMPS instrument – Rissler et al., 20053), CCN spectra (CCN counter instrument
3
Rissler, J., Vestin, A., Swietlicki, E., Fisch, G., Zhou, J., Artaxo, P., and Andreae, M. O.: Size distribution and hygroscopic properties of aerosol particles from dry-season biomass burning in Amazonia, Atmos. Chem. Phys. Discuss., submitted, 2005.
ACPD
5, 5253–5298, 2005
Organic aerosol and modeling aerosol hygroscopicity and activation M. Mircea et al. Title Page Abstract Introduction Conclusions References Tables Figures J I J I Back Close
Full Screen / Esc
Print Version Interactive Discussion
EGU
– Frank et al., 20054) were performed simultaneously with aerosol sampling on filters and cascade impactors for chemical analysis. A brief description of the measurements is provided in the following sections.
2.1. Physical measurements
2.1.1. Aerosol number size distribution 5
Aerosol number size distributions (3–850 nm) were measured continuously throughout the campaign using a DMPS (Differential Mobility Particle Sizer) with a time resolution of 10 min. The DMPS system used two Vienna type DMAs (Differential Mobility An-alyzer, Winklmayr et al., 1991) that measured in parallel between 22 to 850 and 22 to 3 nm, respectively, in logarithmic steps for a total of 38 mobility channels. A CPC 10
(TSI 7610) and UCPC (TSI 3025) were used to count the particles exiting the DMAs. The mobility distributions were inverted to number size distributions taking into account sampling line losses, bipolar charging probabilities, DMA transfer functions and CPC counting efficiencies (Zhou et al., 2001). In this study, the number size distributions were averaged for the time period when the impactor samples were colleted. A full 15
analysis of the number size distributions for the entire SMOCC campaign is presented in Rissler et al. (2005)3.
2.1.2. Diameter growth factor
The hygroscopic diameter growth was measured with an H-TDMA for a total of 8 dry particle diameters in the 20–440 nm size range. The H-TDMA was operating continu-20
ously during the SMOCC campaign, with short interruptions only for flow settings, salt calibration scans or power failures. In the H-TDMA, a dry narrow quasi-monodisperse size fraction (RH<10%) is selected from the aerosol population using a DMA (Vienna
4Frank, G., et al.: Cloud Condensation Nuclei Concentrations and Efficiencies in the Ama-zon, Atmos. Chem. Phys. Discuss., to be submitted, 2005.
ACPD
5, 5253–5298, 2005
Organic aerosol and modeling aerosol hygroscopicity and activation M. Mircea et al. Title Page Abstract Introduction Conclusions References Tables Figures J I J I Back Close
Full Screen / Esc
Print Version Interactive Discussion
type, Winklmayr et al., 1991). The selected fraction is conditioned to a controlled rel-ative humidity and the size change caused by the water uptake is measured using a second DMA. In this study, scans at 90% RH were used. The H-TDMA data were evaluated off-line, and the quality was assured by applying a number of criteria to the status parameters logged by the H-TDMA software. Rissler et al. (2004) and Swietlicki 5
et al. (2000) give an extensive description of the quality assurance procedure. 2.1.3. Cloud condensation nuclei
The CCN concentrations as a function of supersaturation were measured with a static thermal-gradient CCN counter (Frank et al., 20054). The measuring cycle was such that the CCN concentrations at the supersaturations 0.23, 0.30, 0.39, 0.51, 0.66, 0.86, 10
1.12% were sequentially measured, with a time resolution of about one minute. Thus, a full CCN spectrum took about 7 min. The CCN counter was used at the Fazenda Nossa Senhora from 25 October to 14 November, having served in aircraft measure-ments during the first part of the campaign, thus covering only parts of the transition period plus the wet period. There are some time gaps in the data set, mainly because 15
of instrument and/or power failures, but the overall data coverage is good. A presen-tation of the CCN measurements during the SMOCC campaign and details about the calibration of the CCN counter and the uncertainties associated to the nominal super-saturation and the CCN number concentration are given in Frank et al. (2005)4. 2.2. Surface tension
20
Laboratory measurements of the surface tension for various aerosol samples taken during the dry, transition and wet periods were performed with a SINTECH (Berlin, Germany) PAT1 tensiometer. For each sample, the measurements were performed for different carbon concentrations. Therefore, the aerosol samples dissolved in wa-ter were diluted until the surface tension was equal to that of pure wawa-ter and were 25
ACPD
5, 5253–5298, 2005
Organic aerosol and modeling aerosol hygroscopicity and activation M. Mircea et al. Title Page Abstract Introduction Conclusions References Tables Figures J I J I Back Close
Full Screen / Esc
Print Version Interactive Discussion
EGU
The tensiometer determines the surface tension of a liquid from the shape of a pen-dant drop or bubble. The shape of a bubble or drop is given by the Gauss-Laplace equation, which represents a relationship between the curvature of a liquid meniscus and the surface tension (Loglio et al., 1998). The method allows surface tension mea-surements with an accuracy of ±0.1 mN/m.
5
2.3. Chemical measurements
A detailed description of the aerosol sampling and chemical measurements performed during the SMOCC experiment can be found in Fuzzi et al. (2005)1 and Decesari et al. (2005). Aerosol water extracts of both filter and impactor samples were analyzed with various techniques to determine the inorganic and organic chemical composition 10
of the aerosol. The concentration of inorganic ions (NH+4, Na+, K+, Ca2+, Mg2+,,Cl−, NO−3, SO−24 ) was determined by ion chromatography (IC) as described in Fuzzi et al. (2005)1. Total carbon (TC), organic carbon (OC) and elemental carbon (EC) were determined by thermal optical transmission (TOT) and evolution gas analysis (EGA) on filter samples. Furthermore, total water-soluble organic compounds (WSOC) were de-15
termined by liquid total organic carbon (TOC) analysis on quartz filters and the samples of five-stage Berner impactor. A suite of analytical techniques, comprising IC, GC-MS and nuclear magnetic resonance (NMR) spectroscopy, was employed to characterise the water-soluble fraction of aerosol OC with respect of individual compounds, chemi-cal classes and functional groups. A full treatment of the subject is given by Falkovitch 20
et al. (2005), Schkolnik et al. (2005), and Tagliavini et al. (2005). Briefly, the organic analyses allowed the speciation of about 15% of WSOC into a low-molecular weight po-lar compounds, including A) polyols, such as sugar-derivatives and 2-methyl-tetrols, B) short-chain aliphatic carboxylic acids, such as oxalic acid and malic acid, and C) ben-zoic acids, hydroxy- and methoxy-benben-zoic acids. The WSOC which eluded speciation 25
into individual compounds could be characterised only in terms of main neutral/acidic classes and of functional groups. It was found that about one third of WSOC
oc-ACPD
5, 5253–5298, 2005
Organic aerosol and modeling aerosol hygroscopicity and activation M. Mircea et al. Title Page Abstract Introduction Conclusions References Tables Figures J I J I Back Close
Full Screen / Esc
Print Version Interactive Discussion
curred as complex polymeric material carrying acidic groups and which were denoted “humic-like compounds” (HULIS) (Hoffer et al., 20055). The recovery of the different analytical techniques with respect to the total water-soluble carbon and the functional groups of bulk samples has been studied by Decesari et al. (2005), who also proposed a simplified representation of the WSOC by means of nine organic model compounds 5
(see Sect. 4). The inorganic and organic size-segregated chemical composition of the aerosol was obtained for a five-stage Berner impactor, whose five stages have the following cut-off diameters: 1) 0.05–0.14 µm; 2) 0.14–0.42 µm; 3) 0.42–1.2 µm; 4) 1.2– 3.5 µm; 5) 3.5–10 µm. The insoluble fraction of the aerosol was obtained by subtracting the measured water-soluble mass from the weighted mass. During the dry period, the 10
weighted masses were available for the same Berner impactor samples characterized by chemical analysis, while during the transition and wet periods, the aerosol masses were retrieved from Dekati low-pressure impactor (DLPI) samples (Fuzzi et al., 20051).
3. Theoretical model for computing DGF and CCN spectrum
Ideally, both H-TDMA and CCN counter measurements are performed when the wet 15
particles or droplets are in equilibrium with the surrounding water vapor. Therefore, the equilibrium theory of K ¨ohler (1936), which describes the growth of an aerosol particle as a function of its size and chemical composition, can be used to determine the DGF and CCN spectrum. The K ¨ohler equation was initially formulated for a soluble inor-ganic salt particle, but recently it has been applied to particles containing mixtures of 20
inorganic salts and organic compounds (Shulmann et al., 1999; Facchini et al., 1999; Charlson et al., 2001; Mircea et al., 2002; Nenes et al., 2002; Lohmann et al., 2004). The first term of the K ¨ohler equation, the “Kelvin term”, accounts for the increase in the water vapor pressure due to the curvature of the droplet surface, while the second
5Hoffer, A., Gelencs´er, A., Blazs´o, M., Guyon, P., Artaxo, P., and Andreae, M. O.: Chemical transformations in organic aerosol from biomass burning, Atmos. Chem. Phys. Discuss., submitted, 2005.
ACPD
5, 5253–5298, 2005
Organic aerosol and modeling aerosol hygroscopicity and activation M. Mircea et al. Title Page Abstract Introduction Conclusions References Tables Figures J I J I Back Close
Full Screen / Esc
Print Version Interactive Discussion
EGU
term, the “Raoult term”, considers the lowering of the equilibrium vapor pressure with increasing solute concentration.
The extension of the K ¨ohler equation to include the contribution of organic com-pounds assumes that all the organic comcom-pounds behave like salts, and neglects the in-teractions between organic-organic and organic-inorganic substances (due to the lack 5
of data). These assumptions are very strong, but the WSOC contained in aerosols are scarcely known, and thermodynamic theories to allow a more realistic modeling are not available. The modified K ¨ohler equation contains a modified “Raoult term”, which describes the additive effects of the inorganic and organic solutes during droplet growth: 10 s= 4σsMw RT ρwD − 6Mwφs πρs(D3− D3 N) X ii norg νimi Mi + X jorg νjmj Mj (1)
where s is the supersaturation (s=S−1, where S is the saturation mixing ratio), Mwand
ρw are molecular mass and density of water, respectively, σs – is the surface tension of the droplet solution, ρs – density of the droplet solution, R is the gas constant, T – temperature, D – droplet diameter, DN – diameter of the insoluble aerosol residue, φs 15
– osmotic coefficient of the aqueous solution; νi, mi, Mi and νj, mj, Mj are the number of dissociated ions, soluble mass and molecular mass, respectively, of inorganic, i , and organic, j , components of aerosol particles.
The wet diameter of an aerosol particle at a prescribed relative humidity (RH) is ob-tained by solving numerically Eq. (1), after which the DGF is computed as the ratio 20
of wet to dry diameter of aerosol particles. Equation (1) also gives the supersatu-ration needed for an aerosol particle to activate and, therefore, by summing all the activated aerosol particles at a given supersaturation, the CCN number concentration is obtained. Thus, the CCN predictions require the knowledge of aerosol number size distribution (aerosol spectrum), in addition to the chemical composition.
ACPD
5, 5253–5298, 2005
Organic aerosol and modeling aerosol hygroscopicity and activation M. Mircea et al. Title Page Abstract Introduction Conclusions References Tables Figures J I J I Back Close
Full Screen / Esc
Print Version Interactive Discussion
4. Model input data
In this study, the aerosol chemical composition, surface tension and number size dis-tribution were used as input data for the model simulations.
Impactor aerosol samples for chemical analysis were collected for time intervals ranging from twelve hours (during the dry period) to several days (during the wet 5
period): this high sampling time was necessary to obtain sufficient aerosol mass for size-segregated chemical analyses. Therefore, the chemical composition of aerosol sampled over many hours cannot discriminate, for example, between the fresh and aged aerosol and does not reflect the variability in DGFs measured by the H-TDMA, which performs measurements at higher time resolution. However, H-TDMA measure-10
ments were not performed continuously during the impactor sampling and, thus the two sets of measurements are not fully consistent. High resolution, but not continu-ous measurements were also performed by the CCN counter and DMPS, giving rise to similar data inconsistencies. None the less, averaging the DMPS, CCN and H-TDMA measurements over the time of aerosol sampling with the impactor, a fairly represen-15
tative and coherent data set on aerosol properties was obtained for use as model input or to compare with model output.
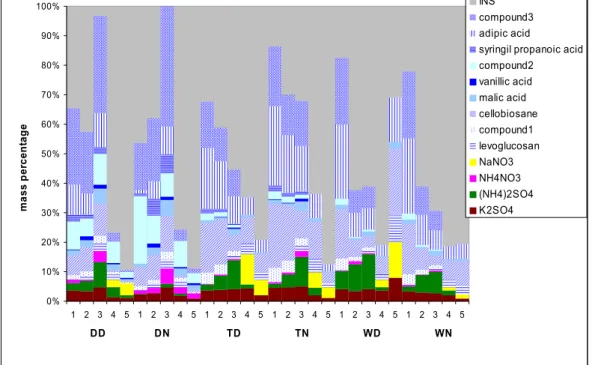
The size-segregated chemical composition of six-aerosol samples representative of the dry (DD, DN), transition (TD, TN) and wet (WD, WN) periods are shown in Fig. 1. The aerosol samples DD, TD and WD were collected during the day and DN, TN and 20
WN were collected during the night. The numbers from 1 to 5 under the histograms represent the five size intervals in which the five-stage Berner impactor collected the aerosol.
The inorganic species of the aerosol particles contained in the fine fraction are rep-resented in the model by ammonium sulfate, ammonium nitrate and potassium sulfate. 25
The coarse fraction contains also sodium nitrate. The choice of molecular compounds is based on data obtained from the analysis of the inorganic aerosol fraction (Fuzzi et al., 20051) and literature data (Andreae, 1983; Posfai et al., 2004).
ACPD
5, 5253–5298, 2005
Organic aerosol and modeling aerosol hygroscopicity and activation M. Mircea et al. Title Page Abstract Introduction Conclusions References Tables Figures J I J I Back Close
Full Screen / Esc
Print Version Interactive Discussion
EGU
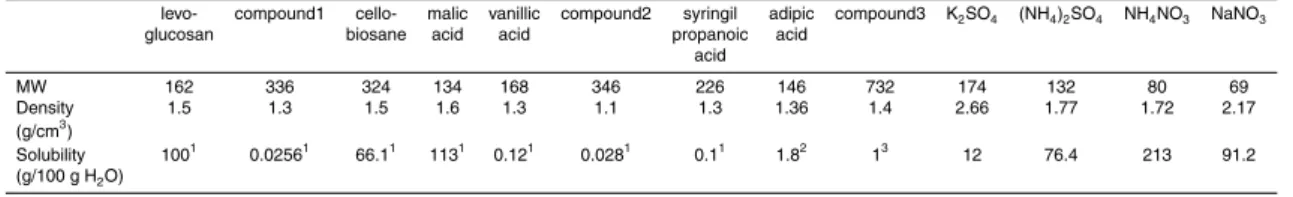
The organic composition of aerosol particles is based on Decesari et al. (2005) and Falkovich et al. (2005). Decesari et al. (2005) proposed nine organic model compounds to reproduce the chemical composition of WSOC. The organic model compounds are derived from functional group analyses and from separation in some chemical classes by liquid chromatography, or from identification by GC/MS analysis.
5
The multitude of organic compounds speciated at molecular level was lumped into three model compounds: levoglucosan, malic acid and vanillic acid, representative of the identified polyhydroxylated compounds (anhydrosugars, sugar-alcohols, monosac-charides and 2-methyl-tetrols) and of aliphatic short-chain carboxylic acids (C2-C6 dicarboxylic and hydroxy-mono-/di-carboxylic acids) and benzoic acids, respectively 10
(Falkovich et al., 2005; Schkolnik et al., 2005). The other six model compounds, sub-divided into general classes of neutral and acidic species, were introduced to describe the WSOC fraction not identified at molecular level, but characterized by functional group analysis and by fractionation with liquid chromatography (Decesari et al., 2005). Cellobiosane was selected to represent the unidentified polyhydroxylated species in-15
dicated by NMR, which could not be speciated into sugars, sugar-derivatives or 2-methly-tetrols. A hypothetic “compound 1” and syringyl-propanoic acid were selected to represent the neutral and acidic aromatic compounds, respectively; a hypothetic “compound 2” and adipic acid were selected to represent the unidentified aliphatic mono-carboxylic and di-carboxylic acids, respectively; a hypothetic “compound 3” was 20
selected to represent the class polycarboxylic “humic-like” substances. Therefore, a minimum number of model compounds was introduced to represent specific chemi-cal classes of identified WSOC, or specific functionalities determined by NMR anal-ysis that were not accounted for by speciation methods. It is important to stress that the proposed model WSOC composition reproduces quantitatively the functional group 25
compositions determined by NMR, and explicitly include the contribution of the WSOC identified at the molecular level by GCMS and IC. Furthermore, the range of molecular weight of the model compounds is compatible with the volatility behavior characterized by EGA (Hoffer et al., 20055).
ACPD
5, 5253–5298, 2005
Organic aerosol and modeling aerosol hygroscopicity and activation M. Mircea et al. Title Page Abstract Introduction Conclusions References Tables Figures J I J I Back Close
Full Screen / Esc
Print Version Interactive Discussion
The properties (mole weight, solubility and density) of these organic model com-pounds are summarized in Table 2.
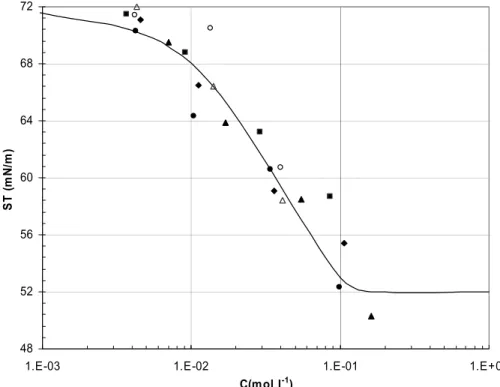
Figure 2 shows the surface tension as a function of carbon concentration. Surface tension measurements of aerosol samples taken in different periods (symbols) do not show a definite or high range of variation with carbon concentration. Therefore, we 5
derived a unique parameterization to describe surface tension behavior with carbon concentration. The best fit of the surface tension measurements with the Syszkowski-Langmuir function is shown as a solid line in Fig. 2 for carbon concentrations lower than 0.1 mol l−1, and has the form:
σs = 72 − 0.04T ln(1 + 39.215C) (2)
10
where T is the temperature (◦K) and C is the concentration of soluble carbon in moles l−1.
In the following simulations, the surface tension effect below the carbon concentra-tion of 0.1 mol l−1is described by Eq. (2). For carbon concentrations higher than 0.1 mol l−1, the surface tension is considered constant and equal to 52 mN/m.
15
Modifying the parameters of Eq. (2) to represent the surface tension measurements far from the solid line revealed a negligible effect on predicted DGFs and CCN number concentrations. Moreover, as was expected, the effect of surface tension on aerosol growth and activation was low, since organic species in aerosol collected over the Ama-zon basin are not such efficient surfactants as those observed in other environments 20
(Facchini et al., 1999; O’Dowd et al., 2004).
Computation of the concentration of activated aerosol particles at different supersat-urations (CCN spectra) requires the knowledge of the aerosol number size distribution. As mentioned previously, the aerosol number distributions were obtained by averaging DMPS data over the time of impactor aerosol sampling. The obtained aerosol spec-25
tra were then fitted with multimodal lognormal functions, and the parameters of the log-normal distributions for the six aerosol samples (DD, DN, TD, TN, WD,WN,) are presented in Table 1. Note that these parameters differ from those given in Rissler et
ACPD
5, 5253–5298, 2005
Organic aerosol and modeling aerosol hygroscopicity and activation M. Mircea et al. Title Page Abstract Introduction Conclusions References Tables Figures J I J I Back Close
Full Screen / Esc
Print Version Interactive Discussion
EGU
al. (2005)3, since the averaging time periods for the impactor samples (DD, DN, TD, TN, WD, WN) were considerably shorter than those used in Rissler et al. (2005)3. The best fit of the averaged measured aerosol spectra was obtained using two or three modes. During the wet period and during the night in the transition period, ultrafine and Aitken modes are sufficient to describe the aerosol population, since the accumulation mode 5
is removed by rain. During the day in the transition period and during the dry period, the accumulation mode also appears. The ultrafine mode disappears during the day in the dry period: probably these aerosol particles have had sufficient time to grow into the accumulation mode. Figure 3 shows that there are substantial differences in the aerosol number size distributions between day and night in all three periods. It can also 10
be seen that the aerosol number concentrations increase from the wet to dry period and the aerosol distributions shift towards higher modal diameters as the result of the addition of new sources (Rissler et al., 20053). Simultaneous measurements of coarse aerosol were not available for deriving a coarse mode in the aerosol size distributions presented in Table 1. However, the analysis of the few data available on the coarse 15
aerosol fraction obtained during the dry period shows concentrations of the order of a few particles only, thus allowing the neglect of the coarse mode in the calculation of the CCN number concentration.
5. Predictions of DGFs and CCN spectra and comparison with observations
The DGFs and CCN spectra presented in this section were calculated using the mod-20
eling approach described in Sect. 3 and the input data shown in Sect. 4. Sensitivity calculations were also performed to illustrate how organic aerosol solubility and organic chemical composition affect the predictions and, consequently, modify the agreement with observations.
The analysis was carried out for six-aerosol samples representative for day and night 25
conditions during the wet, transition and dry periods (Fig. 1). The daily and nightly aerosol samples were investigated separately because a clear difference was observed
ACPD
5, 5253–5298, 2005
Organic aerosol and modeling aerosol hygroscopicity and activation M. Mircea et al. Title Page Abstract Introduction Conclusions References Tables Figures J I J I Back Close
Full Screen / Esc
Print Version Interactive Discussion
between day and night in the organic and inorganic chemical composition of aerosol (Decesari et al., 2005) and in the aerosol number size distributions (Fig. 3). The daily cycle can be attributed to several factors, such as the diurnal cycle of the boundary layer, the large differences in temperature and relative humidity, and different stages of the combustion, especially in the dry period (Fuzzi et al., 20051). The measured 5
DGFs also show lower values during the night than during the day (Fig. 4) (Rissler et al., 20053), and CCN number concentrations are always higher during the night than during the day (Fig. 5).
The predicted and observed DGFs are shown in the following sections as a function of the aerosol aerodynamic diameter (Figs. 4 and 6). The aerodynamic diameters were 10
calculated using the H-TDMA mobility diameter of aerosol particles, and the appropri-ate density of the particles derived for each impactor stage and each aerosol sample. The density of an internally mixed aerosol particle was computed assuming that the particle is spherical, and assuming that both masses and volumes of the species are additive when two or more species are present in the particle. The size-segregated 15
chemical composition and the dry densities used to estimate the particle density are shown in Fig. 1 and Table 2, respectively. The aerosol particles with mobility diame-ters below 50 nm were assumed to have the chemical composition of the first stage of the Berner impactor. Thus, the H-TDMA particles with mobility diameters from 20 to 110 nm were assumed to have the chemical composition of the first stage, those 20
with 165 and 265 nm mobility diameters to have the chemical composition of the sec-ond stage, and those with 440 nm mobility diameter to have the chemical composition of the third stage of the Berner impactor. These associations between particle size and chemical composition remain, even if the H-TDMA mobility diameters converted in aerodynamics diameters are wetted or the impactor aerodynamic diameters are dried, 25
with respect to the ambient relative humidity measured during the aerosol sampling. The model simulations shown in the following sections include the surface tension effect described by Eq. (2).
ACPD
5, 5253–5298, 2005
Organic aerosol and modeling aerosol hygroscopicity and activation M. Mircea et al. Title Page Abstract Introduction Conclusions References Tables Figures J I J I Back Close
Full Screen / Esc
Print Version Interactive Discussion
EGU
5.1. Effects of organic aerosol solubility on DGF and CCN prediction 5.1.1. DGF predictions
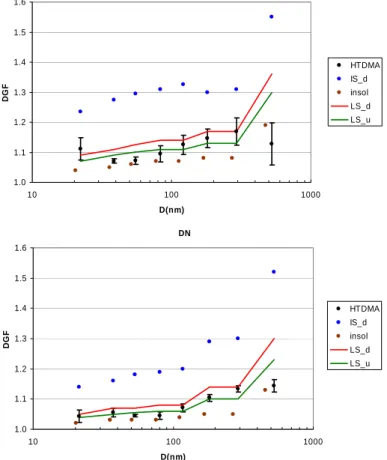
The measured DGFs and those calculated by different model simulations as a function of aerosol aerodynamic diameter are shown in Fig. 4. Black bullets and bars show the mean values of measured DGFs at 90% RH and their observed variability (±1 s.d.) 5
over the time of impactor aerosol sampling. In a first scenario, the DGFs were pre-dicted with the size-segregated chemical composition shown in Fig. 1, considering all compounds infinitely soluble and dissociated (blue bullets – IS d simulation in Fig. 4). Comparison of predicted DGFs with those observed in the three periods investigated during both day and night reveals a large overestimation of the DGFs measured by the 10
model: the molecular representation of WSOC and surface tension are not sufficient to describe aerosol growth at 90% RH. On the other hand, DGFs computed taking into account only the soluble inorganic aerosol, WSOC fraction insoluble (insol simulation), in general have slightly lower values than the observed DGFs (brown bullets in Fig. 4). In particular, the model underestimates the wet diameter of the smaller aerosol parti-15
cles for DD and TD samples: this indicates that some organic species can be fully or partly dissolved even at 90% RH, thus contributing to aerosol hygroscopicity.
The organic composition shown in Fig. 1 comprises compounds with varying physical and chemical properties, in particular different solubilities, as discussed by Decesari et al. (2005). The discrepancies between the predictions obtained considering organic 20
mass as infinitely soluble (IS d simulation) and insoluble (insol simulation), and the fact that the measured DGFs lie between the two extreme scenarios clearly point to the solubility of compounds as a potential key parameter for modeling aerosol growth at 90% RH.
The following simulations took into account the limited solubility of the organic model 25
compounds (Table 2). The solubility of each species was considered to be unaffected by the presence of the others, due to the lack of data on inorganic/organic interactions in mixtures of atmospheric interest (Shulmann et al., 1999; Lohmann et al., 2004).
ACPD
5, 5253–5298, 2005
Organic aerosol and modeling aerosol hygroscopicity and activation M. Mircea et al. Title Page Abstract Introduction Conclusions References Tables Figures J I J I Back Close
Full Screen / Esc
Print Version Interactive Discussion
Figure 4 shows the DGFs predicted considering the limited solubility of the chemical species, including the inorganic species, and assuming the dissolved organic acids completely dissociated (red lines – LS d simulation) and the DGFs calculated using the limited solubility data but considering the organic acids undissociated (green lines – LS u simulation). The area between the red and green lines (LS d and LS u simula-5
tions) represents the possible variations in predicted DGFs due to the different degrees of dissociation of organic acids. It is well known that the degree of dissociation depends on a series of factors, such as solute concentration, pH, ionic strength, etc. However, the present knowledge on the properties of mixed inorganic/organic aqueous solutions does not allow us to model realistically the changes in the number of ions in a growing 10
aerosol particle or droplets.
Figure 4 shows that considering limited solubility of compounds in the simulations (LS d and LS u simulations) substantially improves the agreement between predicted and observed DGFs for all the aerosol samples with respect to the case of organic compounds infinitely soluble and completely dissociated (IS d simulation). In particular, 15
the predictions are very close to observations in the case of aerosol sampled during the dry period (DD and DN samples), for which the available impactor data assured a satisfactory mass closure (Fuzzi et al., 20051; Decesari et al., 2005). The model overestimations of the observed DGFs during transition (TD, TN) and wet (WD, WN) periods can be attributed to the underestimation of the insoluble aerosol mass. As 20
pointed out in Sect. 2.2., unlike the dry period samples, the size-distributions of PM and of the water-soluble compounds were obtained using different impactors (a DLPI and the 5-stage Berner impactor, respectively) in the case of the transition and wet periods. Although the different efficiencies of the two impactors were accounted for (Fuzzi et al., 20051), the derivation of the insoluble fraction of the aerosol was not as 25
accurate as during the dry period.
The importance of a good estimation of the insoluble aerosol fraction in predicting DGFs is also evident in the IS d simulation (Fig. 4) for aerosol particles belonging to different impactor stages. Due to the Kelvin term, it is expected that if aerosol particles
ACPD
5, 5253–5298, 2005
Organic aerosol and modeling aerosol hygroscopicity and activation M. Mircea et al. Title Page Abstract Introduction Conclusions References Tables Figures J I J I Back Close
Full Screen / Esc
Print Version Interactive Discussion
EGU
have the same chemical composition, the predicted DGF increases with increasing aerosol diameter, and this behavior can be seen for the aerosol particles belonging to the same impactor stage. Conversely, the DGFs predicted for aerosol particles belonging to two successive impactor stages can decrease with increasing aerosol diameter, if the insoluble aerosol fraction increases. For example, the TD sample in 5
Fig. 4 shows that the DGFs of aerosol particles belonging to the second and third impactor stages are almost equal, despite their different sizes, and substantially lower than those predicted for some aerosol particles belonging to the first stage. These results are due to the increase in the insoluble aerosol fraction in stages two and three in the case of the TD sample (Fig. 1). Thus, the knowledge of the soluble and insoluble 10
aerosol fractions may explain why some large aerosol particles grow less than much smaller particles. Moreover, the size segregated chemical composition of the aerosol is a mandatory input for realistically modeling the hygroscopic growth of aerosol particles of different sizes.
A systematic disagreement between the predicted and measured DGFs for the 15
aerosol particles of 440 nm mobility diameter can be noticed in Fig. 4. It can be at-tributed to an underestimation of the aerosol insoluble fraction, even in the case of samples collected during the dry period, where both aerosol particle mass and sol-uble species were determined using the same impactor. The aerosol was sampled on aluminum foils used for gravimetry, and on tedlar foils used for chemical analysis, 20
each having a different sampling efficiency. Bouncing on aluminum foils on the third Berner impactor stage could have been enhanced by the very high concentrations of accumulation mode particles, thus accounting for the lower aerosol mass (citation).
Table 3 shows the ratio of predicted DGF to mean measured DGF averaged over all aerosol diameters scanned by H-TDMA for each simulation and each aerosol sample. 25
Notwithstanding the model’s failure to predict the wet particle size of 440 nm mobil-ity diameter using the chemical composition of the third impactor stage, the overall agreement between the predicted and measured DGFs is improved (Table 3) when the molecular composition of WSOC and their solubility is known (Table 2). The DGFs
ACPD
5, 5253–5298, 2005
Organic aerosol and modeling aerosol hygroscopicity and activation M. Mircea et al. Title Page Abstract Introduction Conclusions References Tables Figures J I J I Back Close
Full Screen / Esc
Print Version Interactive Discussion
predicted for different aerosol particles sizes are still higher than the mean measured DGFs (Fig. 4), due to the underestimation of the insoluble aerosol mass for aerosol sampled during transition (TD, TN) and wet (WD,WN) periods, but they are much lower than the DGFs predicted in the case of infinitely and completely dissociated organic compounds. Moreover, Fig. 4 and Table 3 show that the highest discrepancy between 5
prediction and measurements is obtained for the TN sample. This is partly explained also by the fact that during the TN time of sampling, the H-TDMA performed only a few measurements in a short time interval, in which no substantial changes in aerosol pop-ulation occurred, giving rise to a low variability of observed DGFs. Moreover, the lack of continuous H-TDMA measurements prevents the mean DGF from being a measure of 10
aerosol hygroscopicity throughout the night conditions over the transition period. Thus, the simulations based on chemical composition of aerosols sampled over the whole night are not in agreement with the few observations.
Examination of the average ratio obtained for all aerosol samples (Table 3) shows that the predicted DGFs overestimate by ca. 20% the measurements for the IS d sim-15
ulation, and vary from 1 to 6% for the LS d and LS u simulations. The impact of the degree of dissociation of the organic compounds is ca. 3% (LS u simulation with re-spect to the LS d simulation), substantially lower than the impact of the solubility of organic compounds, which is ca. 15% (IS d simulation with respect to the LS d simula-tion). Such estimates suggest once more that the knowledge of the organic molecular 20
composition and its solubility properties are essential for DGF prediction.
In addition, the results of the above simulations confirm the hypothesis of Kotchen-ruther and Hobbs (1998) and Rissler et al. (2004) that organic compounds may be responsible for part of the hygroscopicity observed in the Amazon basin.
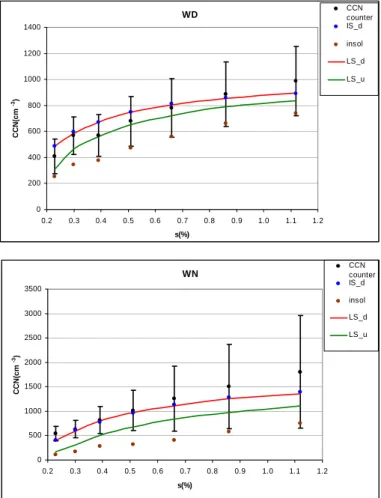
5.1.2. CCN predictions 25
The CCN number concentration was calculated using the K ¨ohler equation (1) and the aerosol number size distributions shown in Table 1 and Fig. 3. The CCN number concentrations as a function of supersaturations (CCN spectrum) were calculated at
ACPD
5, 5253–5298, 2005
Organic aerosol and modeling aerosol hygroscopicity and activation M. Mircea et al. Title Page Abstract Introduction Conclusions References Tables Figures J I J I Back Close
Full Screen / Esc
Print Version Interactive Discussion
EGU
supersaturation values where the CCN counter performed the measurements. The measured and simulated CCN spectra are shown in Fig. 5. The measured CCN num-ber concentration as a function of supersaturation, and the observed variability of CCN over the time of impactor aerosol sampling are shown as black bullets and bars, re-spectively. As discussed in Sect. 4, the CCN number concentration for a given super-5
saturation was averaged over the time of aerosol sampling carried out with the Berner impactor. For the dry period, only predicted CCN number concentrations are shown in Fig. 5, simultaneous measurements of CCN not being available at the ground.
The predicted CCN number concentrations shown in Fig. 5 were calculated consid-ering the scenarios discussed in the previous section and shown in Fig. 4 for the DGF 10
simulations. In the IS d simulation the WSOC were assumed as infinitely soluble, in the insol simulation WSOC were assumed as insoluble, while in the LS d and LS u simulations WSOC were of limited solubility (Table 2) with organic acids dissociated and undissociated, respectively.
The CCN predicted by the insol simulation (Fig. 5) shows without doubt that consid-15
ering soluble inorganic aerosol alone cannot account for CCN activity over the Amazon basin in all periods. Thus, the knowledge of the WSOC fraction is important for model-ing the CCN activity for aerosol highly dominated by organic material.
In addition, Fig. 5 shows the overlap of the simulations based on the proposed WSOC model, but assuming that the organic compounds are infinitely soluble (IS d 20
simulation) or of limited solubility (LS d simulation), at all supersaturations for all aerosol samples. These simulations show that, for the organic molecular composi-tion shown in Fig. 1, the limited solubility of organic aerosol in the Amazon basin is not a critical parameter in supersaturated conditions, contrary to what was observed at 90%RH in the H-TDMA measurements.
25
Moreover, the good agreement between the CCN predictions obtained by consid-ering the limited solubilities of the organic compounds and the CCN measurements might explain the underprediction of CCN found by Vestin et al. (2005)2using H-TDMA data. The aerosol soluble mass inferred from H-TDMA measurements at 90%RH is
ACPD
5, 5253–5298, 2005
Organic aerosol and modeling aerosol hygroscopicity and activation M. Mircea et al. Title Page Abstract Introduction Conclusions References Tables Figures J I J I Back Close
Full Screen / Esc
Print Version Interactive Discussion
underestimated in the case of slightly soluble species, which are not dissolved at this RH, but dissolve in supersaturated regimes and thus contribute to CCN activity and not to DGF. However, the erroneous estimation of the aerosol soluble fraction based on H-TDMA data may occur, only when the aerosol composition is highly dominated by slightly soluble species, as in the case of Amazonian aerosol.
5
Therefore, it is clear that the aerosol activation over the Amazon basin cannot be ap-propriately described by considering the soluble inorganic aerosol alone, without any organic compounds (insol simulation), since the underestimations of the observations ranged from 31 to 61% (Table 4). Table 4 shows the ratio of predicted CCN to measured CCN number concentration (mean value) averaged over all supersaturations where the 10
CCN counter performed measurements (calculations are presented for all the cases considered in this study). The comparison between the insol (considering WSOC in-soluble) and LS d (considering the limited solubility of organic compounds and the organic acids completely dissociated) also shows variations of predicted CCN number concentrations up to ca. 60%. The degree of dissociation of the organic compounds 15
can also affect the predicted CCN number concentrations by ca. 30% on average (LS d and LS u simulations).
The CCN predicted in the case of organic compounds with limited solubility (LS d and LS u simulations) for DD aerosol sample (Fig. 5) compares well with the CCN airborne measurements shown in Fig. 3 by Andreae et al. (2004) for a biomass burning 20
processed aerosol. This confirms the validity of our CCN predictions even during the dry period, when CCN measurements at the ground were not performed.
5.2. Effects of organic chemical model uncertainties on DGF and CCN prediction The results obtained in Sect. 5.1 demonstrate that the knowledge of the WSOC aerosol fraction and its physical and chemical properties is very important for modeling DGFs 25
and CCN number concentration. Therefore, the prediction of DGFs and CCN concen-trations is expected to be sensitive to the uncertainties associated with the organic molecular representation of WSOC. The organic model compounds cannot be inferred
ACPD
5, 5253–5298, 2005
Organic aerosol and modeling aerosol hygroscopicity and activation M. Mircea et al. Title Page Abstract Introduction Conclusions References Tables Figures J I J I Back Close
Full Screen / Esc
Print Version Interactive Discussion
EGU
univocally from the data available on chemical composition: the model is compati-ble with the observed chemical composition (Decesari et al., 2005) but other modified representations may exist. In fact, on the basis of the organic chemical analyses, it is impossible to distinguish between the carboxylic acids occurring as acids and those occurring as salts of alkaline metals or ammonium, which show rather different physico-5
chemical properties. Indeed, inorganic chemical analyses by IC highlight a systematic anion deficiency of about 15–30%; it is therefore plausible that part of the cations are balanced by carboxylates (Trebs et al., 2005). In addition, the physico-chemical proper-ties of some model compounds (e.g. molecular weight and solubility) cannot be directly measured or found in the literature.
10
Therefore, two other scenarios were elaborated with respect to the organic model compounds presented in Table 2, focusing on the uncertainties affecting the solubil-ity of organic compounds and the molalsolubil-ity in solution. A “more soluble” scenario was produced by considering the occurrence of ammonium salts of carboxylic acids: adipic acid, which is the most important slightly soluble compound in our model, was partly 15
considered as di-ammonium salt. The exact amount of ammonium adipate was calcu-lated from the equivalents of cations in excess compared to the inorganic anions on each impactor stage. The ammonium adipate has a molecular weight of 180 g and a solubility of 50.4 g/100 g H2O. Thus, the molar solubility of adipic acid salt is roughly 20 times that of adipic acid (Beilstein Information system). In the second scenario, 20
described as “less soluble”, the solubility of model compounds with the most uncertain solubility data was set to a minimum value. The solubility of compound 1 was de-creased to 2.5*10–5 moles/100 g H2O, corresponding to that of 5,7,30,40 -tetrahydroxy-flavone (CAS 491-70-3) (Beilstein Information system). The solubility of malic acid was set to that of less-polar C4 aliphatic dicarboxylic acids, like succinic acid (solubility= 25
7.5*10–2 moles/100 g H2O; Saxena and Hildemann, 1996). In addition, the solubility of compound 3, which is more aliphatic than commercial fulvic substances, was set arbitrarily to 1/10 of the solubility of the Suwannee River fulvic acid, giving 0.1 g/100 g H2O. Finally, the highly soluble cellobiosane (a dimer of levoglucosan), representing
ACPD
5, 5253–5298, 2005
Organic aerosol and modeling aerosol hygroscopicity and activation M. Mircea et al. Title Page Abstract Introduction Conclusions References Tables Figures J I J I Back Close
Full Screen / Esc
Print Version Interactive Discussion
the model compounds with the largest uncertainty on the molecular weight (Decesari et al., 2005), was substituted with a polymer of 3000 Da and the same functional group composition, which can be considered a small polysaccharide. Solubility of this poly-mer was also lowered compared to that of cellobiosane, because polysaccharides are much less soluble than disaccharides. A value of 10 g/100 g H2O was set, correspond-5
ing to the solubility of dextrans of 3000 Da (product information from Molecular Probes, Inc., Eugene, OR, USA). Finally, the “less soluble” scenario comprises both a reduced solubility of the WSOC aerosol fraction and a decreased number of soluble moles, due the higher molecular weight of Da compared to that of cellobiosane (Table 2).
Figure 6 shows the effects of the two organic model compound scenarios – “more” 10
and “less” soluble – on DGFs and CCN number concentrations for TD aerosol sam-ple. The yellow bullets (more d simulation) show the DGF and CCN predicted by the “more soluble” chemical model considering the carboxylic acids and their salts com-pleted dissociated in solution. The pink bullets (less d simulation) show the DGF and CCN predicted by the “less soluble” chemical model considering carboxylic acids com-15
pletely undissociated. The LS d and LS u simulations are those from previous the section. The DGFs predicted using the “more” and “less” soluble organic chemical models are different from those predicted by the LS d and LS u simulations. This im-plies that DGFs predictions are sensitive to the uncertainty in representation of organic aerosol related to the solubility and the molality in solution. The “more soluble” chem-20
ical model produces higher DGFs estimations, as compared with the LS d simulation where only the adipic species were considered, by replacing part of the adipic acid with more soluble ammonium adipate. It is important to note that, although the fine aerosol fraction contains less than 20% adipic acid by mass (Fig. 1), its conversion into salt affects the DGF predictions. This emphasizes once more that the knowledge of 25
the molecular composition of WSOC, which determines also its physical and chemical properties (molecular weight, solubility, surface tension), is necessary for accurate pre-dictions of aerosol hygroscopic growth. The DGFs predicted using the “less soluble” chemical model have the lowest values of all the predictions, due to the simultaneous
ACPD
5, 5253–5298, 2005
Organic aerosol and modeling aerosol hygroscopicity and activation M. Mircea et al. Title Page Abstract Introduction Conclusions References Tables Figures J I J I Back Close
Full Screen / Esc
Print Version Interactive Discussion
EGU
decrease in the number of soluble moles (caused by the increase in molecular weight of cellobiosane) and decrease in the solubility of some organic model compounds.
Figure 6 also shows that the predicted CCN number concentrations are less sen-sitive to the uncertainty of the chemical model: the “more soluble” scenario (more d simulation) gives the same results as the IS d and LS d simulations (WSOC infinitely 5
soluble and WSOC with limited solubility, respectively), while the results obtained with the “less soluble” scenario (less u simulation) do not differ substantially from the val-ues given by the LS u simulation. It is therefore concluded that the CCN predictions are not sensitive to changes in the chemical composition and associated physical and chemical properties, as long as these changes do not substantially modify the number 10
of soluble moles available at the supersaturations under investigation.
6. Parameterizations of CCN spectra
In this section, parameterizations of the daytime CCN spectra for the dry, transition and wet periods are derived on the basis of the model simulations, which use the average of observed aerosol number size distribution and chemical composition.
15
In the previous section, it was shown that the observed CCN number concentrations are well reproduced by the model at all the supersaturations, if the solubility of the WSOC is taken into account (LS d and LS u simulations). Therefore, in order to derive CCN parameterizations that comprise all the variability caused by the chemical effects (surface tension, molecular composition, solubility, degree of dissociation of WSOC), 20
the relative CCN spectra fitting the LS d and LS u simulations for each period were computed. The CCN spectra lying between the LS d and LS u simulations (the organic acids completely dissociated and completely undissociated, respectively) represent the variations in CCN number concentration due to the degree of dissociation.
In the literature, a number of empirical functions have been proposed to describe 25
the CCN supersaturation spectrum (Twomey, 1959; Ji and Shaw, 1998; Cohard et al, 1998; Dusek et al., 2003). However, apart from the power law expression suggested
ACPD
5, 5253–5298, 2005
Organic aerosol and modeling aerosol hygroscopicity and activation M. Mircea et al. Title Page Abstract Introduction Conclusions References Tables Figures J I J I Back Close
Full Screen / Esc
Print Version Interactive Discussion
by Twomey (1959), all the other functions allow a realistic representation of the activa-tion spectrum, especially at high supersaturaactiva-tion where CCN concentraactiva-tions reach a constant value (“saturated”), through the use of more adjustable parameters.
Here, the best fits for the CCN spectra were obtained with the mathematical expres-sion proposed by Ji and Shaw (1998):
5
NCCN(cm−3)= A(1 − exp[−BSk])) (3)
Table 5 shows the parameters A, B and k of the Eq. (3) for the daily CCN spectra obtained by fitting LS d and LS u simulations for dry, transition and wet periods. The fits are not visually distinguishable from the detailed simulations. This is also confirmed by the root mean square deviation (RMSD) values, which are very small with respect 10
to the maximum concentration of CCN.
Such parameterizations can be further used in large-scale models to simulate the cloud formation and evolution during dry, transition and wet periods. In addition, for a given period, the impact of the WSOC dissociated in different degrees on cloud can be simulated by varying the parameters A, B and k of the Eq. (3) within the range of the 15
values shown in Table 5 for that period.
7. Summary and conclusions
The paper shows that a detailed knowledge of the chemical composition of the organic soluble fraction and the related properties, such as solubility, is mandatory to describe appropriately the aerosol water uptake in sub- and supersaturated regimes for aerosols 20
containing a large amount of organic matter. In fact, the molecular characterization of the WSOC fraction in terms of classes of compounds and of their relative molecular weights and acidic properties, without any information on the solubility of compounds, may be sufficient to predict aerosol activation, but highly overestimates the observed DGFs. The agreement between the predicted and measured DGFs is substantially 25
ACPD
5, 5253–5298, 2005
Organic aerosol and modeling aerosol hygroscopicity and activation M. Mircea et al. Title Page Abstract Introduction Conclusions References Tables Figures J I J I Back Close
Full Screen / Esc
Print Version Interactive Discussion
EGU
if the limited solubility of organic model compounds is taken into account. Moreover, the uncertainties in the definition of organic model compounds related to the solubility and the molality in solution have a greater impact on DGF prediction than on CCN prediction.
Furthermore, the inorganic fraction of aerosol alone does not explain aerosol ac-5
tivation or sometimes the growth of aerosol particles at 90% relative humidity: the disagreement between predictions and mean observations is much higher for CCN number concentrations than for DGFs for all the aerosol samples studied. The small difference between the observed and predicted DGFs, considering only the inorganic fraction, may be explained by the fact that at 90% RH the hygroscopic growth of aerosol 10
is dominated by inorganic salts, since very few slightly soluble organic compounds are dissolved. By contrast, the marked discrepancies between observed and predicted CCN are to be attributed to the large contribution of organic compounds, almost fully dissolved in the supersaturated regime, which are not considered in the simulations where only inorganic soluble mass is present. Such discrepancies increase with in-15
creasing supersaturation. Because the organic model compounds responsible for wa-ter uptake in the Amazon basin are largely accounted for by slightly soluble species (which do not fully dissolve in the sub-saturated regimes), the H-TDMA measurements tend to underestimate the soluble aerosol fraction, and thus to underpredict the CCN number concentration (Vestin et al., 20052), especially at high supersaturations. Infer-20
ring the aerosol soluble fraction from H-TDMA measurements in subsaturated regimes is an approach with higher time resolution. However, it leads to underpredictions of CCN number concentrations when the aerosols contain a large amount of slightly solu-ble organic compounds, or the properties of the organic compounds (especially molec-ular weight, degree of dissociation and solubility) are too different from those of the 25
inorganic salt chosen to represent the soluble organic fraction of aerosol.
The degree of dissociation of organic compounds is another unknown parameter for aqueous solutions containing inorganic and organic species, and thus, another source of uncertainty in DGF and CCN predictions. In this paper, the DFGs and CCN
num-ACPD
5, 5253–5298, 2005
Organic aerosol and modeling aerosol hygroscopicity and activation M. Mircea et al. Title Page Abstract Introduction Conclusions References Tables Figures J I J I Back Close
Full Screen / Esc
Print Version Interactive Discussion
ber concentrations have been calculated considering the two extreme states in which organic compounds can exist: completely dissociated and undissociated. The results of the two scenarios show that the dissociation of the organic acids more greatly af-fects the CCN number concentration predictions than the DGF predictions. In addition, comparison with observations suggests that the organic acids are neither completely 5
dissociated nor undissociated, but have an intermediate degree of dissociation. Overall, the results of the present study show that the choice of model or surrogate organic compounds that represent the WSOC aerosol fraction cannot be arbitrary, but should be based on a detailed knowledge of the chemical composition and associated physical and chemical properties. The aerosol water uptake at sub and supersatu-10
rated regimes cannot be modeled realistically without representative organic model compounds, especially in systems where organic mass dominates, containing slightly soluble organic compounds, which dissolve gradually at different humidities.
Given the good agreement between the simulations based on a knowledge of WSOC and their properties, and the observations, we derived parameterizations for calculated 15
CCN spectra, which can be used in large-scale models to simulate cloud formation and evolution over the Amazon basin during the dry, transition and wet periods. The new CCN parameterizations comprise all the variability caused by the chemical effects (surface tension, molecular composition, solubility, degree of dissociation of WSOC) and provide a basis on which to study the impact of chemical composition in more 20
complex atmospheric models.
Acknowledgements. This work was carried out within the frame work of the Smoke, Aerosols, Clouds, Rainfall, and Climate (SMOCC) project, a European contribution to the Large-Scale Biosphere-Atmosphere Experiment in Amazonia (LBA). It was financially supported by the
En-vironmental and Climate Program of the European Commission (contract N◦
EVK2-CT-2001-25
00110 SMOCC), the Max Planck Society (MPG), the Italian Ministry of Environment (Italy-USA Cooperation on Science and Technology of Climate Change), the Italian Ministry of Education, University and Research (Project FISR Modellistica Molecolare), the Fundac¸ ˜ao de Amparo `a Pesquisa do Estado de S ˜ao Paulo, and the Conselho Nacional de Desenvolvimento Cient´ıfico (Instituto do Mil ˆenio LBA). We thank all members of the LBA-SMOCC and LBA-RACCI Science
ACPD
5, 5253–5298, 2005
Organic aerosol and modeling aerosol hygroscopicity and activation M. Mircea et al. Title Page Abstract Introduction Conclusions References Tables Figures J I J I Back Close
Full Screen / Esc
Print Version Interactive Discussion
EGU
Teams for their support during the field campaign, especially A. C. Ribeiro, M. A. L. Moura, J. von Jouanne, L. Tarozzi.
References
Andreae, M. O.: Soot carbon and excess fine potassium: long-range transport of combustion-derived aerosols, Science, 220, 1148–1151, 1983.
5
Andreae, M. O. and Andreae, T. W.: The cycle of biogenic sulfur compounds over the Amazon Basin, I, Dry season, J. Geophys. Res., 93, 1487–1497, 1988.
Andreae, M. O., Rosenfeld, D., Artaxo, P., Costa, A. A., Frank, G. P., Longo, K. M., and Silva-Dias, M. A. F.: Smoking rain clouds over the Amazon, Science, 303, 1337–1341, 2004. Artaxo, P. and Hansson, H. C.: Size distribution of biogenic aerosol particles from the Amazon
10
Basin, Atmos. Environ., 29, 393–402, 1995.
Charlson, R. J, Seinfeld, J. H., Nenes, A., Kulmala, M., Laaksonen, A., and Facchini, M. C.: Reshaping the theory of cloud formation, Science, 292, 2025–2026, 2001.
Cohard, J. M., Pinty, J. P., and Bedos, C.: Extending Twomey’s analytical estimate of nucleated cloud droplet concentrations from CCN spectra, J. Atmos. Sci., 55, 3348–3356, 1998.
15
Crutz, C. N. and Pandis, S. N.: A study of the ability of pure secondary organic aerosol to act as cloud condensation nuclei, Atmos. Environ., 31, 2205–2214, 1997.
Decesari, S., Fuzzi, S., Facchini, M., et al.: Characterization of the organic composition of aerosols from Rond ˆonia, Brazil, during the LBA-SMOCC 2002 experiment and its represen-tation through model compounds, Atmos. Chem. Phys. Discuss., accepted, 2005.
20
Dusek, U., Covert, D. S., Wiedensohler, A., Neususs, C., Weise, D., and Cantrell, W.: Cloud condensation nuclei spectra derived from size distributions and hygroscopic properties of the aerosol in coastal south-west Portugal during ACE-2, Tellus, 55B, 35–53, 2003.
Garstang, M., Scala, J., Greco, S., et al.: Trace gas exchange and convective transports over Amazonian rain forest, J. Geophys. Res., 93, 1528–1550, 1988.
25
Ferek, R. J., Reid, J. S., Hobbs, P. V., Blake, D. R., and Liousse, C.: Emission factors of hydrocarbons, halocarbons, trace gases and particles from biomass burning in Brazil, J. Geophys. Res., 32 107–32 118, 1998.
Facchini, M. C., Mircea, M., Fuzzi, S., and Charlson, R. J.: Cloud albedo enhancement by surface-active organic solutes in growing droplets, Nature, 401, 257–259, 1999.