HAL Id: hal-01057544
https://hal.archives-ouvertes.fr/hal-01057544
Submitted on 23 Sep 2014HAL is a multi-disciplinary open access archive for the deposit and dissemination of sci-entific research documents, whether they are pub-lished or not. The documents may come from teaching and research institutions in France or abroad, or from public or private research centers.
L’archive ouverte pluridisciplinaire HAL, est destinée au dépôt et à la diffusion de documents scientifiques de niveau recherche, publiés ou non, émanant des établissements d’enseignement et de recherche français ou étrangers, des laboratoires publics ou privés.
High-contrast ultrafast imaging of the heart
Clement Papadacci, Mathieu Pernot, Mathieu Couade, Mathias Fink, Mickaël
Tanter
To cite this version:
Clement Papadacci, Mathieu Pernot, Mathieu Couade, Mathias Fink, Mickaël Tanter. High-contrast ultrafast imaging of the heart. IEEE Transactions on Ultrasonics, Ferroelectrics and Frequency Control, Institute of Electrical and Electronics Engineers, 2014, Volume:61 Issue: 2, pp.0885-3010. �10.1109/TUFFC.2014.6722614�. �hal-01057544�
High Contrast Ultrafast Imaging of the Heart
Clement Papadacci1-4, Mathieu Pernot1-4, Mathieu Couade5, Mathias Fink1-4,
Mickael Tanter1-4
1
Institut Langevin, ESPCI ParisTech, Paris, 75005 France;
2
CNRS, UMR 7587, Paris, 75005 France;
3
INSERM, U979, Paris, 75005 France;
4
Université Paris Diderot-Paris7, Paris, 75013 France;
5
SuperSonic Imagine, Aix-en-Provence, 13857 France;
Corresponding address: papadacci.clement@gmail.com
Institut Langevin, ESPCI
1 rue Jussieu, 75005 Paris, France
Tel: +33 1 80 96 33 43
C. Papadacci, M. Pernot, M. Fink, M. Tanter are with Institut Langevin, Ecole Superieure de Physique et
Chimie Industrielles (ESPCI), CNRS UMR 7587, INSERM, U979, 75005, Paris, France and withUniversité
Paris Diderot-Paris 7, 75013, Paris, France
Abstract
Non-invasive ultrafast imaging ofintrinsic waves such as electromechanical waves or remotely induced
shear waves in elastography imaging techniques for human cardiac applications remains a big challenge.In
this paper we propose to perform ultrafast imaging of the heartwith adapted sector size bycoherently
compounding diverging waves emitted from a standard transthoracic cardiac phased-array probe. As
inultrafast imaging with plane wave coherent compounding, diverging waves can be summed coherently to
obtain high-quality images of the entire heart at high frame rate in a full field-of-view. To image the
propagation of shear waves with a largesignal-to-noise ratio (SNR), the field-of-view can be adapted by
changing the angular aperture of the transmitted wave. Backscattered echoes from successive circular wave
acquisitions are coherently summed at every location in the image to improve the image qualitywhile
maintaining very high frame rates. The transmitted diverging waves, angular apertures and subapertures
sizeswere testedin simulation and ultrafast coherent compounding was implemented in a commercial
scanner. The improvement of the imaging quality was quantified in phantoms and inone human heart, in
vivo.Imaging shear wave propagation at 2500 frame/s using 5 diverging waves provided a large increase of
the SNR of the tissue velocity estimates while maintaining a high framerate. Finally, ultrafast imaging with
1 to 5 diverging waves was used to image the human heart at a frame rate of4500-900frames/s over an entire
cardiac cycle. Spatial coherent compounding provided a strong improvement of the imaging quality, even
with a small number of transmitted diverging waves and a high frame rate, which allows imaging the
Index Terms :
Ultrafast Imaging,Diverging waves, Spatial coherent compounding, Shear wave imaging,Cardiac Imaging,
I. Introduction
Echocardiography is the most common modality used to image the human heart in real time. Typical frame
ratesin two-dimensional echocardiography are 30-100frames/s, which allowvisualizingthe heart motion
andquantifying myocardial velocities and strainsduring the cardiac cycle[1],[2]. However,such frame rates
are insufficient to trackmechanical waves such as remotely induced shear waves[3],[4],[5]intrinsic shear
waves[6]or electromechanical waves[7],[8]because of their high propagation speed in the myocardium
(between 1 and 10 m/s).
In ultrasound imaging, the frame rate is limited by the number of transmitted ultrasound beams neededto
construct an image.Many approaches have been developed to reduce the number of transmits, often at the
cost of a lower spatial resolution or a reduced field-of-view. In 1977, an original approach based on an
optical processing system to process the ultrasonics signals [9]wasproposed by Bruneel et al. They obtained
the first images of the cardiac muscle acquired at 5000 frames/s. However, theacousto-optics system
required to implement this technique was too complex and this concept was abandoned.In 1984, Shattuck et
al [10] introduced a parallel beamforming system driving conventional imaging probes.In the conventional
transmit focusing mode, the increase of the frame rate is typically achieved through the reduction of the
number of beamformed lines in transmit, which either reduces the sector size or the line density of the
image. Successive focused, ECG-gated acquisitions at high frame rates have also beenproposed to maintain
a largeline density and sector[7],[8]but this approach cannot be used for real-time imaging of single
heartbeats or shear wave imaging.The concept of ultrafast imaging using non-focused transmit
waves[11],[12],[13],[14],[15],[16]has been proposed to drastically reduce the number of transmits
whilemaintaining the number of scan lines and the image size. The transmission of plane waves by linear
transducer arrays have been successfully implemented on commercial scanners to image the propagation of
remotely induced shear waves at frame rates up to 10,000 images/seconds in many organs of human subjects
including the breast[17], the liver[18], the carotid artery[19], thecornea [20] and in the heart [3],[21],where it
provides a non-invasive way to access the myocardial contractility[5]. Moreover, successive
coherently to increase the poor image quality obtained by using only one plane wave both in terms of
contrast and resolution. This technique known asplane wave spatial compounding[23] has been shown to
rapidly improve the image quality with the number of transmits without sacrificing the frame rate. With only
2 to 20 transmits, coherent spatial compound imaging can thus recreate a synthetic focus in transmit
everywhere in the image as it is done in synthetic aperture imaging techniques (STA)[24]but with high
frame rateand large apertures for high signal to noise ratio (SNR). STA was originally introduced in the field
of ultrasonic imaging as a way to improve contrast and resolution of ultrasonic images by achieving
dynamic focusing both in transmission and in reception. Driven by the need of higher frame rates, in
particular for real-time 3-D imaging, sparse STA imaging techniques have then been proposed
[24],[25],[26],[27]. These techniquescan increase the frame rate by reducing the number of STA transmits
at the cost of lower resolution,more important side lobes, and lower signal-to noise-ratios (SNR).
Ultrafast imaging with coherent plane-wave compounding as well as sparse STA enables very high frame
rate imaging (>1000 image/s) using only one to five transmits. In practical situations, the two techniques
mainly differ in the diffraction of the transmitted beams, the amplitude of the plane wave being almost
unaffected during wave propagation, which provides higher SNR at large depths. The geometry of the field
of view differs also in the two techniques. For applications that require large fields of view such as
transthoracic cardiac imaging, the plane wave approach remains too limited. Transthoracic phased array
probes have small apertures that generate narrow plane waves, which cannot cover the entire heart with a
large sector.
Moreover, the coherent compound technique becomes rapidly inefficient when the imaging depths is large
in comparison with the apertures, because the plane waves transmitted at different angles do not overlap in
the region of interest. On the other hand, sparse STA allows imaging a large sector but at the cost of a lower
SNR. In applications of ultrafast imaging such as shear wave imaging, very small tissue displacements are
generated and high SNR is crucial to ensure the quality of the displacement estimation. Moreover, in many
cases, such as shear wave imaging or ultrafast Doppler imaging there is not necessary the need to image the
full sector. In these situations, a reduced field of view could be used to increase the SNR and improve the
Based on our previous development of coherent compound plane waves, we propose to adapt this approach
to ultrafast imaging with diverging waves in order to track the propagation of remotely induced and natural
mechanical waves in the heart. The approach is similar to the method proposed by[26],[27],[28],[29] in the
framework of STA, by placing several virtual sources behind the probes in order to achieve real-time 3D
imaging. Hasegawa,Kanai and other groups [15] have also proposed a similar approach using diverging
beams transmitted along several direction to cover the entire sector (15 transmits in [30]). Contrary to this
approach, we propose here to transmit at very high frame rate, one or more diverging waves that insonifies
the entire field of view in order to achieve ultrafast imaging of the heart. In this paper, we focus on the
practical implementation of this technique for 2-D ultrafast imaging of mechanical waves in the heart using
a transthoracic phased array. First, we investigated numerically the positions of the virtual point sources in
different situations to maximize the imaging quality and the SNR. Experiments were then performed in
phantoms using a cardiac phased array to quantify the image quality increase in B-mode and shear waves
velocity images
II. Simulation
A. Principles
In this part, the coherent summation of multiple diverging waves was performed analytically in order to
investigate the synthetic focus achieved in transmit. In twodimensions, each transmitted circular wave was
Fig. 1: Principle of Coherent Compounding with diverging waves. Three diverging waves defined by their virtual source (red crosses at𝑟𝑛) spaced by a virtual pitch p, are sent independently with a phased array probe directly in contact with the region of interest. Each diverging wave is backscattered by heterogeneities and
the array receives the corresponding echo. Beamforming is performed applying delays corresponding to a constructive interference of these diverging waves at the focal point𝑟𝑐. Fig. 1(b). By changing the delay
applied to each backscattered echoes from (a), the resulting waves can interfere and virtually focus at
different depth as in Fig. 1(c) and laterally as in Fig.1(d).
The principle of coherent compounding with diverging waves is illustrated in Fig. 1. The choice of the
position of virtual sources is crucial and can lead to very different results. For example, in synthetic aperture
imaging techniques, the virtual sources usually coincide with the transducer elements and the diverging
waves are successively generated by each elements to restore a high quality synthetic image[24]. However,
at high frame rate, only a small number of diverging waves can be transmitted. In this case,if the virtual
sources are superimposed onto probe elements, the total energy emitted is reduced and the large
distancebetween sources will induce side-lobes in the synthetic transmit field.To overcome this situation, the
use of virtual sources placed behind the transducer was proposed [26].
Then, the main question is:Where should the virtual sources be positionedin order to maximize the image
quality keeping a very high frame rate?
Let's consider a virtual array of N punctual sources (from –m to m)located behind the probe at positions
𝑟𝑛
𝑥𝑛
0
𝑧𝑛 where 𝑧𝑛is kept constant for all the sourcesand 𝑥𝑛 = 𝑛 𝑝, where 𝑝 is the pitchof the virtual array. If weapply the coherent summation of the acoustic fields generated by each diverging wave at a point 𝑟𝑐
𝑥𝑐 0 𝑧𝑐 of space over the bandwidth (𝑘1, 𝑘2), we can write the field Φ 𝑟 as:
Φ 𝑟 = 𝐴 𝑘 𝑘2 𝑘1 𝑒𝑗𝑘 𝑟−𝑟𝑛 𝑟 − 𝑟𝑛 . 𝑒 −𝑗𝑘 𝑟𝑐−𝑟𝑛 𝑚 𝑛=−𝑚 𝑑𝑘 (1)
where 𝑒−𝑗𝑘 𝑟𝑐−𝑟𝑛 is the phase correction needed to achieve the coherent summation at 𝑟𝑐 and𝐴 𝑘 is the
amplitude.Equation 1 can be simplified byconsidering the monochromatic far-field approximation at a focal distance F,near the central line (𝑥 = 0):
Φ 𝑥 ≈ 𝐴(𝑘)𝐹1 sin(𝑘 𝑝 𝑥 − 𝑥sin(𝑘 𝑝 (𝑥 − 𝑥𝑐 𝑁/2𝐹)
𝑐)/2𝐹) (2)
where 𝑁 = 2𝑚 + 1 is the number of virtual sources (the complete derivation is given in the appendix). From this expression, we can derive the dimension of the main lobe and thepositions of the side lobes in the
monochromatic case at the center frequency.
With 𝑋 = 𝑥 − 𝑥𝑐 , zeros occur when:
𝑘 𝑝
2𝐹𝑁 𝑋 = 𝑙𝜋, 𝑙 ∈ ℤ − {𝑁𝑘′; 𝑘′ ∈ ℤ} or, in other terms,
𝑋0 =
𝜆 𝐹
𝑝 𝑁𝑙, 𝑙 ∈ ℤ − {𝑁𝑘′; 𝑘′ ∈ ℤ}
(3)
(4)
Where the wavelength 𝜆 is given by 2𝜋𝑘. We see in (4)that the width of the principal lobe decreases with the total aperture of the virtual array, which results in an improvement of the lateral resolution as the number of
transmits or the virtual pitch increases.
Global maxima of the pressure field occur when:
𝑘 𝑝 2𝐹𝑋 = 𝑙𝜋, 𝑙 ∈ ℤ ⇒ 𝑋𝑚𝑎𝑥 =𝜆 𝐹 𝑝 𝑙, 𝑙 ∈ ℤ (5) (6)
𝑋𝑚𝑎𝑥 is the position of grating lobes. Equation (6) shows that, as the pitch p between virtual sources
To be strictly accurate, the elements width and the subapertures size should be considered in this derivation.
Furthermore, it is only true for compounding on the central line in the far field. Therefore, at a distance of
several centimeters, this equation can be used to investigate the focus and the grating lobes at a lateral
distance of several millimeters.However, the derivation gives an idea of how thesynthetic pressure field
varies in terms of maxima and zeros with respect to the number of virtual sources and their position, which
shows that the total aperture should be maximized to increase the lateral resolution and the distance between
sources should be minimized to decrease the grating lobes.
B. Numerical simulations
A standard phased-array probe of 64 elements with 0.28-mm pitch, 13-mm height, a center frequency of
2.7-MHz (100% bandwidth), and a 60-mm elevation focus was implemented in Field II[31],[32]. The
coordinates of the elements were set as 𝑥𝑒
0
0 . The sampling frequency of acoustic pulses was 200MHz. The acoustic field transmitted from each virtual source placed behind the probewas calculated usingField II. For
more than one transmit, spatial coherent compoundingwas performed as shown in figure 1. More
specifically, the transmit delays associated with the virtual source coordinates 𝑥𝑛 0 𝑧𝑛 were calculated as : 𝑑𝑒𝑙𝑎𝑦 = 𝑧𝑛2+ (𝑥 𝑒 − 𝑥𝑛)2/𝑐 (7)
where c is the speed of sound in soft tissues 1540 𝑚. 𝑠−1 . Simulations of the synthetic acoustic field (the
acoustic field from each transmit summed with spatial coherent compounding)were performed to investigate
the dependence of the virtual sources upon the position, the size of the transmit apertures (subapertures), and
the number of virtual sources.
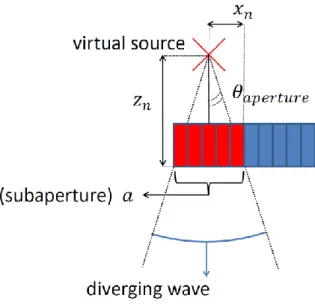
Fig. 2. The virtual source is placed at a distance 𝑧𝑛 fromprobe. It is placed at the center of the subaperture a. The diverging wave is transmitted over the entire field of view.
The angular aperture of the transmitted beam is important to define the field of view achieved in the final
image. In this study we assume that the transmitted wave must be symmetrical and homogeneous over the
entire sector image. Therefore, the virtual point source must be placed at the center of the transmit
subaperture(e.g. figure 2). Angular aperture for each transmits is defined geometrically by:
𝜃𝑎𝑝𝑒𝑟𝑡𝑢𝑟𝑒 = 2 arctan
𝑎 2
𝑧𝑛 (8)
where 𝑎is the size of the subaperture (number of elements which participate to the diverging wave transmission as shown in figure 2) and𝑧𝑛 is the virtual source position on the z-axis relative to the ultrasound
Fig. 3. Normalized synthetic pressure field for three angular apertures (70°, 90°, 110°). Three virtual sources were placed at (𝑥𝑛 = [-5.9;0;5.9]-mm)with subaperture of 21 elements centered on each virtual source. Coherent summation was performed at a depth of 60 mm a) on the central axis and b) on the side at 60 mm.
c) 2D normalized synthetic pressure distribution obtained for the different configuration.
Figure3 shows the synthetic pressure field from three diverging waves. Coherent summationwas
performedat a 60-mm depth at two extreme lateral positions of the field of view: on the central line (top of
fig.3) and on the edge of a 90° sector (bottom of fig.3). Three different transmitted angular apertures are shown (70°,90°,110°).The angular aperture variation was obtained by varying𝑧𝑛, with subapertures of21 elements.Lateral positions of the virtual sources were placed in the middle of the 21 elements subapertures respectively at a position𝑥𝑛 = [-5.9;0;5.9]mm.The left hand side of figure 3, shows the synthetic pressure
distributionon an arc of circle at a 60 mm depth where coherent summation is made. The right hand side of
figure3, shows this pressure distribution in the entire space.
Approximately the same focus is obtained on the central axis with the three angular apertures, whereas the
off-axis focusing capacity varies with the angular aperture. The steering capability depends strongly on the
angular transmit aperture. Figure3 shows that an angular aperture of more than 90° is required to lower the
grating lobes generated on the central axis and to achieve a good focusing on the off axis position at 𝜋4
The other important dimension of the transmit aperture is its physical extent on the transducer array. This
parameter was already investigated by Lokwood et al[26]who showed that the signal to noise ratio improved
with the square root number of elements as ~N1/2.
Fig. 4. (a) Simulation of thenormalized pressure field of one diverging wave for an angular sector of 90° at a
depth of R=6 cm for increasing number of transmit elements (1 to 64). (b) Simulated maximum synthetic
pressure and (c) resolution when three sources located at the center of the subaperturewere used as a
function of subaperture size (red plot). The associated resolution (inverse of the main lobe -6dB width) when
virtual sources were placedat the center of subaperture is plotted in blue (c).
Figure4 shows the pressure field 60mm away from the transducer as a function of the size of the transmit
subaperture. The subapertures were defined in numbers of elements.One virtual source was placed at their
center. The virtual source position on the z-axis was varied, regarding subaperture size, to keep an angular
aperture of 90°. As shown in figure4, the transmitted pressure increases with the number of elements. With
only one transmit element, such as in conventional synthetic aperture imaging, less than 10% of the pressure
transmitted by the entire array is obtained. On the other hand, large subapertures do not allow a large virtual
pitch p(as virtual sources are placed at the center of subapertures) which is required to improve the lateral
resolution (equation 4). Therefore, to maximize the resolution, the transmit subaperture must be as small as
possible. A transmit subaperture of approximately 20 elements is a good tradeoff to obtain a high pressure
(more than half of the pressure transmitted with the entire probe) and a wide variety of possible virtual
D. Lateral positions of the virtual sources
Fig. 5. Normalized transmitted pressure field for different virtual pitch (p). The virtual sources were placed
at the center of 21 element subapertures. Three different distances between virtual sources (1.4, 2.8, 5.6 mm)
are compared. Coherent summation was made at a depth of 60 mm a) on the central axis and b) on the side
at 60 mm are compared. c) 2D normalized synthetic pressure distribution obtained for the different
configuration.
Figure 5represents the synthetic transmitted pressure field obtained for three different virtual source
pitches.Three diverging waves were usedand coherent summation was performed at a 60-mm depth at two
lateral positions in the field of view: on the central line (top of figure 5) and on the edge of a 90° sector
(bottom of figure 5). The angular aperture (100°) and the subaperture (21 elements) were kept constant. A
virtual source was placed on the central axis and the two others are placed symmetrically at a varying
distance (1.4, 2.8, and 5.6 mm).In agreement with equation 4,we found that the lateral resolution increases
with the virtual source pitch. The widths of the main lobe at -6 dB are 11mm, 5.5 mm,and 2.8mm,
respectively. On the other hand, the grating lobes move closer to the focus when the spacing is enlarged. It is
in good agreement with the grating lobe position derived from equation6.
Because the number of transmitted waves determines the maximum frame rate achievable, it is important to
determine how fast the image quality improves with the number of diverging wavesin ultrafast imaging
applications. The virtual sources were placed behind the probe at a distance 𝑧𝑛 = 2.94 mm. Each virtual sourcewas positioned at the center of a21-element subaperture (e.g. figure 2 (a)). These parameters were set to get a 90° angular aperture according to equation (8). The first virtual source was placed at 𝑥𝑛 = 0 (center of transducer array). The number of diverging waves was then increased by adding virtual sources around
the first virtual source placed at the center. For three transmits,we added two virtual sources on the edge of the transducer array (𝑥𝑛 =[-5.9;0;5.9]-mm). This way, the distance between the two extreme sources was maximized to get a good resolution andallowed positioning the sources in the middle of a 21 elements
subaperture. Then two virtual sources were added between the previous three to obtain five transmits (lateral source positions𝑥𝑛 =[-5.9;-2.95;0;2.95;5.9]mm) and so on. Additionally, conventional focusing in reception was performed at the transmit focus location to investigate the final image quality.
Fig. 6. Normalized synthetic pressure field at two points of space (center, side) for a 90° sector at a 60-mm
depth against lateral position. The transmit-receive synthetic fields induced by compounding 1, 3,5,15,43
when the number of diverging waves increases and converge toward focused emission. Normalized PSF for
1, 3 diverging waves and focused at the centerwere also simulated.
Figure6 shows the focusing quality improvement with the number of transmits (onpressure amplitude and
PSF). The pressure level at the center axis was evaluated for the steered focus. We found -24 dB for one
diverging wave, -42.4 dB, -51.2 dB, -60.3 dB, -68.1 dB for 3, 5, 15, 43 diverging waves respectively .A
large improvement is achieved with only 3 transmits, particularly offaxis where the mean pressure level is
reduced by 18.4dB. Focusing is then progressively improved with the number of transmits, and with 43
transmits, the focus becomes comparable to conventional focusing. The normalized point spread functions
(PSF) for 1, 3 diverging waves and focused are also displayed to illustrate the improvement. It shows that
with coherent compound imaging a small number of transmits enables a major improvement of the focusing
quality while maintaining a high frame rate.
III. Experiments
A. Coherent diverging-wave compoundingin a heart phantom
The imaging quality was assessed experimentally in a heart phantom (CIRS, model 067). A standard phased
array probe (64 elements, 2.7-MHz central frequency, Vermon, France)with the same characteristicsas the
one used in simulationswas used to image the phantom. The technique of coherent diverging-wave
compoundingwas implementedin realtime on an ultrafast scanner (Aixplorer, SuperSonic Imaging,
France).The imaging depth was set to 12 cm. The number of emitted diverging waves was varied from 1 to
20 diverging waves, providing a frame rate between4600 and 230 frames/s, respectively. A sequence with
conventional focusing in transmit (160focused transmits at 60 mm) was also used for comparison. In
reception, conventional, dynamic-focusing beamforming with full aperture was performed for
allacquisitions. The magnitude of the beamformed IQ datawas normalized. Each depth was normalized by
the maximum magnitude at this depth. It was then scan-converted and log-compressed to obtain the final
B-mode image with a 50-dB dynamic range. This normalization provides the contrast variation as a function of
The angular aperture was set to 90°, the subapertureswere composed of 21 elements, and virtual source positions (𝒙𝒏) were the same as in part II.5.
Fig. 7. Comparison between four configurations using a different number of diverging waves and
conventional focusing on a heart phantom. The average clutter signal level was evaluated at several
Figure 7 shows the improvement of the imaging quality with the number of diverging-wave transmits. One
can notice the improvement of both the lateral resolution and the SNR (signal-to-noise ratio) between a
single diverging wave transmitted (e.g. figure7 (a)) and the image made of several transmits (e.g. figure7
(b),(c),(d)).A strong improvement is found for configurations relying on a small number of transmits, e.g., 3
or 5. With only 15 diverging waves (e.g. figure7 (d)) the image quality is qualitatively comparable with the
one obtained with conventional focusing (e.g. figure 7 (e)). The mean clutterlevel was assessed by averaging
the absolute magnitudes of normalized images in the four cardiac cavities (red squares in figure 7
(f)).Figure7 (f) shows alarge improvement in the SNR (-25dB to -36.5dB) when the number of waves is first
increased from 1 to 15 diverging waves,after which the improvement becomes less important (36.5dB to
-37dB from 15 diverging waves to 20 diverging waves respectively). The clutter level of conventional
focusingwas also assessed (38.5dB). With only 15 diverging waves the SNR is only 2dB lower than the
SNR ofthe focused mode. Nevertheless,the important result here is the improvement of clutter level in the
ultrafast imaging range, i.e., 1 to 10 diverging waves. For example, to achieve very high frame rates (~ 1000
images/sec) at a 12-cm depth, the number of transmits cannot exceed 5.
B. Ultrafast imaging of shear wave propagation
Coherent compounding of diverging waves wasevaluated for imaging the propagation of shear waves at very
high frame rate. Two different sequences weredesigned. The first one shows the improvement of coherent
compounding. The second one shows the impact of the angular aperture.
a) Number of transmits
The phasedarray probe described in part III.1was used to image abreastphantom(CIRS, model 059),in which
the shear wave velocity is approximately 2.3 m/s, and two phantoms made of Agar-gelatin(2% and
2%-10%), in which shear waves propagate at 1.3 m/s and 5.5 m/s respectively. A sequence wasdesigned to
remotely generateshear waves based on the radiation forceinduced by a focused ultrasonic burst[33],[34].
The pushing depth and duration wereset at 30mmand 300 µs, respectively. To image the shear wave
times in each phantom.The imaging depth was set to45 mm and the pulse repetition frequency (PRF) wasthe
same for all the acquisitions (12500 Hz). Different transmits schemes wereused to comparethe performances
of 1, 3 and 5 virtual sourceswhile keeping the same total number of transmits to highlight the influence of
focalization due to the spatial coherent compounding. For one virtual source, transmissionwas repeated at
the PRF and five successive acquisitions were averaged to form one image. With three virtual
sourcespositioned laterally at [-5.9;0;5.9]mm, the three different transmits were performed successively
followed by two additional lateral transmits, and the five acquisitions were used to form one compound
image. Finally, five virtual sources located at [-6.7;3.35;0;3.35;6.7]mm laterally and at a distance of 3mm
behind the probewere transmitted and used to form one image.Since shear waves propagate over a relatively
small distance, the imaging sector size was reduced andthe angular aperture associated with each virtual
source was set to 70°. Tissue velocities were obtained using a per pixel frame to frame 1D cross-correlation
on demodulated IQ images with an axial kernel size of 3 pixels (1.5 mm) to obtain images of tissue
frame-to-frame axial displacements. Figure8 showsthe tissue velocity generated by the shear waveduring its
propagation.An increase inthe SNR of the tissue velocity estimation and of the lateral resolution with the
Fig. 8. Tissue velocity images of shear wave propagation at 1.6ms after the push. Imaging with one (a), three
(b) and five (c) diverging wave(s) with the spatial coherent compound method. The tissue velocity at one
point of space (black cross) is plotted against time for the three configurations (d).
The SNR improvement can be seen on figure 8 (d). Fluctuations are more important when only one
diverging wave is used.
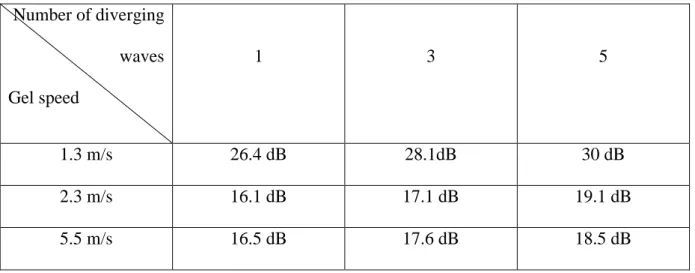
In order to quantify the improvement oftissue velocity estimations in the entire image the SNR was
calculated as follows for each set of acquisition and for the three different phantoms:
𝐒𝐍𝐑
= 𝐒𝟎 𝐱, 𝐳
𝛔𝐱𝐳 (9)
𝐒𝟎 𝐱, 𝐳 = 𝐦𝐚𝐱 𝐭 𝐒 𝐱, 𝐳, 𝐭 (10) S is the tissue velocity due to the shear wave and the amplitude of fluctuations is given by:
𝛔𝐱𝐳 = 𝐒 𝐱, 𝐳, 𝐭 − 𝐒 𝐱, 𝐳, 𝐭 𝟐 𝐭+𝐝𝐭
(11)
Where 𝐭 + 𝐝𝐭 is the time after the shear wave propagation. The mean SNRis presented in table 1 and shows a significant improvement of the SNR with the number of individual virtual sources.This increase is less
important in stiffer gelsdue to the higher shear wave speed,lower tissue velocities, and the competition
between frame rate and tissue velocity estimation e.g. figure 12 in discussion.
Number of diverging waves Gel speed 1 3 5 1.3 m/s 26.4 dB 28.1dB 30 dB 2.3 m/s 16.1 dB 17.1 dB 19.1 dB 5.5 m/s 16.5 dB 17.6 dB 18.5 dB
The dependence of the SNR on the transmitted angular aperture was investigated. With the same
phased-array probe, shear-wave imaging acquisition were performed with a pushing depth and durationset to30
mm, and300 µs, respectively. To image the shear wave propagation, 100 frames were acquired at the
frame rate of 2000 frames/s. The experiment was repeated three times. The imaging depth was55 mm
and the pulse repetition frequency (PRF) was kept the same for all the acquisitions (10000 Hz).
Laterally, five virtual sources were positioned at the location described in part a). Different transmit
schemes were used to compare the performances of angular apertures varying from 10° to 170°. Figure 9
(a),(b),(c) shows a largedifference in terms of SNR between the different angular apertures. Figure 9 (d)
quantifies the SNR in the push region as a function of angular aperture. HigherSNR is obtained by
reducing the angular aperture.
Fig. 9Three acquisitions with different angular apertures 30° (a), 80° (b) and 140°(c) are imaged. The SNR
within the push region is quantified for angular apertures from 10° to 140°.
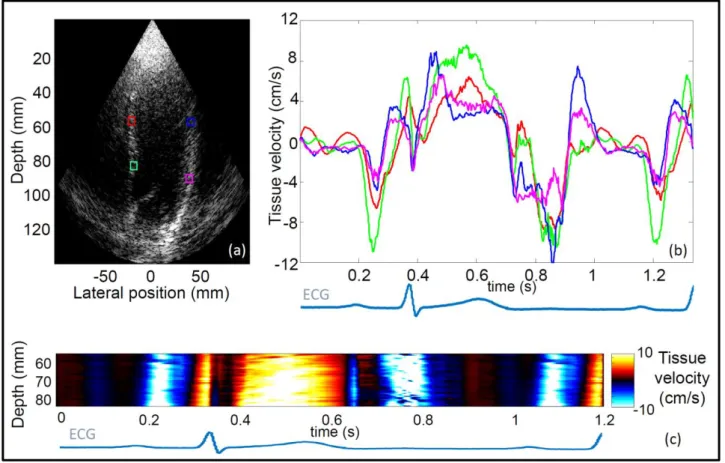
C. In vivo ultrafast imaging in a large sectorview of the human heart
Finally, we investigated the performance of ultrafast imaging of the human heart in vivo. The transthoracic
view. A standard focused B-mode running in real time at 30 frames/s was used to position the probe. An
ultrafast sequence was performed on the Aixplorer with 5 diverging waves with the virtual sources positions
described in III.1. The PRF was set to 4500 Hz, resulting in a frame rate of 900 frames/s. The acquisition
was triggered on the ECG. We recombined the backscattered signals off-line using three different
approaches. The first set of images was obtained by using only the central transmit acquisition (one virtual
source laterally placed in the middle of the probe). Then, the second set was obtained by spatial coherent
compounding of three virtual sources. Finally, the third set was obtained by applying the spatial coherent
compounding method on the five diverging waves.
Fig. 10. Tissue velocity map in an in vivo normal human heart superimposed on the B-mode image,
bothobtained using (a) 1, (b) 2, and (c) 5 diverging waves.The tissue velocity at one point of space (green
arrow) is plotted against time for the three configurations (d).
For each set, a standard frame to frame correlation technique was used to derive the tissue velocities in the
myocardium during time[33]. Figure 10 shows the velocity field combined linearly to the B-mode, a
cine-loop is attached to the figure. An improvement of the image quality was observedas the number of
compounded waves was increased, both in terms of contrast and resolution, along with a reduction of the
(d).This shows the possibility to improve the image quality over a large field of view and to keep at the same
time a high frame rate over one cardiac cycle, which is important for imaging applications such as
electromechanical and mechanical wave imaging (e.g. figure 11).
Fig. 11.(a) Four different locations in the heart and (b) their associated tissue velocities. (c)Spatial and
temporal tissue velocities along the septum over one cardiac cycle.
Figure 11 demonstrates the feasibility to obtain good tissue velocity estimation at every location of the heart
in the same acquisition.
IV. Discussion
In this paper, ultrafast imagingwas performed using diverging waves transmitted by a conventional phased
array probe over a large imaging sector. The method proposed here allows improving the contrast and
resolution for an ultrafast acquisition at very high frame rate (more than 1000 images/s). It should be noted
that the imaging quality remains lower than the one that can be achieved with high contrast
with the number of transmits, which allows maintaining a high frame rate,a large imaging sector, and a large
SNR simultaneously.
The focusing quality was investigated as a function of the virtual source positions and the technique was
implemented on a commercial scanner.
The feasibility of improving the imaging quality at high enough frame rate to image the propagation of shear
waves in the myocardium was shown in this study. Shear waves remotely induced by the phased-array probe
were imaged in a phantom at a depth of 45 mm at 2500 frames/susing 5 diverging waves. At such an
imaging depth, the anterior wall of the left ventricle for example should be reached in most of the patients in
a parasternal long-axis view to generate shear waves propagating along the septum or anterior wall.For
imaging at larger depth, the number of compounded waves needs to be reduced to two or three in order to
maintain the frame rate. As the quality of tissue velocity estimation is crucial to image correctly the shear
wave propagation, these results are promising and should help for the non-invasive real time elasticity
mapping of the human anterior wall.
We have also shown that spatial coherent compounding mayallow imaging the propagation of mechanical
waves in tissues due to the valves closures and electromechanical waves (typical speed in the range of 1-5
m/s)with higher quality. The electromechanical activation has been imaged at typical frame rates of
800-2000 images/s using single diverging waves [36],[37]. Using 5 waves, we have shown in vivo in the human
heart a strong improvement of both the B-mode and the velocity estimation quality compared to one
diverging wave imaging.
One important issue to deal with is the influence of motion artifacts on the coherent summation of
backscatteredechoes from successive virtual sources as pointed out by different groups [38],[39],[40].
Because fast tissue motion can occur during the cardiac cycle, the degradation of coherent summation
should be taken into account. Whereas a small number of diverging waves should not be influenced by
motion as the acquisition of the successive set of backscattered echoes is performed before significant tissue
motion, this problem could become critical for a large number of transmit diverging waves. One way to
estimate the maximum number of compounded diverging waves that can be used without affecting the
coherent summation of images due to motion artifacts between the first and last compounded diverging
wave transmission. It is known from the diffraction theory [41] that the loss of wave intensity at the focus is
equal to 𝟏 − 𝟏 − 𝟐𝝅 𝝀 𝟐 𝜹𝟒
𝟐
where 𝜹 is the aberration amplitude. For example, if we arbitrarily set the maximal intensity loss to 15%, aberrations amplitude must be smaller than 𝜹=𝝀/6 (from -𝝀/12 to 𝝀/12). In that case, it becomes possible to estimate the maximum number of compounded diverging waves that can be
used for a desired imaging depth and a maximum velocity while satisfying this criterion (one should notice
that such a criterion on the compounded image quality is much more severe than a criterion on the quality of
the tissue velocity estimate). Figure 12 presents the number of diverging waves that can be used with respect
to imaging depth (and consequently pulse repetition frequency) and maximum velocity estimation. One can
notice that a N=5 number of diverging waves permits an estimation of 15 cm/s maximum tissue velocities
for a 10 cm imaging depth while preserving any significant effect on the compounded ultrasonic image
quality and consequently tissue velocity estimation.
Fig 12. Maximum number of diverging waves insuring a motion artifact smaller than 𝜹 =𝝀 /6 between the first and last plane wave transmission as a function of imaging depth and local tissue velocity, for a
frequency of 2.5 MHz. The normal and physiological ranges for longitudinal myocardial velocities are in the
Doppler imaging of cardiac blood flows could also highly benefit from this technique. Blood flow mapping
in the heart is a very demanding application that requires a large field of view, a high frame rate and an
excellent imaging quality simultaneously to lower the clutter signal originating from the heart walls.
Coherent compound with diverging waves at high frame rate could be used to map the flow pattern in the
ventricles and obtain Doppler spectrum for each point of the map. Another advantage of such a compounded
high frame rate acquisition would be to provide both tissue and blood velocities simultaneously[42]. This
particular implementation of the technique will be presented in a future work.
Finally, the concept of compounded diverging waves could be also extended to other types of arrays. For
example, plane wave coherent compounding with linear arrays has the disadvantage to reduce the field of
view on the side of the images because the different plane wave transmits don't overlap. Diverging waves
V. Conclusion
We have investigated the use of spatial coherent compounding with diverging waves to obtain very high
frame rate acquisition of the heart while maintaining high tissue velocity estimation quality over a large
field-of-view. Simulations revealed that by optimizing the location of virtual sources, the image quality can
be improved strongly with a few transmits. The technique has been implemented on an ultrasound scanner
for cardiac applications and experiments were performed in phantoms with a cardiac phased array probe to
quantify and validate the improvement predicted by simulations. Motion and elasticity maps obtained
using spatial coherent compounding with diverging waves in phantoms during Shear Wave Imaging resulted
in higher SNR and resolution than with single source acquisitions. Finally, the method was used in the
human heart non-invasively over a large field of view during entire cardiac cycles at ultrafast frame rate
(900 frames/s). Improvements in image quality were consistent with simulations and phantom studies. This
technique has a strong potential to significantly improve the imaging of natural waves such as
Electromechanical waves and remotely-induced shear waves for elasticity mapping in the human heart in
APPENDIX
Expression of acoustic field 𝚽 𝒓 when coherent summation of the acoustic fields generated by each diverging wave at a point 𝒓𝒄
𝒙𝒄 𝟎 𝒛𝒄
of space over the bandwidth (𝒌𝟏, 𝒌𝟐) is made :
𝚽 𝒓 = 𝑨 𝒌 𝒌𝟐 𝒌𝟏 𝒆𝒋𝒌 𝒓−𝒓𝒏 𝒓 − 𝒓𝒏 . 𝒆−𝒋𝒌 𝒓𝒄−𝒓𝒏 𝒎 𝒏=−𝒎 𝒅𝒌 (A1)
In the far-field approximation, at a certain distance of the probe, near the central line 𝒙 = 𝟎, we can assume that: 𝒛𝒄− 𝒛𝒏 ≫ 𝒙 − 𝒙𝒏 . Let's consider the central line at a distance 𝒛𝒄 − 𝒛𝒏 = 𝑭.
Approximation can be made on the amplitude:
𝒓 − 𝒓𝒏 = ( 𝒙 − 𝒙𝒏 𝟐+ (𝒛 − 𝒛𝒏)𝟐)𝟏/𝟐= 𝒛 − 𝒛𝒏 𝟏 + 𝒙 − 𝒙𝒏 𝟐 𝒛 − 𝒛𝒏 𝟐 𝟏 𝟐 ≈ 𝒛 − 𝒛𝒏 = 𝑭
Approximation can also be made on the phase:
𝒓 − 𝒓𝒏 = 𝒙 − 𝒙𝒏 𝟐+ 𝒛 − 𝒛𝒏 𝟐 𝟏 𝟐 = 𝒛 − 𝒛𝒏 𝟏 + 𝒙 − 𝒙𝒏 𝟐 𝒛 − 𝒛𝒏 𝟐 𝟏 𝟐 ≈ 𝒛 − 𝒛𝒏 + 𝟏 𝟐 𝒙 − 𝒙𝒏 𝟐 𝒛 − 𝒛𝒏 = 𝑭 +𝟏 𝟐 𝒙 − 𝒙𝒏 𝟐 𝑭 Therefore: Φ 𝒙 ≈ 𝑨 𝒌 𝒌𝟐 𝒌𝟏 𝟏 𝑭 𝒆𝒋𝒌(𝑭+(𝒙−𝒙𝒏) 𝟐 𝟐𝑭) 𝒆−𝒋𝒌(𝑭+(𝒙𝒄−𝒙𝒏)𝟐 𝟐𝑭)𝒅𝒌 𝒎 −𝒎 (A2)
We can develop the expression:
𝚽 𝒙 ≈ 𝐴 𝑘 𝑘2 𝑘1 1 𝐹 𝑒𝑗𝑘 𝐹+ 𝑥 2+𝑥 𝑛2−2𝑥𝑥𝑛 2𝐹 𝑒−𝑗𝑘 𝐹+ 𝑥𝑐2+𝑥𝑛2−2𝑥𝑐𝑥𝑛 2𝐹 𝑑𝑘 𝑚 −𝑚 (A3)
Rearranging this expression: Φ 𝑥 ≈ 𝐴 𝑘 𝑘2 𝑘1 1 𝐹𝑒 𝑗2𝐹𝑘(𝑥2−𝑥 𝑐2) 𝑒𝑗𝑘𝐹𝑥𝑛(𝑥𝑐−𝑥)𝑑𝑘 𝑚 −𝑚 (A4)
For our periodic virtual sources array𝑥𝑛 = 𝑛 𝑝:
Φ 𝑥 ≈ 𝐴 𝑘 𝑘2 𝑘1 1 𝐹𝑒 𝑗2𝐹𝑘(𝑥2−𝑥 𝑐2) 𝑒𝑗𝑘𝐹 𝑛 𝑝 (𝑥𝑐−𝑥)𝑑𝑘 𝑚 −𝑚 (A5)
𝑒𝑛−𝑛 𝑗𝑘𝐹 𝑛 𝑝 (𝑥𝑐−𝑥)is a geometrical series that can be added explicitly, we end up with:
Φ 𝑥 ≈ 𝐴 𝑘 𝑘2 𝑘1 1 𝐹𝑒 𝑗2𝐹𝑘(𝑥2−𝑥 𝑐2)sin(𝑘 𝑝 𝑥 − 𝑥𝑐 2𝑚 + 1 /2𝐹) sin(𝑘 𝑝 (𝑥 − 𝑥𝑐)/2𝐹) 𝑑𝑘 (A6)
[1] J. D’hooge, A. Heimdal, F. Jamal, T. Kukulski, B. Bijnens, F. Rademakers, L. Hatle, P. Suetens, and G. R. Sutherland, “Regional Strain and Strain Rate Measurements by Cardiac Ultrasound: Principles,
Implementation and Limitations,” Eur J Echocardiogr, vol. 1, no. 3, pp. 154–170, Jan. 2000.
[2] G. R. Sutherland, B. Bijnens, and W. N. McDicken, “Tissue Doppler Echocardiography: Historical Perspective and Technological Considerations,” Echocardiography, vol. 16, no. 5, pp. 445–453, Jul. 1999.
[3] M. Couade, M. Pernot, E. Messas, A. Bel, M. Ba, A. Hagege, M. Fink, and M. Tanter, “In vivo quantitative mapping of myocardial stiffening and transmural anisotropy during the cardiac cycle,” IEEE
Trans Med Imaging, vol. 30, no. 2, pp. 295–305, Feb. 2011.
[4] R. R. Bouchard, S. J. Hsu, M. L. Palmeri, N. C. Rouze, K. R. Nightingale, and G. E. Trahey, “Acoustic Radiation Force-Driven Assessment of Myocardial Elasticity Using the Displacement Ratio Rate (DRR) Method,” Ultrasound in Medicine & Biology, vol. 37, no. 7, pp. 1087–1100, Jul. 2011.
[5] M. Pernot, M. Couade, P. Mateo, B. Crozatier, R. Fischmeister, and M. Tanter, “Real-time
assessment of myocardial contractility using shear wave imaging,” J. Am. Coll. Cardiol., vol. 58, no. 1, pp. 65–72, Jun. 2011.
[6] H. Kanai, “Propagation of spontaneously actuated pulsive vibration in human heart wall and in vivo viscoelasticity estimation,” IEEE Trans Ultrason Ferroelectr Freq Control, vol. 52, no. 11, pp. 1931–1942, Nov. 2005.
[7] M. Pernot, K. Fujikura, S. D. Fung-Kee-Fung, and E. E. Konofagou, “ECG-gated, mechanical and electromechanical wave imaging of cardiovascular tissues in vivo,” Ultrasound Med Biol, vol. 33, no. 7, pp. 1075–1085, Jul. 2007.
[8] J. Provost, W.-N. Lee, K. Fujikura, and E. E. Konofagou, “Electromechanical Wave Imaging of Normal and Ischemic Hearts In Vivo,” IEEE Trans Med Imaging, vol. 29, no. 3, pp. 625–635, Mar. 2010.
[9] C. Bruneel, R. Torguet, K. M. Rouvaen, E. Bridoux, and B. Nongaillard, “Ultrafast echotomographic system using optical processing of ultrasonic signals,” Applied Physics Letters, vol. 30, no. 8, pp. 371–373, Apr. 1977.
[10] D. P. Shattuck, M. D. Weinshenker, S. W. Smith, and O. T. von Ramm, “Explososcan: a parallel
processing technique for high speed ultrasound imaging with linear phased arrays,” J. Acoust. Soc. Am., vol. 75, no. 4, pp. 1273–1282, Apr. 1984.
[11] J.-Y. Lu and J. F. Greenleaf, “Pulse-echo imaging using a nondiffracting beam transducer,”
Ultrasound in Medicine & Biology, vol. 17, no. 3, pp. 265–281, Jan. 1991.
[12] L. Sandrin, S. Catheline, M. Tanter, X. Hennequin, and M. Fink, “Time-resolved pulsed elastography with ultrafast ultrasonic imaging,” Ultrason Imaging, vol. 21, no. 4, pp. 259–272, Oct. 1999.
[13] J.-Y. Lu, J. Cheng, and J. Wang, “High frame rate imaging system for limited diffraction array beam imaging with square-wave aperture weightings,” IEEE Trans Ultrason Ferroelectr Freq Control, vol. 53, no. 10, pp. 1796–1812, Oct. 2006.
[14] J. Provost, V. T.-H. Nguyen, D. Legrand, S. Okrasinski, A. Costet, A. Gambhir, H. Garan, and E. E. Konofagou, “Electromechanical wave imaging for arrhythmias,” Phys Med Biol, vol. 56, no. 22, pp. L1–11, Nov. 2011.
[15] L. Tong, H. Gao, H. F. Choi, and J. D’hooge, “Comparison of conventional parallel beamforming with plane wave and diverging wave imaging for cardiac applications: a simulation study,” IEEE Trans Ultrason
Ferroelectr Freq Control, vol. 59, no. 8, pp. 1654–1663, Aug. 2012.
[16] I. K. Ekroll, A. Swillens, P. Segers, T. Dahl, H. Torp, and L. Lovstakken, “Simultaneous quantification of flow and tissue velocities based on multi-angle plane wave imaging,” IEEE Trans Ultrason Ferroelectr
Freq Control, vol. 60, no. 4, pp. 727–738, Apr. 2013.
[17] M. Tanter, J. Bercoff, A. Athanasiou, T. Deffieux, J.-L. Gennisson, G. Montaldo, M. Muller, A.
Tardivon, and M. Fink, “Quantitative assessment of breast lesion viscoelasticity: initial clinical results using supersonic shear imaging,” Ultrasound Med Biol, vol. 34, no. 9, pp. 1373–1386, Sep. 2008.
[18] M. Muller, J.-L. Gennisson, T. Deffieux, M. Tanter, and M. Fink, “Quantitative viscoelasticity mapping of human liver using supersonic shear imaging: preliminary in vivo feasibility study,” Ultrasound
Med Biol, vol. 35, no. 2, pp. 219–229, Feb. 2009.
[19] M. Couade, M. Pernot, C. Prada, E. Messas, J. Emmerich, P. Bruneval, A. Criton, M. Fink, and M. Tanter, “Quantitative assessment of arterial wall biomechanical properties using shear wave imaging,”
Ultrasound Med Biol, vol. 36, no. 10, pp. 1662–1676, Oct. 2010.
[20] T.-M. Nguyen, J.-F. Aubry, D. Touboul, M. Fink, J.-L. Gennisson, J. Bercoff, and M. Tanter,
“Monitoring of cornea elastic properties changes during UV-A/riboflavin-induced corneal collagen cross-linking using supersonic shear wave imaging: a pilot study,” Invest. Ophthalmol. Vis. Sci., vol. 53, no. 9, pp. 5948–5954, Aug. 2012.
[21] R. R. Bouchard, S. J. Hsu, P. D. Wolf, and G. E. Trahey, “In Vivo Cardiac, Acoustic-Radiation-Force-Driven, Shear Wave Velocimetry,” Ultrason Imaging, vol. 31, no. 3, pp. 201–213, Jul. 2009.
[22] M. Tanter, J. Bercoff, L. Sandrin, and M. Fink, “Ultrafast compound imaging for 2-D motion vector estimation: application to transient elastography,” IEEE Trans Ultrason Ferroelectr Freq Control, vol. 49, no. 10, pp. 1363–1374, Oct. 2002.
[23] G. Montaldo, M. Tanter, J. Bercoff, N. Benech, and M. Fink, “Coherent plane-wave compounding for very high frame rate ultrasonography and transient elastography,” IEEE Trans Ultrason Ferroelectr Freq
Control, vol. 56, no. 3, pp. 489–506, Mar. 2009.
[24] J. A. Jensen, S. I. Nikolov, K. L. Gammelmark, and M. H. Pedersen, “Synthetic aperture ultrasound imaging,” Ultrasonics, vol. 44, pp. e5–e15, 2006.
[25] C. R. Cooley and B. S. Robinson, “Synthetic focus imaging using partial datasets,” in , 1994 IEEE
Ultrasonics Symposium, 1994. Proceedings, 1994, vol. 3, pp. 1539–1542 vol.3.
[26] G. R. Lockwood, J. R. Talman, and S. S. Brunke, “Real-time 3-D ultrasound imaging using sparse synthetic aperture beamforming,” IEEE Transactions on Ultrasonics, Ferroelectrics and Frequency Control, vol. 45, no. 4, pp. 980–988, 1998.
[27] G. R. L. C. R. Hazard, “Theoretical assessment of a synthetic aperture beamformer for real-time 3-D imaging,” Ultrasonics, Ferroelectrics and Frequency Control, IEEE Transactions on, no. 4, pp. 972 – 980, 1999.
[28] S. I. Nikolov, J. Kortbek, and J. A. Jensen, “Practical applications of synthetic aperture imaging,” in
2010 IEEE International Ultrasonics Symposium (UIS), 2010, San Diego, California, 2010.
[29] S. I. Nikolov, “Synthetic aperture tissue and flow ultrasound imaging,” Ph.d. dissertation,
Orsted-DTU, Technical University of Denmark, 2800, Lyngby, Denmark, 2001.
[30] H. Hasegawa and H. Kanai, “High-frame-rate echocardiography using diverging transmit beams and parallel receive beamforming,” Journal of medical ultrasonics, vol. 38, no. 3, pp. 129–140.
[31] J. A. Jensen, “Field: A Program for Simulating Ultrasound Systems,” in 10th Nordic-Baltic Conference
on Biomedical Imaging Published in Medical & Biological Engineering & Computing, pp. 351-353, Volume 34, Supplement 1, 1996, pp. 351–353.
[32] J. A. Jensen and N. B. Svendsen, “Calculation of pressure fields from arbitrarily shaped, apodized, and excited ultrasound transducers,” IEEE Transactions on Ultrasonics, Ferroelectrics and Frequency
Control, vol. 39, no. 2, pp. 262–267, 1992.
[33] J. Bercoff, M. Tanter, and M. Fink, “Supersonic shear imaging: a new technique for soft tissue elasticity mapping,” IEEE Trans Ultrason Ferroelectr Freq Control, vol. 51, no. 4, pp. 396–409, Apr. 2004.
[34] C. Papadacci, M. Pernot, M. Couade, M. Fink, and M. Tanter, “Shear Wave Imaging of the heart using a cardiac phased array with coherent spatial compound.” Ultrasonics Symposium (IUS), IEEE, 07-Oct-2012.
[35] O. Bonnefous and P. Pesqué, “Time domain formulation of pulse-Doppler ultrasound and blood velocity estimation by cross correlation,” Ultrason Imaging, vol. 8, no. 2, pp. 73–85, Apr. 1986.
[36] J. Provost, S. Thiébaut, J. Luo, and E. E. Konofagou, “Single-heartbeat electromechanical wave imaging with optimal strain estimation using temporally unequispaced acquisition sequences,” Phys Med
Biol, vol. 57, no. 4, pp. 1095–1112, Feb. 2012.
[37] J. Provost, A. Gambhir, J. Vest, H. Garan, and E. E. Konofagou, “A clinical feasibility study of atrial and ventricular electromechanical wave imaging,” Heart Rhythm, vol. 10, no. 6, pp. 856–862, Jun. 2013.
[38] K. S. Kim, J. S. Hwang, J. S. Jeong, and T. K. Song, “An efficient motion estimation and compensation method for ultrasound synthetic aperture imaging,” Ultrason Imaging, vol. 24, no. 2, pp. 81–99, Apr. 2002.
[39] J. Wang and J. Lu, “Motion artifacts of extended high frame rate imaging,” IEEE Trans Ultrason
Ferroelectr Freq Control, vol. 54, no. 7, pp. 1303–1315, Jul. 2007.
[40] N. Oddershede and J. A. Jensen, “Effects influencing focusing in synthetic aperture vector flow imaging,” IEEE Trans Ultrason Ferroelectr Freq Control, vol. 54, no. 9, pp. 1811–1825, Sep. 2007.
[41] J. W. Goodman, Introduction to Fourier Optics, Ed. McGraw -Hill International Editions, Second Edition. 1996.
[42] J. Luo and E. E. Konofagou, “Imaging of wall motion coupled with blood flow velocity in the heart and vessels in vivo: a feasibility study,” Ultrasound Med Biol, vol. 37, no. 6, pp. 980–995, Jun. 2011.