SLEEP, Vol. 37, No. 1, 2014 Lighting Up the Aging Brain—Daneault et al INTRODUCTION
Light is crucial not only for image formation but also for the regulation of many circadian, neuroendocrine, and neurobehavioral functions.1,2 Among these non-image-forming functions, exposure to light leads to direct improve-ment of alertness and cognition. This positive effect of light is greater using blue wavelength light,3-5 presumably because of the involvement of intrinsically photosensitive retinal ganglion cells (ipRGC) expressing the photopigment mela-nopsin, and which are maximally sensitive to blue wavelength (460-480 nm), and project broadly to the brain.6
Neuroimaging studies showed that light affects brain responses to auditory cognitive tasks in young individuals. Their results suggested that the effect of light on non-image-forming cognitive brain functions is mediated by subcortical areas involved in the regulation of alertness, including the pulvinar, hypothalamus, and brainstem, before reaching cortical areas involved in the ongoing cognitive processes.7 The effect of light on brain responses was greater using blue monochromatic light
AGING REDUCES THE STIMULATING EFFECT OF BLUE LIGHT ON COGNITIVE BRAIN FUNCTIONS
http://dx.doi.org/10.5665/sleep.3314
Aging Reduces the Stimulating Effect of Blue Light on Cognitive Brain
Functions
Véronique Daneault, MSc1,2,3; Marc Hébert, PhD4; Geneviève Albouy, PhD1; Julien Doyon, PhD1,3; Marie Dumont, PhD2; Julie Carrier, PhD1,2,3; Gilles Vandewalle, PhD1,2,3
1Functional Neuroimaging Unit, University of Montreal Geriatric Institute, Montreal, Quebec, Canada; 2Center for Advanced Research in Sleep
Medicine (CARSM), Hôpital du Sacré-Cœur de Montréal, Montreal, Quebec, QC, Canada; 3Department of Psychology, University of Montreal,
Montreal, Quebec, Canada; 4Centre de recherche Institut universitaire en santé mentale de Québec, Quebec, QC, Canada, G1J2G3
Submitted for publication February, 2013 Submitted in final revised form June, 2013 Accepted for publication June, 2013
Address correspondence to: Dr. Julie Carrier, Center for Advanced Re-search in Sleep Medicine, Hôpital du Sacré-Cœur de Montréal, 5400 Gouin Boulevard West, Montreal, Quebec, Canada, H4J 1C5; Tel: (514) 338-2222, ext 3124; Fax: (514) 338-2531; E-mail: julie.carrier.1@ umontreal.ca
Study Objectives: Light exposure, particularly blue light, is being recognized as a potent mean to stimulate alertness and cognition in young individuals. Aging is associated with changes in alertness regulation and cognition. Whether the effect of light on cognitive brain function changes with aging is unknown, however.
Design: Cross-sectional study.
Setting: Functional Neuroimaging Unit, University of Montreal Geriatric Institute.
Participants: Sixteen younger (23 ± 4.1 y) and 14 older (61 ± 4.5 y) healthy participants were recruited in the current study. Intervention: Blue light administration.
Measurements: We used functional magnetic resonance imaging to record brain responses to an auditory working memory task in young and older healthy individuals, alternatively maintained in darkness or exposed to blue light.
Results: Results show that the older brain remains capable of showing sustained responses to light in several brain areas. However, compared to young individuals, the effect of blue light is decreased in the pulvinar, amygdala, and tegmentum as well as in the insular, prefrontal, and occipital cortices in elderly individuals.
Conclusion: The effect of blue light on brain responses diminishes with aging in areas typically involved in visual functions and in key regions for alertness regulation and higher executive processes. Our findings provide the first indications that the effect of light on cognition may be reduced in healthy aging.
Keywords: Aging, blue light, circadian, cognition, fMRI, light, melanopsin, nonvisual
Citation: Daneault V; Hébert M; Albouy G; Doyon J; Dumont M; Carrier J; Vandewalle G. Aging reduces the stimulating effect of blue light on cognitive brain functions. SLEEP 2014;37(1):85-96.
compared to longer wavelengths,7-9 suggesting an involvement of melanopsin-based photoreception.
Healthy aging is accompanied by a decline in cognitive abilities and several approaches focusing on physical activity, nutritional aspects, or cognitive training have been validated “to aging cognitively well,” or at least better.10-12 Increasing ambient light level for 1 w has been reported to improve cognitive impairment among elderly demented patients.13 However, whether exposure to light could be used as an addi-tional means of helping cognition in older healthy individuals, still remains unknown. Some studies suggest that aging is associated with a reduction in non-image-forming responses to light, but this notion remains open to debate.14-20 At the cellular and molecular levels in rodents, aging is accompa-nied by a decrease in the number of ipRGCs, which seem to decrease light input to their targets.21 Modifications were also reported in gene regulating circadian functions and in neuronal signaling and temporal organization of structures important for mediating the effect of light on non-image-forming func-tions, such as the suprachiasmatic nucleus, site of the master circadian clock.22,23
Importantly, whether the non-image-forming effect of light on cognition and cognitive brain responses changes in healthy aging has not yet been investigated. Here, we used functional magnetic resonance imaging (fMRI) to compare the effects of blue light on cognitive brain responses between young and older participants. We hypothesized that, compared to young patients, older participants would show a reduced effect of light on brain responses during a cognitive task.
SLEEP, Vol. 37, No. 1, 2014 Lighting Up the Aging Brain—Daneault et al MATERIALS AND METHODS
Participants
Sixteen younger (23 ± 4.1 y) and 14 older (61 ± 4.5 y) healthy participants were recruited (see Table 1 for characteristics). Semistructured interviews established the absence of medical, traumatic, psychiatric, or sleep disorders. Questionnaires were used to exclude candidates with extreme chronotypes (Morn-ingness-Eveningness Questionnaire, scores ≤ 30 or ≥ 70),24 excessive daytime propensity to fall asleep (Epworth Sleepi-ness Scale, score > 11),25 poor sleep quality (Pittsburg Sleep Quality Index, scores ≥ 7),26 high anxiety (Beck Anxiety Inven-tory, score ≥ 11),27 or depression (Beck Depression Inventory-II, scores ≥ 11)28 (see supplementary material, Table S1). Candidates with a body mass index > 27 were also excluded. All participants were nonsmokers, low to moderate consumers of caffeine and alcohol (i.e., ≤ 4 caffeine units/day; ≤ 10 alcohol units/w – see Table 1), and right-handed. None were using medication, and none had worked on night shifts during the past year or traveled through more than one time zone during the past 3 mo. Prior to participation, extensive ocular examina-tion by an optometrist confirmed the absence of ocular prob-lems and normal color vision. Because aging is associated with lens yellowing,29 the optometrist also subjectively assessed lens opacification with the Lens Opacities Classification System III scale (LOCS-III) (from 1, clear lens, to 5, cataract).30 As expected, lens opacification was significantly higher in older
than in younger participants (Table 1). This experiment received Institutional ethics approval and written informed consent was obtained from each participant.
Experimental Protocol
At least 1 w prior to the fMRI experiment, participants were habituated to the magnetic resonance setting in a short session during which a structural image of their brain was acquired. Volunteers were then trained (training 1) to the auditory two-back task (see below) for at least 15 min and had to reach 75% of correct responses at the end of training to be included, so that interindividual differences in performance at training were limited. Because aging is associated with senile miosis, pupil size was subsequently captured after 15 min of darkness adap-tation using a procedure described in Daneault et al.15
Participants followed a regular sleep schedule 7 days prior to the experiment. Compliance was verified using wrist actigraphy (Actiwatch-L; MiniMitter/Respironics, Bend, OR) and sleep diaries. Sleep timing and duration estimated with actigraphy data are reported in Table 1. Volunteers were requested to refrain from consumption of caffeine beverages after their habitual morning coffee/tea on the experimental day (two cups maximum) and from alcohol-containing beverages 24 h before the experiment. At the time of the experiment, participants arrived at the labora-tory 1 h before their habitual bedtime and were maintained in dim light (< 5 lux) for 2 h. Pupil constriction was not pharmaco-logically inhibited. Participants practiced the two-back task again Table 1—Participants’ characteristics (mean ± standard deviation)
Older participants
(≥ 55 y; n = 14) Younger participants (18-30 y; n = 16) P
Age 60.9 ± 4.53 22.8 ± 4.05 < 0.001
Laterality (right-handed) 14 16
Sex 4M / 10F 6M / 10F 0.60
Body mass index (BMI) 22.78 ± 2.61 21.96 ± 2.05 0.35
Depression score (BDI-II) 3.00 ± 4.3 2.31 ± 1.99 0.57
Anxiety score (BAI) 1.86 ± 3.06 3.5 ± 3.78 0.21
Daytime propensity to fall asleep 5.43 ± 4.42 5.81 ± 3.47 0.79
Sleep disturbance score (PSQI) 3.21 ± 1.37 2.94 ± 1.18 0.56
Chronotype score (MEQ) 56.71 ± 8.66 54.38 ± 10.54 0.52
Years of education 14.6 ± 0.84 14.9 ± 0.24 0.72
Coffee/tea intake per week 10.1 ± 6.6 5.6 ± 4.9 0.04
Alcool intake per week 3.5 ± 3.1 2.1 ± 1.6 0.15
Hormonal contraceptive 0 / 10 10 / 10 < 0.001
Hormonal replacement therapy 1 / 10 0 / 10 < 0.001
Lens opacification (LOCS-III) 2.4 ± 0.7 1.0 ± 0 < 0.001
Baseline pupil size (following 15 min of darkness; arbitrary units) 0.08 ± 0.03 0.11 ± 0.03 0.02
Date of study (day/month/year) 08/11/09 ± 28 days 07/11/09 ± 29 days 0.88
Bedtime prior to experiment 22:00 ± 2:40 23:02 ± 0:54 0.16
Wake time prior to experiment 07:32 ± 1:07 07:16 ± 1:18 0.55
Total sleep time prior to experiment (h:min) 7:52 ± 0:58 7:49 ± 0:25 0.83
Subjective sleepiness immediately prior to fMRI experimenta 4.93 ± 1.82 6.25 ± 1.48 0.04
Volume level of auditory stimuli in fMRI (arbitrary units) -653 ± 596 -412 ± 485 0.23
aFourth assessment, just prior to the functional MRI (fMRI) session. BAI, Beck Anxiety Inventory; BDI-II, Beck Depression Inventory – II; LOCS-III, Lens Opacities Classification System – III; MEQ, Morningness-Eveningness Questionnaire; PSQI, Pittsburgh Sleep Quality Index.
SLEEP, Vol. 37, No. 1, 2014 Lighting Up the Aging Brain—Daneault et al for 8 min (training 2), 30 min before entering the magnetic
reso-nance scanner 1 h after their usual bedtime.
During the fMRI acquisitions (~30 min), participants performed a total of 28 45-sec blocks of the auditory two-back tasks, seven blocks in complete darkness and 21 blocks while being exposed to monochromatic blue light (480 nm; full width at half maximum – FWHM: 10 nm). Blue light irradiance was pseudorandomly set at low (7 × 10¹² photons/cm2/s), medium (3 × 10¹³ ph/cm2/s), and high (1014 ph/cm2/s) levels. Each condition (i.e., darkness, low blue, medium blue, high blue) was presented seven times and their order was counterbalanced across participants within each group (except that high blue was never presented as the first condition to prevent head motion). Task blocks were separated by 20- to 30-sec periods of rest in darkness. No feedback was given on performance. Subjec-tive sleepiness scores, using the Karolinska Sleepiness Scale (KSS),31 were collected every 30 min during the 2-h prepara-tory period and at the end of the fMRI session. The experi-mental protocol is illustrated in Figure 1.
Two-Back Task
The auditory two-back task requires auditory processing, attention, storing, comparing, and updating information in working memory. Contrary to the three-back version of the task, which is particularly difficult for elderly individuals, it is reliably executed by most individuals, and does not depend on visual input.32 Stimuli consisted of nine French monosyl-labic and phonologically different consonants. Stimuli were 500 ms long and the interstimulus interval was 2000 ms. For each consonant, volunteers were required to state whether or not it was identical to the letter presented two items earlier, by pressing buttons on a magnetic resonance compatible keypad. Series of stimuli were constructed with 30% positive answers and 18 consonants were presented in each task block. Stimuli were produced using COGENT 2000 (http://www.vislab. ucl.ac.uk/Cogent/) implemented in MATLAB (Mathworks Inc., MA) and were transmitted to the participants using MR CONTROL amplifier and headphones (MR Confon, Germany). fMRI acquisitions were preceded by a short session during which volunteers set volume of stimuli to ensure optimal audi-tory perception (Table 1).
Light Exposure
Light was produced by a computer-controlled quartz halogen white light source (PL950, Dolan-Jenner, Boxborough, MA, USA). An optic fiber (Dolan-Jenner) carried light to diffusers to ensure that subjects’ eyes were uniformly illuminated. Diffusers consisted of translucent diffusing glass mounted on a protec-tion glass frame. Blue monochromatic light was produced with narrow band-pass filters (Edmund Optics Inc., Barrington, NJ, USA). Irradiance could not be measured directly in the magnet, but the light source was calibrated (PM100D, Thorlabs, Newton, NJ, USA) prior to the experiment. The total amount of blue light received during the experiment was well below the blue-light hazard threshold.33
Behavioral Data Analysis
Task performance (accuracy, reaction time) during the two training sessions was compared between the two age groups
using t-tests. Two-way mixed design analyses of variance (ANOVAs) with age group (young and older) as the indepen-dent factor and light condition (darkness, low, medium, high) as the four-level repeated measures were carried out to analyze task performance (accuracy, reaction time). Two-way mixed design ANOVAs were also performed to analyze subjective sleepiness scores (age group as the independent factor and time as the five-level repeated measures). All behavioral analyses were computed with Matlab 7.10 and SPSS 17.0 (IBM SPSS Statistics, Chicago, IL).
fMRI Data Acquisitions
fMRI time series were acquired using a 3 T magnetic reso-nance scanner (TIM-Trio, Siemens, Erlangen, Germany). Multislice T2*-weighted fMRI images were obtained with a gradient echo-planar sequence (EPI) (32 axial slices; voxel size 3.4 × 3.4 × 3 mm3 with 30% gaps; matrix size 64 × 64 × 32; repetition time 2,000 ms; echo time 30 ms; flip angle 90°). The structural brain images acquired during the habituation session consisted of a T1-weighted three-dimensional magnetization prepared rapid acquisition gradient echo (MP-RAGE) sequence (voxel size: 1 × 1 × 1 mm3, matrix size 256 × 256 × 176, repeti-tion time (TR) 2300 ms, echo time (TE) 2.91 ms, inversion time (TI) 900 ms, field of view (FOV) 256 × 173 cm², flip angle 9°).
fMRI Data Analyses
fMRI data were preprocessed and analyzed using Statistical Parametric Mapping (SPM8 - http://www.fil.ion.ucl.ac.uk/ spm). Functional data were realigned and coregistered to the structural image. This structural image was then segmented using the “New Segment” SPM8 toolbox and normalized using Dartel34 (which includes smoothing – 8-mm FWHM gaussian kernel), a state-of-the art SPM8 analytic toolbox, which created an average brain template of all participants, i.e., a brain that is at the “center” of our population and therefore halfway between our younger and older brains, before normalizing in the Montreal Neurological Institute (MNI) space. This approach reduces morphological differences between older and younger individuals.35 Data were analyzed using a standard general linear model approach. Statistical analysis was conducted in two serial steps accounting for individual-level fixed effects Figure 1—Experimental protocol. Participants were maintained in dim light for 2 h before starting the fMRI protocol, 1 h after their habitual bedtime. Participants performed a total of 28 blocks of auditory two-back task divided across four conditions: darkness and exposure to blue monochromatic light (480 nm) of three different irradiance levels (low: 7 × 10¹² ph/cm2/s; medium: 3 × 10¹³ph/cm2/s; high: 1014ph/cm2/s). The order of the four conditions was counterbalanced within each group, except for high irradiance blue light that was never presented first. Task blocks lasted 45 sec separated by rest periods of 20 to 30 sec in darkness. Total duration of the fMRI session was about 30 min.
SLEEP, Vol. 37, No. 1, 2014 Lighting Up the Aging Brain—Daneault et al and group-level random effects. Boxcar functions convolved
with a canonical hemodynamic response function modeled task blocks. A first regressor included all 28 task blocks, irrespec-tive of the light condition. A second regressor included only the 21 task blocks performed under light exposure, irrespec-tive of irradiance level to track brain responses triggered by the presence of light. A parametric modulation was added to this second regressor to track any linear change of response ampli-tude related to irradiance level. This design separates the brain responses to the task independent of light (i.e., common to all task blocks) from the brain responses to the task only found under blue light exposure or in relation to irradiance change. This ensures that any group differences in the brain responses to the task irrespective of light are not contaminated by group differences in brain responses to the task under blue light expo-sure. Stick functions convolved with a canonical hemodynamic response function modeled light-on and light-off separately. The light-on and light-off regressors, together with the regres-sors derived from the realignment of functional volumes, were considered as covariates of no interest. High-pass filtering was implemented in the design matrix using a cutoff period of 256 sec to remove low frequency drifts from the time series. Serial correlations in the fMRI signal were estimated using an autoregressive (order 1) plus white noise model and a restricted maximum likelihood algorithm.
At the individual level, contrasts of interest consisted of (1) the main effect of the task (using the first regressor); (2) the effect of the presence of light (using the second regressor); and (3) the effect of irradiance change when light was on (using the parametric modulation of the second regressor). The summary statistic images resulting from these contrasts were entered into a second population-level analysis. This second level analyses consisted of one sample t-test, in each population separately and on all participants irrespective of age group, and two sample t-test, on independent measures with unequal variance to iden-tify differences between groups. To isolate effects of light or of irradiance changes that were commonly significant in both age groups, null hypothesis conjunctions were computed. Maps of the t-statistics were thresholded at Puncorrected = 0.001. Correc-tions for multiple comparisons (family wise error approach) were computed on the entire brain volume or on small spherical volumes around a priori locations of activation (10-mm radius; regions of interest [ROI]; see references in Table S1 and in Tables 2 and 3 for coordinates used), which were expected in structures involved in the n-back tasks and working memory, arousal regulation, and salience detection or involved in non-image-forming effect of light in previous research. Brain areas to which the melanopsin-expressing ipRGCs project or are functionally linked to the suprachiasmatic nucleus (SCN) were also considered as a priori locations of activation.
Because we found group differences in the brainstem, which is composed mainly of ascending and descending tracks (white matter), we constructed a map of the gray matter voxel in our populations to warrant that this brainstem difference was located in a brainstem area mainly composed of neuron cell bodies. Individual gray matter maps issued from the segmenta-tion step of our analyses were merged into a gray matter mask for which a voxel was considered as part of the gray matter in our sample if it was present in at least 75% of our participants.
This procedure was computed across all participants together and in each group separately. Results of our contrasts of interest were then masked by these gray matter masks (significant results found in the brainstem were located within the gray matter masks of all subjects or of each age group separately–see footnote c in Table 2).
In order to fully describe our results, we performed an addi-tional correction for the number of ROI used to compute the correction for multiple comparisons. For each contrast of interest, we constructed a mask which included all ROI to take into account the number, size, shape, and location of all ROI at once and assessed which results survived correction for multiple comparisons over the entire mask. Outcomes from this addi-tional procedure are reported in footnote b in Tables 2 and 3.
Finally, because lens opacification, pupil size, and subjec-tive sleepiness scores significantly differed between younger and older individuals (Table 1), we investigated whether these differences were related to the differences between age groups in response to light or to irradiance changes. We used SPM8 to compute regression analyses across all participants (i.e., irre-spective of age group) between responses to light or responses to change in light irradiance and lens opacification scores, dark adapted pupil size, or subjective sleepiness scores collected just prior to the scanning session. Results of these regressions, thresholded at a very liberal level (P < 0.05 uncorrected), were used to mask out from our contrasts of interest any age-related differences that would only be related, even slightly, to differ-ences in lens opacification, pupil size and subjective sleepiness scores (i.e., results of our contrasts of interest were exclusively masked by results of each regression separately thresholded at P < 0.05 uncorrected for multiple comparisons).
RESULTS Behavior
Accuracy during training was > 80% in all participants. Accuracy was significantly higher in younger than in older indi-viduals (P = 0.01) and in training 2 (P = 0.01) than in training 1 (P = 0.02; see supplemental material, Figure S1A). Reac-tion time (ms) did not differ significantly between age groups but improved from training 1 to training 2 (P < 0.001). In the fMRI scanner, however, for accuracy, there was no significant main effect of age (F(1,28) = 0.107, P = 0.75) or light condition (F(3,84) = 1.39, P = 0.25), and no significant age × light condition interaction (F(3,84) = 1.07, P = 0.37) (see supplemental material, Figure S1C). For reaction time (ms) of correct responses (see supplemental material, Figure S1D), results were similar: no significant effects of light condition (F(3,84) = 1.69, P = 0.18), age group (F(1,28) = 0.01, P = 0.91), or interaction (F(3,84) = 0.73, P = 0.54) were found. Those results likely reflect a ceiling effect on performance in both groups, following extensive training.36,37 Behavioral results ensure that fMRI results were not significantly biased by differences in task performance.
Sleepiness scores significantly increased during the evening, and older participants reported lower sleepiness scores than the younger participants (time effect: F(4,112) = 5.8, P < 0.001; age group effects: F(4,112) = 5.6, P = 0.03) (see supplemental material, Figure S1B). No significant interaction between age groups and testing time was found (F(4,112) = 1.24; P = 0.3).
SLEEP, Vol. 37, No. 1, 2014 Lighting Up the Aging Brain—Daneault et al
Table 2—Effect of the presence of light on brain responses during the auditory two-back task
Brain areas Side X, Y, Z Z score P References
Effect of light in younger participants
Lateral geniculate (LGN) [a] R
L 28, -22, -2 -26, -24, -2 4.774.74 < 0.0010.044
Lingual gyrus [b] R
L 18, -38, -4 -16, -42, -10 4.873.52 0.0260.016a,b 58
Calcarine aulcus [c] R 10, -88, 2 3.54 0.035a 54
Middle and auperior occipital gyrus (MOG/SOG) [d] R
L 6, -82, 36 -16, -76, 26 5.393.54 0.0030.015a,b 7,63
Frontopolar cortex/ventrolateral prefrontal cortex (FPC/VLPFC) [e] L
R -40, 58, -6 36, 58, -6 3.443.12 0.020 a 0.048a 66 Dorsomedial thalamus [f] R L 6, -8, 2 -6, -8, 0 3.823.74 0.006 a,b 0.008a,b 50 Thalamus pulvinar [g] R L 20, -18, 4 -24, -22, 2 4.143.51 0.002 a,b 0.016a,b 7 Insula [h] R L 36, 8, -4 -36, 4, -4 3.633.13 0.011 a,b 0.046a 60,61 Amygdala [i] L -32, -10, -14 3.49 0.017a 59 Cerebellum [k] M R L 0, -54, -40 -8, -66, -38 10, -64, -22 3.82 3.69 3.42 0.006a 0.009a 0.021 52,64 Frontal operculum [l] R 56, 2, 8 3.22 0.036a 50
Effect of light in older participants
LGN [a] R L 26, -24, -2 -26, -26, -2 3.983.84 0.004 a,b 0.006a,b 54 Lingual gyrus [b] L R -20, -44, -4 18, -38, -8 3.973.56 0.004 a,b 0.014a,b 58 Calcarine sulcus [c] R 16, -90, 2 3.32 0.028a 54
Superior occipital gyrus (SOG) [d] R 10, -82, 36 3.10 0.05a 63
Common effect of light in both age groups (conjunction analysis)
LGN [a] R L 28, -22, -2 -26, -24, -2 4.774.74 0.001 a,b 0.004a,b 54 Lingual gyrus [b] L R -20, -44, -4 18, -38, -8 4.673.98 < 0.001 a,b 0.004a,b 58 Calcarine sulcus [c] R 14, -88, 2 3.31 0.029a 54
Superior occipital gyrus (SOG) [d] R 8, -82, 36 5.08 0.011a 63
Group differences (younger > older)
Dorsomedian thalamus [f] R L 6, -8, 2 -6, -8, 0 3.503.24 0.017 a 0.035a 50 Thalamus pulvinar [g] R L 20, -18, 8 -12, -24, 4 3.983.19 0.004 a,b 0.039a 7 Insula [h] L R L -40, 8, 10 34, 2, -2 -42, -2, 2 3.54 3.44 3.26 0.015a 0.020a 0.033a 60,61 Amygdala [i] L -24, -10, -14 3.41 0.022a 59 Tegmentumc [j] L R -2, -16, -10 6, -16, -8 3.343.26 0.026 a 0.033a 62,63 Cerebellum [k] L M -14, -60, -46 0, -58, -40 3.393.25 0.017 a 0.034a 52,64
Frontal operculum [l] R 56, 4, 14 3.49 0.017a,b 50
Group differences (older > younger) No significant voxels
Letters between [ ] correspond to letters of Figure 2. P values are corrected for multiple comparisons over the entire brain volume (familywise error approach) except for a which
were corrected for multiple comparisons over small volume of interest taken a priori based on the literature (see Materials and Methods section). References: literature in which a
priori locations were found to compute correction for multiple comparisons over small volume. All results survived the use of an exclusive masks (P < 0.05 uncorrected) constituted
by the results of the regression analyses was between lens opacification, pupil size, or subjective sleepiness scores and the functional MRI brain responses under blue light. L, left; M, median; R, right. bResults that survived correction for the number of regions of interest considered (P < 0.05) to correct for multiple comparisons over a small spherical volume,
indicating a stronger effect in these regions as compared to other regions. cThis region lays within a gray matter mask, constituted based on our sample (see Materials and Methods),
SLEEP, Vol. 37, No. 1, 2014 Lighting Up the Aging Brain—Daneault et al Brain Responses to the Auditory Two-Back Task
Analyses of the brain responses to the task irrespective of light condition and age group revealed the pattern of activa-tions typically observed with an n-back task, with frontopari-etal recruitment (in green on supplemental material, Figure S2; Table S1).32 There was no higher brain response in younger than in older individuals whereas, in accordance with the literature,37,38 older participants showed stronger activations in several brain areas compared with younger participants (in pink on Figure S2; Table S1). This is likely to refl ect that older indi-viduals needed more neural resources to reach similar perfor-mance than younger individuals.
Decrease of Brain Responses to Light with Aging
We investigated which brain areas showed sustained responses to the presence of light while performing the audi-tory task, independently of irradiance level. We fi rst focused on
young participants alone before considering commonalities and differences between age groups.
In younger individuals, light triggered multiple sustained responses (Table 2; Figure 2a-l, yellow) that were found in (1) a dorsal part of the thalamus compatible with the pulvinar; (2) the dorsomedian thalamus; (3) an area of the thalamus compat-ible with the lateral geniculate nucleus (LGN); (4) the amyg-dala; (5) the insula; and (6) in the cerebellum. At the neocortical level, activations were found in (1) an area laying between the frontopolar cortex (FPC) and ventrolateral prefrontal cortex (VLPFC); (2) the frontal operculum; and (3) extensively in the occipital cortex, i.e. the calcarine sulcus and lingual gyrus, as well as in a large area comprising the middle and superior occipital gyrus (MOG/SOG).
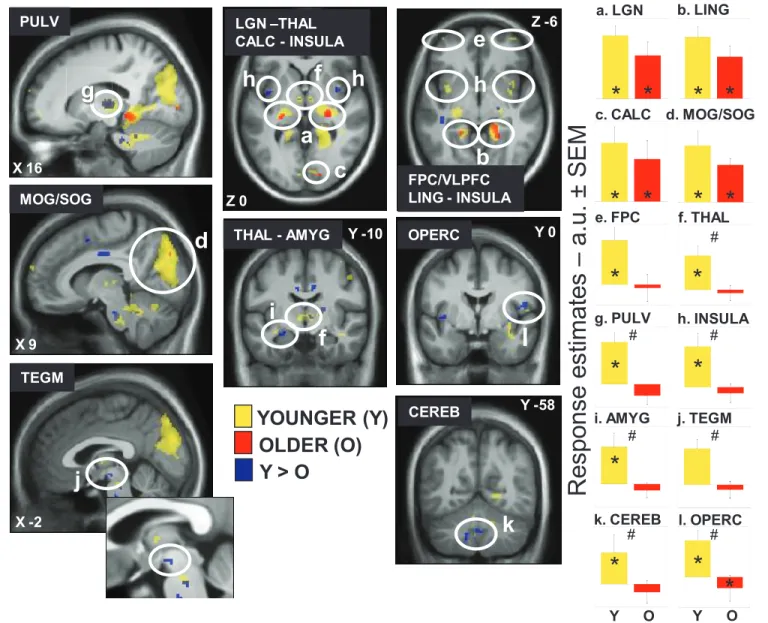
Older participants presented signifi cant responses in a reduced set of areas (Table 2; Figure 2a-d, red) including a LGN-compatible region, the lingual gyrus, and the calcarine Figure 2—Effect of the presence of light on brain responses of younger and older individuals performing an auditory two-back task. Statistical results (P < 0.001 uncorrected) overlaid over the mean structural image of all participants. Responses to light are displayed in yellow for younger individuals (Y), in red for older individuals (O), whereas group differences (Y > O) are in blue. Right panels show activity estimates (arbitrary unit – a.u. ± standard error of the mean) in each brain region. See Table 2 for names of the brain regions corresponding to the letters and abbreviations. *P < 0.05 corrected for multiple comparisons over small volumes of interest; # signifi cant group differences P < 0.05 corrected for multiple comparisons over small volumes of interest.
R
es
pons
e
es
tim
at
es
–
a.
u.
±
S
EM
MOG/SOG LGN –THAL CALC - INSULA
b
OPERC THAL - AMYG PULV TEGM CEREBYOUNGER (Y)
OLDER (O)
Y ˃ O
a. LGN b. LING c. CALC d. MOG/SOG f. THAL k. CEREB l. OPERC g. PULV h. INSULA #a
c
d
f
g
h
f
l
j
k
X 9 X 16 X -2 Y -10 Y -58 Y 0 e. FPCe
FPC/VLPFC LING - INSULA Z 0 Z -6* * * *
* * * *
*
*
*
# # # # # # Y O Y Oh
h
i. AMYG j. TEGMi
*
*
*
*
*
SLEEP, Vol. 37, No. 1, 2014 Lighting Up the Aging Brain—Daneault et al sulcus as well as the SOG. A conjunction analyses showed that
all these significant responses to light in older individuals were common to both age groups (Table 2; Figure 2a-d).
A two-sample t-test revealed that most of the brain responses to the presence of light observed in younger but not in older indi-viduals were significantly different between age groups (Table 2; Figure 2f-l, blue). Lower responses to light were observed in older compared to younger individuals in the pulvinar-compat-ible areas, in the dorsomedian thalamus, left amygdala, insula, cerebellum, and right frontal operculum. Importantly, age-related changes in the thalamus and right frontal operculum even survived correction for the number of ROI used in the analyses. Reduced responses to light were also detected in older compared to younger individuals in an area of the tegmentum compatible with the ventral tegmental area (VTA), located within a part of the brainstem mainly composed of neuron cell bodies (in the brainstem gray matter). None of the responses to light were higher in older than in younger individuals.
Activity estimates in all these regions are displayed in Figure 2 and confirm that the areas identified by the conjunc-tion analyses responded to light in both age groups (Figure 2, graphs a-d). In the FPC/VLPFC (Figure 2, graph e), activity estimates appear different between age groups but these differ-ences are not statistically significant. Finally, activity estimates also confirmed that the areas identified by the two-sample t-test responded more to light in younger than in older individuals (Figure 2, graphs f-l), including in the tegmentum, despite the fact that response in that area did not reach statistical signifi-cance in young individuals alone.
The Effect of Irradiance Changes Decreases with Aging
We then sought for sustained brain responses that were modulated by changes in the irradiance of light exposure. In younger participants, light irradiance increment significantly increased brain responses bilaterally in the FPC/VLPFC, close to the FPC/VLPFC location affected by the presence of light reported in the preceding section. Irradiance effect was also found extensively in the cerebellum and in the occipital cortex, in an area encompassing the areas responding to light independently of irradiance change, i.e. the calcarine sulcus and the large bilateral occipital region encompassing the infe-rior (IOG), middle (MOG), and supeinfe-rior (SOG) occipital gyri (Table 3; Figure 3a-e, yellow).
In older participants, irradiance increment increased activity in the calcarine sulcus and in the IOG/MOG/SOG (Table 3; Figure 3a-b, red). Conjunction analyses indicated that these bilateral occipital effects were common to both age groups (Table 3). Activity estimates in the calcarine sulcus, and in the occipital region encompassing the IOG, MOG, and SOG showed that irradiance increment was associated with enhanced brain responses. A schematic representation of the linear asso-ciation between irradiance level and brain responses in the occipital regions of both age groups is displayed in Figure 3k-l.
A two-sample t-test showed that the effect of irradiance on FPC/VLPFC and cerebellar activity identified in younger but not in older individuals was significantly different between age groups. In addition, the effect of irradiance differed between the two age groups in specific areas of IOG, MOG, and SOG distinct from those commonly affected by irradiance (Figure 3,
in blue). Importantly, age-related differences in the cerebellum and occipital cortex survived correction for the number of ROI used in the analyses. Activity estimates for all these areas confirmed that irradiance increment triggered a significant increase in brain responses in younger participants but not in older individuals. We found no increases in brain responses, triggered by irradiance increment, that were higher in older than in younger individuals and in any other parts of the brain.
A schematic representation of the linear increase of brain activation with irradiant increment in the younger individuals is displayed in Figure 3m-o (right panel). Older individuals are not represented because linear association between irradiance change and brain responses was not significant.
Figure 4 gathers group differences in brain responses to (1) the task irrespective of the light condition (pink), (2) blue light irrespective of irradiance (blue), and (3) irradiance level (yellow). This display highlights that in the pulvinar, insula, and prefrontal cortex, older individuals showed lower brain responses to blue light and to irradiance levels in close vicinity from where they showed stronger brain responses to the task.
Age-Related Differences in Pupil Size, Lens Opacification, and Subjective Sleepiness Do Not Explain Age Group Differences in Brain Responses to Light
Lens opacification and pupil size, measured after 15 min of dark adaptation, were significantly higher and smaller, respec-tively, in older compared to younger participants (as seen in Table 1 and reported in Daneault et al.15). These differences reduce the amount of light reaching the retina and could affect the effect of light on brain activity. Consequently, we computed regression analyses between fMRI brain responses under light presence or in relation to light irradiance and lens opacifica-tion or pupil size. We then used the results of these regressions to assess whether the results of our contrasts of interest were related, even slightly, to differences in lens opacification or pupil size using a masking procedure (exclusive mask liber-ally thresholded at P < 0.05 uncorrected; see Materials and Methods). This procedure had no effect on the results of our contrasts of interest. Likewise, as subjective sleepiness was significantly higher in young participants, another regression analyses was performed between subjective sleepiness scores obtained just before the fMRI recording and the fMRI brain responses under blue light and in relation to light irradiance. Using an identical stringent masking procedure, again we found that the results of our contrasts of interest were not related, even slightly, to differences in subjective sleepiness.
DISCUSSION
In this study, we used fMRI to investigate whether the stimu-lating effect of light on task-related brain responses differed between young and older participants. Our results indicate that the older brain remains capable of showing sustained responses to light in several brain areas including the LGN, lingual gyrus, calcarine sulcus, and SOG. The results further demonstrate that the effect of light on brain responses is lower in older participants in several brain areas. Age-related reduced responses to the pres-ence of light were found in the pulvinar, dorsomedial thalamus, insula, amygdala, frontal operculum, and cerebellum loci as well as in a VTA-compatible area of the tegmentum. Our results also
SLEEP, Vol. 37, No. 1, 2014 Lighting Up the Aging Brain—Daneault et al Table 3—Effect of irradiance level of light on brain responses during the auditory 2-back task
Brain areas Side X, Y, Z Z score P value References
Effect of irradiance in younger participants
Calcarine sulcus [a] L
R L R -12, -68, 2 12, -62, 6 20, -84, 2 -16, -86, 2 6.61 5.86 5.26 5.25 < 0.001 < 0.001 < 0.001a,b < 0.001a,b 54
Inferior/middle/superior occipital gyrus (IOF/MOG/SOG) [b] L R R R L R L R -14, -74, 8 20, -82, 2 2, -86, 28 14, -62, 8 -8, -68, 0 8, -78, -2 -4, -90, 30 20, -90, 24 6.47 5.32 5.18 5.84 5.83 4.96 4.71 4.25 < 0.001 < 0.001a,b < 0.001a,b < 0.001a,b < 0.001a,b < 0.001a,b < 0.001a,b 0.002a,b 7,36,61,63
Frontopolar/ventrolateral prefrontal cortex (FPC/VLPFC) [c] R
L 42, 58, -6 -48, 50, -6 3.663.40 0.011 a,b 0.024a 9,66 Cerebellum [d] R R L 16, -74, -16 28, -78, -24 -20, -78, -18 3.47 3.37 3.15 0.020a,b 0.025a 0.048a 65 Effect of irradiance in older participants
Calcarine sulcus[a] L L R R -16, -78, 14 -12, -76, 8 12, -64, 14 14, -84, 10 4.71 4.31 4.12 3.88 0.053 0.001a,b 0.002a,b 0.006a,b 54
Inferior/middle/superior occipital gyrus (IOF/MOG/SOG) [b] R L R L R R 18, -68, 14 -6, -80, 4 16, -82, 8 -4, -90, 28 12, -78, 22 4, -76, 6 4.27 4.01 3.77 3.67 3.52 3.49 0.001a,b 0.013a,b 0.018a,b 0.011a,b 0.017a,b 0.018a,b 7,36,61,63
Common effect of irradiance in both age groups (conjunction analysis)
Calcarine sulcus [a] L
L R -16, -78, 14 -12, -76, 8 14, -84, 10 4.71 4.31 3.88 0.053 0.001a,b 0.008a,b 54 Inferior/middle/auperior occipital gyrus (IOF/MOG/SOG) [b] R
L R R 18, -68, 14 -4, -90, 28 12, -78, 22 4, -76, 6 4.27 3.67 3.52 3.49 0.001a,b 0.011a 0.017a,b 0.018a,b 7,36,61,63
Group differences (younger > older)
Frontopolar/ventrolateral prefrontal cortex (FPC/VLPFC) [c] L
R -50, 50, -4 52, 46, -4 3.403.28 0.023 a 0.033a 9,66 Cerebellum [d] M R L R 0, -74, -16 14, -74, -16 -10, -54, -8 34, -74, -28 3.53 3.51 3.30 3.24 0.016a,b 0.018a,b 0.031a,b 0.037a 65
Inferior/middle/superior occipital gyrus (IOF/MOG/SOG) [e] R R L R 26, -86, 2 6, -70, -4 -20, -80, 8 16, -88, 36 4.41 3.81 3.42 3.12 < 0.001a,b 0.007a,b 0.022a 0.050a 7,36,61,63
Group differences (older > younger) No significant voxels
Letters between [ ] correspond to letters of Figure 3. P values corrected for multiple comparisons over the entire brain volume (familywise error approach) except for a which were corrected for multiple comparisons over small volume of interest taken a priori based on the literature (see method). References: literature in which a priori locations were found to compute correction for multiple comparisons over small volume. All results survived the use of an exclusive masks (P < 0.05 uncorrected) constituted by the result of the regression analyses was between lens opacification, pupil size, or subjective sleepiness scores and the functional MRI brain responses in relation to light irradiance. L, left; M, median; R, right. bResults that survived correction for the number of regions of interest considered (P < 0.05) to correct for multiple comparisons over a small spherical volume, indicating a stronger effect in these regions as compared to other regions.
SLEEP, Vol. 37, No. 1, 2014 Lighting Up the Aging Brain—Daneault et al indicate that the older brain is still able to respond to changes in
light irradiance in the calcarine sulcus and inferior, middle, and superior occipital gyri (IOG/MOG/SOG). The effect of light irra-diance increment was reduced in older compared to young indi-viduals in other brain areas, including the prefrontal cortex, the cerebellum, and other specific areas of the IOG, MOG, and SOG.
Importantly, age-related differences in responses to light were not biased by differences in task performance. Further-more, regression analyses indicated that lower responses to light in older participants cannot be significantly explained by a single factor, such as reduced pupil size, lower subjective
sleepiness, or higher lens opacification. Age-related differences as to the effects of light on brain responses are likely to arise from the combination of multiple factors. In addition, morpho-logical differences between healthy older and younger individ-uals may have contributed in part to the differences observed in brain responses. However, the use of the Dartel toolbox during preprocessing (see Materials and Methods) reduced their effect. Morphological differences are a typical limitation of neuroim-aging studies on neuroim-aging but their relationship with changes in brain activations is still unclear as positive, negative, or no correlations have been reported.39,40
Figure 3—Effect of irradiance level of light on brain responses of younger and older individuals performing an auditory two-back task. Statistical results (P < 0.001 uncorrected) overlaid over the mean structural image of all participants. Significant changes in responses as a function of irradiance level are displayed in yellow for younger individuals (Y) and in red for older individuals (O), whereas group differences (Y > O) are in blue. Panels a-e represent estimates [arbitrary units (a.u.) ± standard error of the mean (SEM)] of the brain responses while exposed to blue light independent of the irradiance change. Many of these responses are not significant (n.s.) and those that are significant correspond to the results reported in Figure 4. Panels f-j represent estimates (a.u. ± SEM) of the linear change in brain responses with change in irradiance level. Panels k-o consist of a schematic representation of the composite of both components (responses to light and irradiance change) showing the evolution of the responses with change in irradiance level. Panels m-o only include younger individuals because responses were not significantly affected by irradiance change in older individuals in the brain regions considered. See Table 3 for names of the brain regions corresponding to the letters and abbreviations. *P < 0.05 corrected for multiple comparisons over small volumes of interest; #significant group differences P < 0.05 corrected for multiple comparisons over small volumes of interest.
R
es
pons
e
es
tim
at
es
–
a.
u.
±
S
EM
YOUNGER OLDER Y ˃ O IOG/MOG/SOG CALC IOG/MOG/SOG CEREB CALCa
X 12 IOG/MOG/SOGb
FPC/VLPFCc
Z -4 CEREBd
Y -76* *
*
*
# Schematic brain response change L M H L M H k. Y O Y O X -4 X -20e
IOG/MOG/SOG Presenceof light Irradiance change
*
*
* *
*
# n.s.*
n.s. n.s. n.s. # o. FPC l. n. m. a. f. g. c. h. d. i. e. j. b.SLEEP, Vol. 37, No. 1, 2014 Lighting Up the Aging Brain—Daneault et al We previously reported that, despite having a smaller pupil
size, older individuals were equally able to constrict the pupil in response to light than younger individuals; i.e., we found no age-related difference in light-induced relative decrease in pupil size.15 We now report that, in the same sample of participants, the older brain is less responsive to light than the younger brain, when engaged in a cognitive task. Our results therefore support the notion that aging affects differently various non-image-forming functions.41 This may explain in part conflicting results reported in previous studies on the effect of aging on non-image-forming effects of light.
Older participants showed lower responses to light in the pulvinar. The pulvinar acts as an interface between alertness and cognition regulation,42 and plays an active role in attention regulation.43 In our previous studies, this thalamic region was repeatedly involved in the stimulating effect of light on cogni-tive brain responses in younger individuals.9,44 The alerting or attentional effect of light could indeed be initiated by a facili-tation or stimulation of information flow within thalamocor-tical loops, either directly in the thalamus or indirectly through other subcortical structures, such as the locus coeruleus or hypothalamus.44 Our results point to an age-related reduc-tion in the ability of light to stimulate alertness and attenreduc-tion through the pulvinar.
Interestingly, the age-related reduction in responses to light in a VTA-compatible area raises the intriguing possibility that the dopaminergic system is involved in age-related changes in the stimulating effect of light on brain responses. The VTA is an important source of dopamine in the brain, and is crucial both for the regulation of sleep and alertness and for cogni-tion and mood.45 In fact, the VTA is connected with nuclei of the ascending arousing system, including the raphe nuclei secreting serotonin, and sends projections to the SCN.46 In addi-tion, dopamine dysfunction is thought to play an important role in the cognitive decline found in healthy aging.47 Dopamine is also closely related to the effects of light and studies have suggested that dopamine modulates ipRGCs responses to light in the rat retina.48 Finally, light exposure seems to have a posi-tive effect on sleep and mood in Parkinson disease, which is directly related to dopamine dysfunction.49
Our results indicate that relative to younger individuals, light in older participants stimulates less in the dorsomedial
thalamus, VTA, amygdala, as well as the insula and cerebellum. All of these areas are crucial elements of a brain network reported to mediate salience detection,50 a process that influ-ences alertness, attention, and executive functions. Several of these areas, including the cerebellum, insula, and thalamus, are also involved in working memory51 and are affected by light exposure while performing an auditory task.9,52 Furthermore, we found a lower effect of light in older compared to younger individuals in the frontal operculum, which is involved in executive processes.50 Finally, the bilateral FPC/VLPFC was affected by light in younger individuals only, whereas it was significantly less affected by light irradiance increment in older individuals as compared to younger individuals. The FPC/ VLPFC is considered to be at the top of the executive control hierarchy and is involved in complex cognitive processes.53 We reported several times a stimulating effect of light in this area in young individuals,52,54 including during sleep loss when alert-ness and cognition are compromized.9 An age-related decrease in the effect of light within a network mediating salience detec-tion has important implicadetec-tions for alertness and cognidetec-tion, whereas a decrease in the effect of light on responses of several areas involved in working memory and cognitive control, and particularly within the FPC/VLPFC, could reflect a reduced ability of light to help cognitive performance in aging.
To achieve optimal recording conditions, we aimed (1) to eliminate behavioral performance differences between age groups through extensive task training, and (2) to improve sensitivity of our fMRI approach with the use of short-duration light exposures (< 1 min), which are too brief to significantly affect performance. An effect of light on cognitive performance was detected after 30 min of light exposure in young partici-pants using similar light irradiance and at a similar times of day as in the current study,3-5 suggesting that the brain responses to light during a cognitive task precede and trigger behavioral changes.44 We assume, therefore, that the differences in brain responses we observed will lead to performance differences. Future studies using prolonged light exposure will determine, however, how the decrease in brain responses to light translates into a reduction in the ability of light to improve or maintain performance in aging.
Older individuals had to recruit additional brain areas to achieve the same performances as younger individuals on the Figure 4—Overlay of the group differences in the brain responses to the task and in relation to light exposure. Significant group differences in the brain responses to the task are in pink (older > younger cf. Figure S2), the effect of light on brain responses is in blue (Y > O; cf. Figure 2) and the effect of changes in light irradiance is in yellow (Y > O; cf. Figure 3).
X 35 X 54 Y -13
INSULA OPERC - DLPFC PULV
OLDER > YOUNGER
2-back in darkness
Z -4
YOUNGER > OLDER
Impact of irradiance during the 2-back
FPC/VLPFC
YOUNGER > OLDER
SLEEP, Vol. 37, No. 1, 2014 Lighting Up the Aging Brain—Daneault et al working memory task in the magnetic resonance scanner. We
previously reported that the effect of light on cognitive brain responses was reduced following sleep deprivation in young individuals who were already recruiting additional brain areas to perform the task during sleep loss.9 These results showed that the stimulating effect of light reduces when the brain is already compensating for a challenging condition, suggesting that the ability of light to improve cognitive brain function is diminished. A direct comparison of the differences between age groups in the brain responses to the task and in the effect of light (Figure 4) suggests that some of the brain areas, more likely to be recruited by older individuals to perform the task such as the insula, the pulvinar, and the prefrontal cortex, lay in close vicinity to those less affected by light. It is therefore possible that part of the reduction in the stimulating effect of light in some brain areas is due to the fact that, in older indi-viduals, these brain areas are already recruited at an optimal/ maximal level to perform the task.
We chose to administer only blue light in our protocol so that different irradiance levels could be included, but we did not include other (longer) wavelengths. We are therefore limited in the interpretation of the respective involvement of the classic visual and the non-image-forming photoreception systems in the observed brain responses. We detected responses that were sustained for the duration of the exposure, which characterizes the non-image-forming response to light. We also used irradi-ance levels compatible with ipRGC recruitment, even when considering age-related reduction in lens transmittance.55,56 Therefore, it is plausible that, in addition to rods and cones, melanopsin-expressing ipRGCs and the non-image-forming photoreception system contribute to the effects we reported.
Our findings provide the first indications that the effect of light on cognition may be reduced in healthy aging and iden-tify potential neurobiological bases of this decline. The regions involved include the thalamus, tegmentum, and prefrontal cortex, as well as a network of areas reported to mediate salience detection. This age-related reduction in light effect was detected during the first part of the night, after the so-called “wake-main-tenance zone.”57 Additional data are necessary to corroborate these results because age-related differences in specific brain areas did not survive correction for multiple ROI used in the analyses. Future research should also assess how age-related differences are evolving in other circadian phases and under different sleep pressure conditions because the effect of light on cognitive brain responses has been shown to depend on time-of-day and sleep pressure.9 It will also be of great interest to investigate the responses to light of the aging brain during tasks aiming at other neuropsychological abilities, and in elderly populations with cognitive impairment. Our results show that even if the older brain shows a diminished response in compar-ison with a younger brain, it is still able to provide an increased activation when exposed to blue light during a cognitive task. We expect that future studies will demonstrate cognitive benefits of customizing the lighting environment of the elderly.
ACKNOWLEDGMENTS
Drs. Carrier and Vandewalle share senior authorship. Dr. Vandewalle’s current address: Cyclotron Research Centre, University of Liège, Belgium. Work was performed at
Functional Neuroimaging Unit, University of Montreal Geri-atric Institute, Montreal, Quebec, Canada. The authors thank André Cyr, Mathieu Desrosiers, Sonia Frenette, Carollyn Hurst, Pierre Maquet, Jean Paquet, Zoran Sekerovic, Annick Cartier for their help with data collection or for their critical comments on the analyses and manuscript.
DISCLOSURE STATEMENT
This was not an industry supported study. This work was funded by the Canadian Institutes of Health Research (CIHR), Natural Sciences and Engineering Research Council of Canada (NSERC), Fonds de la recherche en santé Québec (FRSQ) and by the International Office of the University of Montreal. The authors have indicated no financial conflicts of interest.
REFERENCES
1. Chellappa SL, Gordijn MC, Cajochen C. Can light make us bright? Effects of light on cognition and sleep. Prog Brain Res 2011;190:119-33. 2. Hatori M, Panda S. The emerging roles of melanopsin in behavioral
adaptation to light. Trends Mol Med 2010;16:435-46.
3. Chellappa SL, Steiner R, Blattner P, Oelhafen P, Gotz T, Cajochen C. Non-visual effects of light on melatonin, alertness and cognitive performance: can blue-enriched light keep us alert? PLoS One 2011;6:e16429. 4. Cajochen C, Munch M, Kobialka S, et al. High sensitivity of human
melatonin, alertness, thermoregulation, and heart rate to short wavelength light. J Clin Endocrinol Metab 2005;90:1311-6.
5. Lockley SW, Evans EE, Scheer FA, Brainard GC, Czeisler CA, Aeschbach D. Short-wavelength sensitivity for the direct effects of light on alertness, vigilance, and the waking electroencephalogram in humans. Sleep 2006;29:161-8.
6. Schmidt TM, Chen SK, Hattar S. Intrinsically photosensitive retinal ganglion cells: many subtypes, diverse functions. Trends Neurosci 2011;34:572-80.
7. Vandewalle G, Maquet P, Dijk DJ. Light as a modulator of cognitive brain function. Trends Cogn Sci 2009;13:429-38.
8. Vandewalle G, Schwartz S, Grandjean D, et al. Spectral quality of light modulates emotional brain responses in humans. Proc Natl Acad Sci U S A 2010;107:19549-54.
9. Vandewalle G, Archer SN, Wuillaume C, et al. Effects of light on cognitive brain responses depend on circadian phase and sleep homeostasis. J Biol Rhythms 2011;26:249-59.
10. Miller KJ, Siddarth P, Gaines JM, et al. The memory fitness program: cognitive effects of a healthy aging intervention. Am J Geriatr Psychiatry 2012;20:514-23.
11. Morris MS. The role of B vitamins in preventing and treating cognitive impairment and decline. Adv Nutr 2012;3:801-12.
12. Geda YE, Silber TC, Roberts RO, et al. Computer activities, physical exercise, aging, and mild cognitive impairment: a population-based study. Mayo Clin Proc 2012;87:437-42.
13. Riemersma-van der Lek RF, Swaab DF, Twisk J, Hol EM, Hoogendijk WJ, Van Someren EJ. Effect of bright light and melatonin on cognitive and noncognitive function in elderly residents of group care facilities: a randomized controlled trial. JAMA 2008;299:2642-55.
14. Benloucif S, Green K, L’Hermite-Baleriaux M, Weintraub S, Wolfe LF, Zee PC. Responsiveness of the aging circadian clock to light. Neurobiol Aging 2006;27:1870-9.
15. Daneault V, Vandewalle G, Hebert M, et al. Does pupil constriction under blue and green monochromatic light exposure change with age? J Biol Rhythms 2012;27:257-64.
16. Duffy JF, Zeitzer JM, Czeisler CA. Decreased sensitivity to phase-delaying effects of moderate intensity light in older subjects. Neurobiol Aging 2007;28:799-807.
17. Herljevic M, Middleton B, Thapan K, Skene DJ. Light-induced melatonin suppression: age-related reduction in response to short wavelength light. Exp Gerontol 2005;40:237-42.
18. Klerman EB, Duffy JF, Dijk DJ, Czeisler CA. Circadian phase resetting in older people by ocular bright light exposure. J Investig Med 2001;49:30-40.
SLEEP, Vol. 37, No. 1, 2014 Lighting Up the Aging Brain—Daneault et al 19. Nathan PJ, Burrows GD, Norman TR. The effect of age and pre-light
melatonin concentration on the melatonin sensitivity to dim light. Int Clin Psychopharmacol 1999;14:189-92.
20. Sletten TL, Revell VL, Middleton B, Lederle KA, Skene DJ. Age-related changes in acute and phase-advancing responses to monochromatic light. J Biol Rhythms 2009;24:73-84.
21. Lupi D, Semo M, Foster RG. Impact of age and retinal degeneration on the light input to circadian brain structures. Neurobiol Aging 2012;33:383-92. 22. Gibson EM, Williams WP, 3rd, Kriegsfeld LJ. Aging in the circadian
system: considerations for health, disease prevention and longevity. Exp Gerontol 2009;44:51-6.
23. Hofman MA, Swaab DF. Living by the clock: the circadian pacemaker in older people. Ageing Res Rev 2006;5:33-51.
24. Horne JA, Ostberg O. A self-assessment questionnaire to determine morningness-eveningness in human circadian rhythms. Int J Chronobiol 1976;4:97-110.
25. Johns MW. A new method for measuring daytime sleepiness: the Epworth sleepiness scale. Sleep 1991;14:540-5.
26. Buysse DJ, Reynolds CF 3rd, Monk TH, Berman SR, Kupfer DJ. The Pittsburgh Sleep Quality Index: a new instrument for psychiatric practice and research. Psychiatry Res 1989;28:193-213.
27. Beck AT, Epstein N, Brown G, Steer RA. An inventory for measuring clinical anxiety: psychometric properties. J Consult Clin Psychol 1988;56:893-7.
28. Steer RA, Ball R, Ranieri WF, Beck AT. Further evidence for the construct validity of the Beck depression Inventory-II with psychiatric outpatients. Psychol Rep 1997;80:443-6.
29. Kessel L, Lundeman JH, Herbst K, Andersen TV, Larsen M. Age-related changes in the transmission properties of the human lens and their relevance to circadian entrainment. J Cataract Refract Surg 2010;36:308-12. 30. Chylack LT Jr, Wolfe JK, Singer DM, et al. The Lens Opacities
Classification System III. The Longitudinal Study of Cataract Study Group. Arch Ophthalmol 1993;111:831-6.
31. Akerstedt T, Gillberg M. Subjective and objective sleepiness in the active individual. Int J Neurosci 1990;52:29-37.
32. Owen AM, McMillan KM, Laird AR, Bullmore E. N-back working memory paradigm: a meta-analysis of normative functional neuroimaging studies. Hum Brain Mapp 2005;25:46-59.
33. Protection-ICoN-IR. Guidelines on limits of exposure to broad-band incoherent optical radiation (0.38 to 3 microM). International Commission on Non-Ionizing Radiation Protection. Health Phys 1997;73:539-54. 34. Ashburner J. A fast diffeomorphic image registration algorithm.
Neuroimage 2007;38:95-113.
35. Peelle JE, Cusack R, Henson RN. Adjusting for global effects in voxel-based morphometry: gray matter decline in normal aging. Neuroimage 2012;60:1503-16.
36. Emery L, Heaven TJ, Paxton JL, Braver TS. Age-related changes in neural activity during performance matched working memory manipulation. Neuroimage 2008;42:1577-86.
37. Cappell KA, Gmeindl L, Reuter-Lorenz PA. Age differences in prefontal recruitment during verbal working memory maintenance depend on memory load. Cortex 2010;46:462-73.
38. Nagel IE, Preuschhof C, Li SC, et al. Performance level modulates adult age differences in brain activation during spatial working memory. Proc Natl Acad Sci U S A 2009;106:22552-7.
39. Johnson SC, Saykin AJ, Baxter LC, et al. The relationship between fMRI activation and cerebral atrophy: comparison of normal aging and alzheimer disease. Neuroimage 2000;11:179-87.
40. Remy F, Mirrashed F, Campbell B, Richter W. Verbal episodic memory impairment in Alzheimer’s disease: a combined structural and functional MRI study. Neuroimage 2005;25:253-66.
41. Revell VL, Skene DJ. Impact of age on human non-visual responses to light. Sleep Biol Rhythms 2010;8:84-94.
42. Coull JT, Jones ME, Egan TD, Frith CD, Maze M. Attentional effects of noradrenaline vary with arousal level: selective activation of thalamic pulvinar in humans. Neuroimage 2004;22:315-22.
43. Saalmann YB, Pinsk MA, Wang L, Li X, Kastner S. The pulvinar regulates information transmission between cortical areas based on attention demands. Science 2012;337:753-6.
44. Vandewalle G, Maquet P, Dijk DJ. Light as a modulator of cognitive brain function. Trends Cogn Sci 2009;13:429-38.
45. Luo AH, Aston-Jones G. Circuit projection from suprachiasmatic nucleus to ventral tegmental area: a novel circadian output pathway. Eur J Neurosci 2009;29:748-60.
46. Di Giovanni G, Di Matteo V, Pierucci M, Esposito E. Serotonin-dopamine interaction: electrophysiological evidence. Prog Brain Res 2008;172:45-71. 47. Eppinger B, Hammerer D, Li SC. Neuromodulation of reward-based
learning and decision making in human aging. Ann N Y Acad Sci 2011;1235:1-17.
48. Van Hook MJ, Wong KY, Berson DM. Dopaminergic modulation of ganglion-cell photoreceptors in rat. Eur J Neurosci. 2012;35:507-18. 49. Willis GL, Moore C, Armstrong SM. A historical justification for and
retrospective analysis of the systematic application of light therapy in Parkinson’s disease. Rev Neurosci 2012;23:199-226.
50. Seeley WW, Menon V, Schatzberg AF, et al. Dissociable intrinsic connectivity networks for salience processing and executive control. J Neurosci 2007;27:2349-56.
51. Cabeza R, Nyberg L. Imaging cognition II: An empirical review of 275 PET and fMRI studies. J Cogn Neurosci 2000;12:1-47.
52. Vandewalle G, Gais S, Schabus M, et al. Wavelength-dependent modulation of brain responses to a working memory task by daytime light exposure. Cereb Cortex 2007;17:2788-95.
53. Koechlin E, Hyafil A. Anterior prefrontal function and the limits of human decision-making. Science 2007;318:594-8.
54. Vandewalle G, Schmidt C, Albouy G, et al. Brain responses to violet, blue, and green monochromatic light exposures in humans: prominent role of blue light and the brainstem. PLoS One 2007;2:e1247.
55. Turner PL, Van Someren EJ, Mainster MA. The role of environmental light in sleep and health: effects of ocular aging and cataract surgery. Sleep Med Rev 2010;14:269--80.
56. Dacey DM, Liao HW, Peterson BB, et al. Melanopsin-expressing ganglion cells in primate retina signal colour and irradiance and project to the LGN. Nature 2005;433:749-54.
57. Dijk DJ, Czeisler CA. Contribution of the circadian pacemaker and the sleep homeostat to sleep propensity, sleep structure, electroencephalographic slow waves, and sleep spindle activity in humans. J Neurosci 1995;15:3526-38.
58. Groen G, Sokolov AN, Jonas C, Roebling R, Spitzer M. Increased resting-state perfusion after repeated encoding is related to later retrieval of declarative associative memories. PLoS One 2011;6:e19985.
59. Levens SM, Phelps EA. Insula and orbital frontal cortex activity underlying emotion interference resolution in working memory. J Cogn Neurosci 2010;22:2790-803.
60. Yanaka HT, Saito DN, Uchiyama Y, Sadato N. Neural substrates of phasic alertness: a functional magnetic resonance imaging study. Neurosci Res 2010;68:51-8.
61. Taylor KS, Seminowicz DA, Davis KD. Two systems of resting state connectivity between the insula and cingulate cortex. Hum Brain Mapp 2009;30:2731-45.
62. Menon V, Uddin LQ. Saliency, switching, attention and control: a network model of insula function. Brain Struct Funct 2010;214:655-67.
63. Langner R, Kellermann T, Eickhoff SB, Boers, F, Chatterjee A, Willmes K, Sturm W. Staying responsive to the world: Modality-specific and nonspecific contribution to speeded auditory, tactile, and visual stimulus detection. Hum Brain Mapp 2012;33:398-418.
64. Fan J, McCandliss BD, Fossella J, Flombaum JI, Posner MI. The activation of attentional networks. Neuroimage 2005;26:471-9.
65. Collette F, Van der Linden M, Laureys S, et al. Mapping the updating process: common and specific brain activations across different versions of the running span task. Cortex 2007;43:146-58.
66. Koppelstaetter F, Poeppel TD, Siedentopf CM, et al. Does caffeine modulate verbal working memory processes? An fMRI study. Neuroimage 2008; 39:492-9.
SLEEP, Vol. 37, No. 1, 2014 Lighting Up the Aging Brain—Daneault et al
SUPPLEMENTAL MATERIAL
Figure S1—Behavioral results. (A) Accuracy to the task (mean ± standard error of the mean [SEM]) during the first and second training sessions, for the two groups of subjects (Y,: younger subjects; O, older subjects). (B) Subjective sleepiness scores (mean ± SEM) throughout the experimental protocol. Dotted line, younger individuals; solid line, older individuals. (C) Accuracy to the task (mean ± SEM) in the functional magnetic resonance imaging (fMRI) scanner under the four conditions: darkness (D), low irradiance blue light (L), medium irradiance blue light (M), and high irradiance blue light (H), in younger (Y) and older (O) participants. (D) Reaction times (mean ± SEM) during the task in the fMRI scanner under the four conditions. n.s., not significant.
SLEEP, Vol. 37, No. 1, 2014 Lighting Up the Aging Brain—Daneault et al Figure S2—Brain responses to the two-back task irrespective of light condition. Statistical results (P < 0.001 uncorrected) overlaid over the mean structural image of all participants. Significant responses to the task common to both groups are displayed in green while group differences (older > younger) are in pink. See Table S1 for names of the brain regions corresponding to the letters and abbreviations. O, older individuals;Y, younger individuals. * Significant group differences P < 0.05 corrected for multiple comparisons.
SLEEP, Vol. 37, No. 1, 2014 Lighting Up the Aging Brain—Daneault et al
Table S1—Brain responses to the auditory two-back task independent of the light condition
Brain areas Side X, Y, Z Z score P References
Brain responses to the auditory 2-back task across all participants (irrespective of age group)
Thalamus [a] R
L 12, -10, 12* -14, -16, 8* 4.235.14 < 0.0010.001 1
Superior temporal gyrus (STG) [b] R
R L 54, -18, 4 64, -22, 6* -52, -16, 8 6.25 5.34 5.85 < 0.001 < 0.001 < 0.001 2
Intraparietal sulcus (IPS) [c] R
L 38, -54, 48* -38, -42, 48* 4.374.78 0.0010.001 3
Superior parietal gyrus (SPG) L
R -26, -64, 48* 14, -64, 56* 4.593.41 < 0.0010.017 2,4
Premotor cortex [d] R
L 30, 4, 52* -28, -6, 58 4.605.62 < 0.0010.003 1
Supplementary motor area (SMA) [e] L -2, 12, 54* 4.98 < 0.001 1
Cerebellum (Cereb) [f] R R R L 20, -50, -24 6, -66, -16 22, -60, -48 -30, -62, -28 5.84 5.68 5.28 4.56 < 0.001 < 0.001 < 0.001 < 0.001 7
Dorsolateral prefrontal cortex (DLPFC) [g] R
L R 44, 36, 36* -48, 32, 36* 48, 12, 34* 3.92 3.84 3.27 0.003 0.004 0.025 1,5 Ventrolateral prefrontal (VLPFC)/orbital frontoinsula R
L 32, 26, 2* -28, 28, 2* 4.043.76 0.0020.018 7
Superior frontal gyrus R 10, 22, 42* 3.93 0.003 2
Higher brain responses to the auditory two-back task in older versus younger participants
Thalamus dorsal [h] R L 10, -8, 14* -8, -4, 14* 3.303.28 0.0230.024 6,7 Insula [i] L R -34, 4, 8* 36, 6, 6* 3.443.98 0.0150.003 8 Cingulaire cortex [j] R L R R -6, -10, 34* -8, -28, 42* -2, 10, 34* 14, -30, 42* 4.41 4.39 3.96 3.76 < 0.001 < 0.001 0.003 0.006 9,10 Precentral gyrus R 36, -20, 36* 3.46 0.014 11
Supplementary motor area (SMA)[k] R 4, -8, 56* 3.57 0.011 12
Inferior parietal cortex R
L 60, -40, 40* -60, -28, 30* 4.093.61 0.0020.009 5,13
Superior parietal gyrus (SPG) [l] L
R -24, -54, 62* 12, -56, 72* 3.883.51 0.0040.013 9 Ventrolateral prefrontal (VLPFC)/orbital frontoinsula R
L 30, 20, 12* -38, 18, 6* 3.583.30 0.0100.023 7
Frontal operculum L
R -44, 30, 40* 56, 20, 16* 3.533.33 0.0120.021 2
Dorsolateral prefrontal cortex (DLPFC) [m] R
L R L L 28, 50, 28* -42, 28, 40* 30, 38, 34* -34, 54, 18* -54, 20, 12* 4.21 3.70 3.62 3.45 3.35 < 0.001 0.007 0.009 0.015 0.020 1,2,13 Frontopolar cortex (FPC) R 44, 58, 4* 3.58 0.010 14 Cerebellum (cereb) [n] R L R 16, -64, -20* -32, -52, -22* 6, -68, -16* 3.98 3.39 3.36 0.003 0.018 0.020 5,15 Higher brain responses to the auditory two-back task in younger versus older participants
No signicant voxels
Letters following the name of brain areas correspond to the identifying letters in Figure S2. P values are corrected for multiple comparisons over the entire brain volume (Familywise error approach) except for * which were corrected for multiple comparisons over small volume of interest taken a priori based on the literature (see Materials and Methods section). References: literature in which a priori locations were found to compute correction for multiple comparisons over small volume. L,left; R, right.