Better the Data You Know: Developing
Youth Data
Literacy in
Schools and
MASSA
Informal
Learning Environments
0
M
Erica DeahlB.A. Art, Yale University, 2007
CHUSETTS INS T1JTE TECHNOLOGY
AY
2
1 201
IBRARIES
Submitted to the Program in Comparative Media Studies/Writing in partial fulfillment of the requirements for the degree of Master of Science in Comparative Media Studies
at the Massachusetts Institute of Technology.
June 2014
©Erica Deahl, 2014. All rights reserved. The author hereby grants to MIT permission to reproduce and to distribute publicly paper and electronic copies of this thesis document in whole or in part in any medium now known or hereafter created.
Signature redacted
AUTHOR ... ...
Erica Deahl Department of Comparative Media Studies May 9,2014
CERTIFIED AND ACCEPTED BY..
Signature redacted
Heather Hendershot Professor of Comparative Media Director of Graduate Studies, CMSBetter the Data You Know: Developing
Youth Data Literacy in Schools and
Informal Learning Environments
Erica DeahlSubmitted to the Program in Comparative Media Studies/Writing on May 9,2014 in partial fulfillment of the requirements for the degree of Master of Science in Comparative Media Studies.
ABSTRACT
We live in an era of unprecedented growth in the use and impact of data. While large institutions are using data about individuals to drive decision-making, small organizations and civic hackers are using open and public data to innovate for social good. Meanwhile, the educational and informational resources to enable individuals to understand this data remain scarce. Individuals and communities are often unaware of the data being collected about them, the data they are contributing, and the ways in which that data is being used. Although the Open Data movement has given some individuals a new opportunity to interface with data directly, the public at large lacks the skills and knowledge to take advantage of this opportunity. This thesis argues that we need to support the public - especially youth - in developing data literacy, so that they are equipped to think critically and ethically about data. I make this case in four ways. First, I contextualize the need for data literacy by describing the historical evolution of institutional data collection practices, contemporary uses of data that have had a profound impact on institutions and individuals, and the potentially problematic consequences
of data modeling. Second, I propose a definition of "data literacy," situate the concept within the landscape of new media literacies, and describe settings, methodologies, and tools that
can be used to support it. Third, I analyze two data literacy initiatives that enable youth to use data to investigate and address real-world issues: one in an informal learning environment, Young Rewired State's Festival of Code, and the other in a public school, City Digits: Local Lotto. Fourth, I analyze the challenges facing data literacy initiatives - from the constraints of the public school environment, to the challenges of reaching diverse audiences and supporting
open-ended learning. I propose three design principles to guide researchers, educators, and practitioners in shaping future data literacy initiatives.
THESIS SUPERVISOR
Heather Hendershot
Acknowledgments
I would like to start by thanking my advisor, Heather Hendershot. Heather, thank you for supporting me throughout this process and for challenging me to write a better thesis.
I would also like to sincerely thank Sarah Williams, my thesis reader and mentor at the Civic Data Design Lab. Sarah, thank you for giving me the opportunity to work with you and for your advice and support along the journey. I couldn't have gotten here without you.
Thank you to my other collaborators from the City Digits project: Laurie Rubel,
Vivian Lim, Valeria Mogilevich, Pema Domingo-Barker, Chris Rhie, Lauren Shookhoff, Mathew Sullivan, Jose Ojeda, Vikash Dat, and the CDDL team. And thank you to the many wonderful high school students we worked with, who were the inspiration for this thesis.
Many thanks to Emma Mulqueeny, Kaitlin Dunning, Daniel O'Neil, Jeff McCarter, Andrea Hart, Joshua Prudowsky, Milena Marin, and Francois Grey for the opportunity to learn about your exciting work in the field, and to Philipp Schmidt, Mitch Resnick, Natalie Rusk, and Scot Osterweil for your ideas along the way.
I am extremely grateful that I was able to spend the last two years as part of the Comparative
Media Studies community. I met some of my closest collaborators and friends in the CMS class of 2014: Denise Cheng, Julie Fischer, Alexandre Goncalves, Jason Lipshin, Lingyuxiu Zhong - and special thanks and hugs to Eduardo Marisca for your input and encouragement. Thank you also to William Urrichio, Jim Paradis, Fox Harrell, and the other CMS faculty for creating an inspiring environment to work in, and to Shannon Larkin for your endless supply of chocolates and Kleenex.
I'd also like to thank my family, especially my mom, Lora Deahl, for reading drafts, giving me pep talks, and providing much needed support and understanding. Thank you also to Aditi Mehta and Ankita Deshpande for putting up with me, and to Zoey the cat for sitting on my lap and purring through many hours of thesis writing.
Finally, I would like to thank Rodrigo Davies. Rodrigo, thank you for having faith in me, for dropping everything to help me, for reminding me what I was working for when things were hard, and for keeping me smiling.
Contents
INTRODUCTION 9
CHAPTER 1: The Growing Institutional and Individual Impact of Data 15
1.1 The Growth of Data Collection... 16
1.1.1 The Census: Statistical Data Collection in the United States 16 1.1.2 From Planned Data Collection to Ubiquitous Data Collection 19 1.2 The Impact of Top-Down Data Management ... 20
1.2.1 Data Modeling from Systems Theory to the Smart City ... 21
1.2.2 Problems of Data Modeling...24
1.3 A Counter Move: Open Data and Bottom-Up Data Innovation ... 27
1.3.1 Institutions Move Toward Open Data ... 28
1.3.2 Grassroots Data Collection and Visualization 29 1.3.3 Limitations of the Open Data and Grassroots Data Movements ... 31
1.4 The Public Needs Better Data Literacy 34 CHAPTER 2: Data Literacy: Definition and Methods ... 39
2.1 What is Data Literacy?... .. . ... 40
2.1.1 Data Literacy Competencies ... 40
2.1.2 Situating Data Literacy...43
2.1.3 Benefits of Data Literacy...4...
2.2 How Can We Support Data Literacy?...48
2.2.1 Educational Technologies ... 50
2.2.2 Out-of-School Learning Models ... 5
CHAPTER 3: Two Initiatives for Building Socially Embedded Youth Data Literacy 61
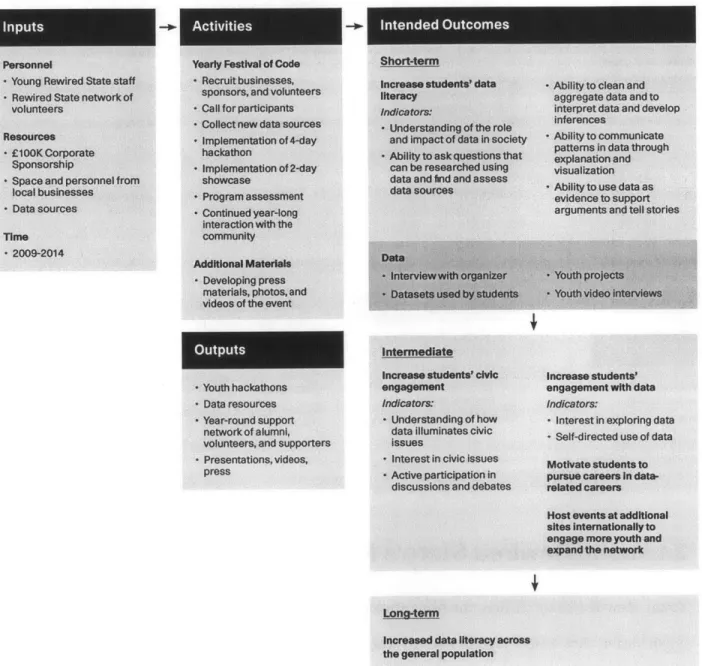
3.1 Young Rewired State's Festival of Code ... 64
3.1.1 Background...65
3.1.2 Program Overview...66
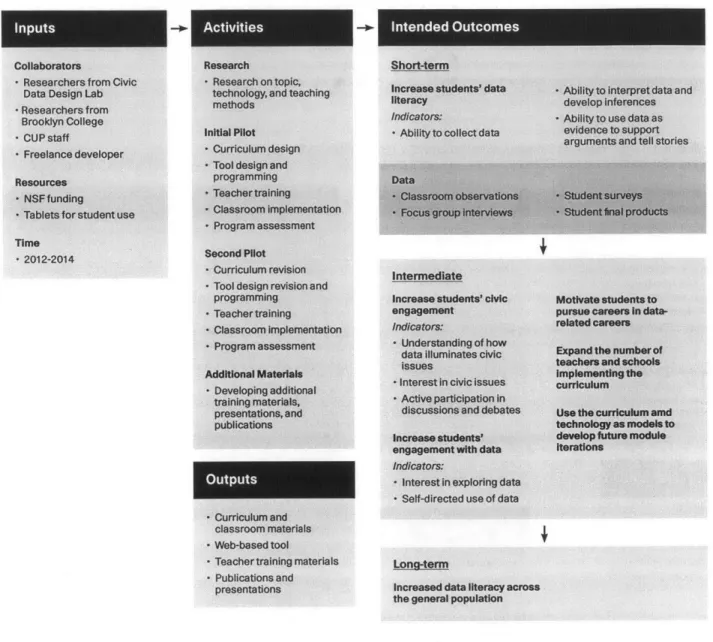
3.1.3 Outcomes 71 3.1.4 Conclusion 76 3.2 City Digits: Local Lotto 77 3.2.1 Background ... ... . ... 78
3.2.2 Program Overview...81
3.2.3 Outcomes 89 3.2.4 Conclusion 92 3.3 Conclusion_ 93 CHAPTER 4: Data Literacy Challenges and Design Principles ... 97
4.1 Institutional Constraints of Public Schools ... 99
4.2 Diversity and Access Challenges ... 104
4.3 Pedagogical Challenges ... ... 108
4.4 Conclusion 92
Introduction
I'm Zak, and I'm 8.... Some scientists were tracking students in the USA to like
find their interactions. We used that open data and got like these lists and programs to simulate disease spread, and [showed] it by turning little dots red to show that they're zombies. Basically, on the computer, it's like there's kind of nothing else in the world like it, basically. It's kind of like a new place, where you can make whatever you want.1
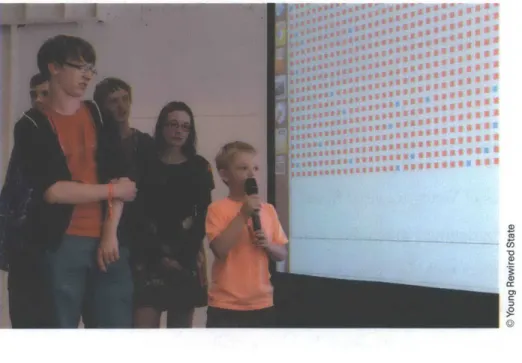
Zak first attended Young Rewired State's annual data hackathon in 2012 when he was
seven years old. He did not have much experience coding software. At the event, he was
inspired by the caliber of projects other young people were creating with data, and he was
determined to return the following year to win one of the top prizes. He spent the next
year experimenting with data and learning a variety of programming languages. When he
returned in 2013, he recruited a team of talented seventeen and eighteen year olds with
whom he collaborated to develop Contag.io, an app modeling the spread of a virus within
social groups in a high school. The app won the prize for the Best Example of Code.
Zak is an example of someone who is data literate. He knows how to find,
analyze, and create practical applications using data. His experience working with data
has given him the confidence and motivation to seek out further interactions with data, undeterred by the complexity of the tasks involved. His story is proof that, given the right
opportunities and resources, young people can become excited, engaged, and fearless
in their interactions with data-and furthermore, that they are capable of complex and
innovative work.
Yet Zak's experience is unusual. Few children his age-indeed, few
adults-have interacted with data, let alone feel empowered in their interactions. They are typically
the subjects of data, not the experts: governments collect statistical and demographic
information about them while corporations amass data about their consumption
preferences. This is especially true of young people, who have even fewer opportunities
than adults to learn about data, and whose own student data is carefilly tracked to
assess learning. Most people regard data with the same passivity that they once regarded
computers-as a technical artifact that is the property of experts and whose impact is
difficult to challenge. "Data literacy" is not a term that has been widely used-and when it
is, it most often refers to college and professional level education.
I am producing this thesis at a moment when this disconnect is more visible
than ever. On the one hand, critics have pointed out the ethical challenges inherent in
data-driven decision-making. In the news, we hear disturbing stories about how much
corporations know about us, such as Target finding out about a teenage girl's pregnancy
before her father did based on her shopping history. On the other hand, data modeling
has become a prominent practice-and data scientists are in high demand-because it has
proven to be so profitable.
At this moment of tension, I believe we have an opportunity to shift the dialogue
about data through youth education. Teaching young people to work with data will both
enable them to understand the ethical dilemmas of data, and therefore to correct for some
of the errors of the past in their future work, while also enabling them to participate in
and advance a new field. In addition, we have the opportunity to create spaces for applying
data literacy skills to social issues, rather than focusing on commercial purposes. Finally, we can change the perception that data exploration is too complex for young people. One
inspirational model is the recent evolution of youth computer science learning. We have
such as MIT's Scratch, which lowers the barriers to participation and enables young people
to create personally meaningful projects. We are in a moment when young people are
beginning to be able to do this with data.
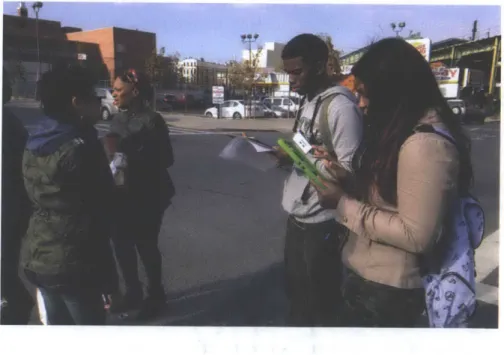
I was inspired to undertake my thesis on this topic after working on City Digits, a project that introduces high school students to data within the context of a social justice
themed math class. In the course of this project, I learned how challenging data literacy
initiatives can be to deliver, but I also witnessed the potential data literacy initiatives
have for engaging youth and getting them interested and involved in social issues. This
experience led me to understand the importance of defining goals and methods clearly. It
also convinced me of the importance of this endeavor, because I realized that data literacy
has broader implications for youth civic engagement. In my research, I wanted to explore
the multiple ways in which researchers, educators, and practitioners are approaching data
literacy-how initiatives are supporting data literacy, what challenges they face, and where
we should look for inspiration and direction as we move forward.
My work is guided by four central research questions:
1. How are initiatives in public schools and informal learning environments
supporting youth in developing data literacy?
2. What attributes characterize successful initiatives?
3. What are the challenges and limitations of these initiatives?
4. What principles should guide the design and implementation of future data
literacy initiatives and the digital technologies that support them?
I explore these questions in four chapters.
In Chapter 1, "The Growing Institutional and Individual Impact of Data," I describe
the new uses of data that have had a profound impact on institutions and individuals and
the problems with data modeling that have made it important for the public to become
data literate. The chapter is organized into four sections. The first section, "The Growth of
Data Collection," describes the historical evolution of data collection practices, focusing on
statistical data collection in the United States, the shift in recent years from planned data
collection to ubiquitous data collection, and the evolution of data collection and generation
as a profitable business model. I argue that the public needs better data literacy in order
to understand how their personal data is being used. The second section, "The Impact of
Top-Down Data Management," describes how governments have relied on predictive data
modeling and explores the ethical dilemmas and pitfalls inherent in data-driven
decision-making. I argue that the public needs better data literacy in order to understand and
question these decisions. The third section, "A Counter Move: Open Data and Bottom-Up
Data Innovation," describes how the Open Data movement has given individuals a new
opportunity to interface with data directly. Here, I explain that the public lacks the skills and
knowledge to take advantage of this opportunity. In the final section, "The Public Needs
Better Data Literacy," I argue that we need to support the public-especially youth-in
developing data literacy, so that they are equipped to think critically and ethically about data.
In Chapter 2, "Data Literacy: Definitions and Methods," I break down the
definition, context, and objectives of data literacy and describe the range of methods that
can be used to support youth in the development of data literacy. The chapter is divided into
two sections. The first section, "What is Data Literacy?" describes the cultural and social
implications embedded in the term "literacy," proposes a working definition of data literacy
and its range of objectives, and situates the concept of data literacy within the landscape of
new media literacies. The second section, "How Can We Support Data Literacy?" explores
the settings, methodologies, and tools that can be used to support data literacy. I describe
my theories of learning and aspirations for data literacy initiatives, exploring the possibilities
for project based, student centered, and culturally relevant learning. I end by mapping out
the range of technologies, out-of-school programs, and in-school programs that currently
In Chapter 3, "Two Initiatives for Building Socially Embedded Youth Data
Literacy," I focus on two data literacy initiatives that enable youth to use data to investigate
and address real-world issues, one in an informal learning environment and the other
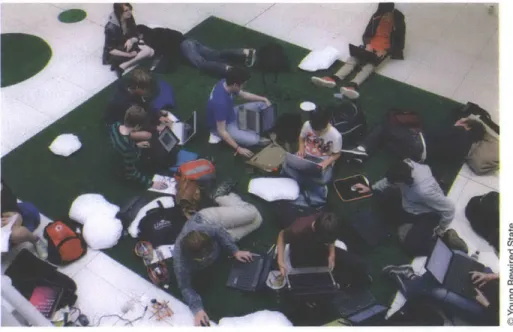
in a public school. The first case study describes Young Rewired State's Festival of Code,
a weeklong hackathon where youth create websites, apps, and algorithms using open
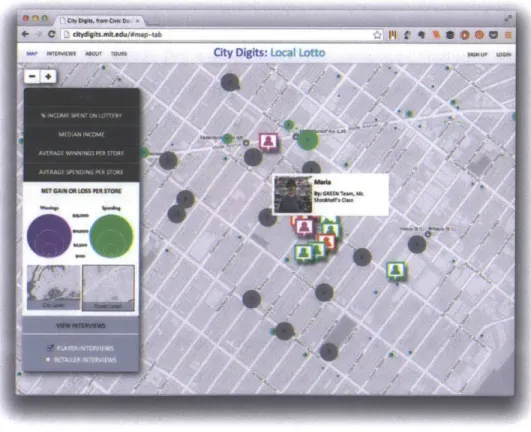
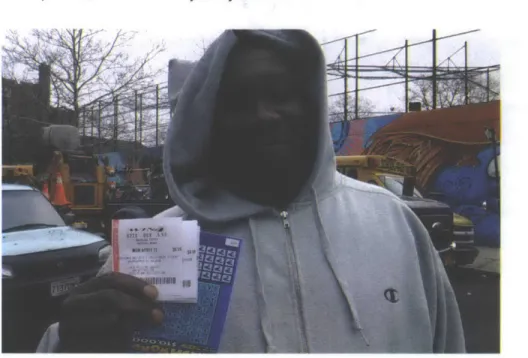
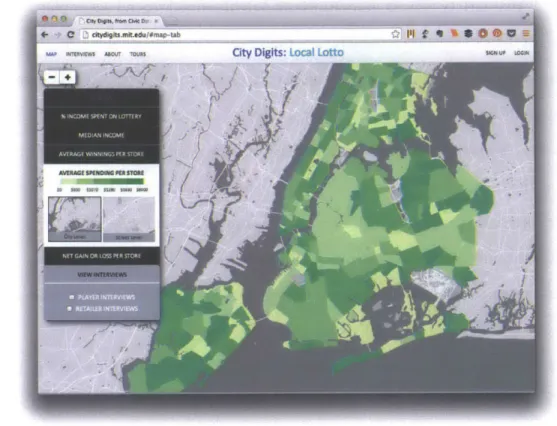
government data. The second case study describes City Digits: LocalLotto, a high school
math curriculum in which students collect and analyze data to investigate local social
justice issues. The case studies describe each project's background, curriculum design, implementation, and the challenges and successes experienced by the participating youth
and educators.
Finally in Chapter 4, "Data Literacy Challenges and Design Principles," I analyze
the challenges facing data literacy initiatives and define priorities for the design of future
data literacy initiatives. The chapter is organized into three sections, each of which describes
a challenge and proposes a corresponding design principle. The first section, "Institutional
Constraints of Public Schools," describes the challenges of aligning a data literacy
initiative with public school curriculum requirements, getting the support of teachers
and administration, and enabling student-centered learning within the constraints of the
school day. The second section, "Diversity and Access Challenges," describes the challenges
both in and out of schools of engaging diverse audiences from demographics traditionally
underrepresented in the fields of programming and computer science, and describes the
resource challenges which make replicating data literacy initiatives difficult for schools
and communities with limited resources. The third section, "Pedagogical Challenges,"
describes the barriers educators face as they adopt new content, methods, and technologies.
It also describes the pedagogical challenges of supporting student agency, tailoring learning
to diverse audiences, and replicating initiatives that are personalized for individuals or
customized for specific communities. To address these challenges I propose three design
principles to guide researchers, educators, and practitioners in shaping future data literacy
initiatives: 1. Create a data literacy ecosystem in and out of schools; 2. Design for a range
of levels, communities, and learning styles; 3. Create training resources for teachers and
support open-ended learning.
NOTES
1 Zak, 8 - Festival of Code Interview #yrs2013, 2013, http://www.youtube.com/watch?v=L Ky2OOEf5lI&feature=youtube-gdataplayer.
CHAPTER 1
The Growing Institutional and Individual
Impact of Data
We live in an era of unprecedented growth in the use and impact of data. Large institutions
are using data about individuals' spending habits and content preferences to drive
decision-making, and small organizations and civic hackers are using open government records
and public biographical data to innovate for social good. Meanwhile, the educational
and informational resources to enable individuals to understand this data remain scarce.
Individuals and communities are often unaware of the data being collected about them, the data they are contributing, and the ways in which that data is being used. In this
chapter, I argue that the public's understanding of data has failed to develop in proportion
to the increasing scope and impact of data, leaving citizens ill equipped to understand and
participate in processes that affect them.
This chapter is organized into three sections. In the first section, "The Growth of
Data Collection," I describe how data collection has become increasingly automatic and
ubiquitous-institutions are collecting an unprecedented amount of data, while individuals
are the passive subjects of data collection, often unaware of what data is being transmitted
from their computers and mobile devices. I argue that the public needs data literacy in
order to understand what is happening with their data. In the second section, "The Impact
of Top-Down Data Management," I describe how governments and corporations are
using data to drive decision-making, a practice that often improves efficiency but is prone
to human error. I argue that the public needs data literacy in order to understand and
question these decisions. In the third section, "A Counter Move: Open Data and
Bottom-Up Innovation" I describe how the open data movement and bottom-up data collection
practices have provided individuals with new opportunities to actively collect and use data.
I argue, however, that most individuals lack the skills and knowledge to participate in these
movements; therefore, the public needs better data literacy.
1.1 The Growth of Data Collection
Governments have long collected statistical data about individuals in order to provide
services, collect taxes, and enforce laws for a growing and changing population. A famous
early example of this practice is the Domesday book, a manuscript surveying large parts
of England and Wales that was completed in 1086 in order to ascertain the fiscal rights of
King William I of England. The survey, which records 13,418 places, was conducted by
a group of royal officers and was copied by hand on parchment.' From Domesday to the
present, we have witnessed a gradual increase in the amount of data that is collected and the
speed at which data is collected, processed, and analyzed.
1.1.1 The Census: Statistical Data Collection in the United States
The United States census is one longstanding data collection practice that illustrates that
this shift in the scope and speed of data collection has been unfolding for hundreds of years.
The census also shows that despite changing methods, there is a resemblance between the
challenges and ethical concerns that characterized data collection in the eighteenth century
agency in the collection and use of their own personal data.
First, the scope of information that the government collects about individuals has
dramatically increased. The first US census was conducted in 1790 and asked only for the
name, age, gender, and race of each member of the household, including slaves, in order to
facilitate taxation and military recruiting.2 The fact that a provision for a census was written
into the original Constitution reveals that leaders understood the value of data collection;
yet the limited scope of questions suggests that they did not yet have the methods, objectives, or needs to collect and analyze extensive results. Over the years, the scope of
data collected increased: the 1810 census began collecting economic data on manufactured
goods; the 1850 census collected social statistics on taxes, education, crime, and estate value;
and the 1940 census contained additional questions on internal migration, veteran status, and number of children born alive, information that helped measure the impact of the Great
Depression.3 This gradual increase in the amount of data collected reflects an emerging
understanding of how to use data to assess the nation's economic and social
conditions-and a growing technological capacity to do so.4
Second, new technological innovations, developed in response to the challenges of
measuring a growing population, have increasingly automated the processes used to collect
and analyze data. The greatest challenge for early census workers was data
tabulation-the processing of census data collected in 1880, for instance, was not completed until 1887, just three years before the next census.5 To address this issue, Herman Hollerith, a Census Bureau employee, developed an electronic tabulating machine that was first used during
the 1890 census. To process a card, "the operator simply placed it on a rubber pad, beneath
which lay dozens of tiny cups of mercury, and with a handle lowered a swinging array of
metal pins. On a panel facing the operator, four rows of ten clocklike dials represented the
various data items encoded on the card."6 Hollerith's electronic tabulator had an enormous
impact on the efficiency of census tabulation. More recent innovations have also increased
the efficiency of data collection as well as data tabulation. In 1960, the Census Bureau began
mailing a census form rather than sending enumerators door-to-door; and in the 1990s, the Bureau began using computer-assisted interviewing and electronic reporting. These
innovations and others have helped increase the fidelity and speed of data collection and
analysis. They also shape a larger narrative of data innovation: in 1896, Hollerith left the
Census Bureau to found the Tabulating Machine Company, which would later become the
International Business Machines Company (IBM)-the company that developed many of
the technologies underlying smart cities today.
Finally, since no data collection and analysis methods are immune from error, there
have been recurring concerns about the reliability of data reporting. Throughout the history
of the census, there have been doubts and disputes about the accuracy of census results, attributed to personal or bureaucratic data manipulation. In fact, even at the time of the first
census, George Washington and Thomas Jefferson expressed skepticism about the accuracy
of the results. Washington believed residents "did not want to be counted for religious
reasons or feared that the census was intended as a foundation for a tax," while Jefferson
estimated that the census population count of just under 4 million had missed around
100,000 residents.7 These doubts were likely colored by the fact that "political observers
equated rapid population growth with economic and political strength, and both men were
eager to showcase the new nation's growing prosperity."8 In the 1870 census, population
reports reflected drastically lower growth rates than expected. Under pressure from the
press, President Ulysses S. Grant ordered census recounts in Philadelphia, New York, and Indianapolis, where estimates suggested the most severe undercounting. Yet recent
analysis suggests that retroactive adjustments to census counts may have overcorrected
for undercounts, perhaps masking the toll of the Civil War.9 To further complicate the
picture, the public may have given inaccurate information, since "'age heaping'-an error
age-was common in nineteenth-century censuses and is readily discernible in plots of the
population's age distribution."10 These early accounts demonstrate the potential unreliability
of data sources and reveal the public's concerns about privacy, accuracy, and the intentions of
government agencies collecting data.
The census is only one example of a governmental institution increasingly relying
on rapid and widespread data collection. We can see similar patterns across sectors, such as
in education, with the National Center for Education Statistics, which collects, analyzes,
and reports data in order to study the condition of education in the United States; in health,
with the National Center for Health Statistics, which monitors the nation's health and
provides statistical information to guide governmental policies; and in law enforcement, with COMPSTAT, a technological system and management strategy that uses data
analytics to help American police agencies predict and prevent crime." The development
of new technologies has increased our capacity to process data and has revolutionized the
way we collect and understand data. However, at the same time, the challenges of early
data collection resonate with anxieties bound up in today's data collection practices. The
increasing range and scale of data means that the complexity of data collection and analysis
has also increased, leaving the public disempowered: power holders collect and control
data, while citizens affected by their decisions have little recourse for understanding or
challenging these practices.
1.1.2 From Planned Data Collection to Ubiquitous Data Collection
Data collection has shifted away from practices that require large organizations to gather
information manually toward systems and technologies that allow and in many cases
compel individuals to share information about themselves voluntarily. Through the
global spread of wireless network infrastructures that enable individuals to connect to the
Internet via mobile devices, data collection has become ubiquitous. Wireless networks not
only enable individuals to be online more often and from more locations: they have also
succeeded in bringing individuals on the other side of the digital divide online for the first
time. Smartphones, with their built-in microphones, cameras, and GPS are built for data
collection and can be used to quantify personal habits. Today, every person who owns a
smartphone is constantly collecting and transmitting data over wireless networks.
Many of the largest companies have developed business models that rely on this
phenomenon: they depend on generating and collecting data while giving their products
away for free. For instance, Google provides a range of services free of charge because the
personal data users provide is more profitable than charging for services. Essentially, data
has become a more valuable commodity than cash for some businesses-ubiquitous data
collection has become a big business.
Whereas governments and institutions once actively collected data from individuals, today, individuals themselves are collecting and transmitting the data, whether or not they
are aware of it. Previously, in other words, individuals knew exactly what information they
were reporting; yet a key characteristic of ubiquitous data collection practices today is that
data is opportunistically and passively collected, whether or not the collectors know-or
inform the users-what they are going to do with it." Meanwhile, the new "Internet of
things" means that there are many more objects than humans connected to the Internet.
Individuals' devices are also connecting, and everything they do is being measured and
transmitted. Most individuals do not understand these processes; they need data literacy in
order to understand what data they are transmitting and what is happening with their data.
1.2 The Impact of Top-Down Data Management
As data collection has escalated and data has acquired greater value, it has been increasingly
governments to corporations. This is an evolution that has played out dramatically in the
management of cities. Over the years, city governments and their commercial partners have
experimented with new waves of data-centered urban models and technologies to improve
the efficiency of services in cities and to address the issues that characterize city life, with
varying impact on the residents who inhabit them. The promise underlying the use of data
in urban planning is the very same thing that makes it potentially problematic: predictive
modeling can be used to make assumptions; it is possible to predict the probability of an
outcome based on an existing related data set.
1.2.1 Data Modeling from Systems Theory to the Smart City
The systems theory of planning, in which data is used to calibrate self-regulating systems,
arose in the 1960s as a response to the growing belief in the inter-relatedness of diverse
urban systems and the growing complexity of transportation planning. Systems theory
places an emphasis on activity, dynamism, and change, relying on an ongoing process
of monitoring, analyzing, and intervening in situations. 4 The movement became more
widespread in city planning due to the development of computers capable of handling
complex data, and a generation of planners embraced the optimism of the "abstract, highly
technical (and frankly abstruse) language of systems theory, with its talk of mathematical
modelling, 'optimisation' and so on."5 This school of thought had its origins in cybernetics,
the theory that statistical mechanics can be used to predict the future of a system and that
precise modeling of systemic relationships can be used to optimize performance. Systems
theory was widely espoused in urban planning literature such as McLoughlin's 1969 Urban
and Regional Planning: A Systems Approach and Jay Forrester's 1969 Urban Dynamics, and it
was also put in practice to different extents in towns and cities across the United States.
Although systems theory fell out of favor in urban planning because the technology
of the 1960s and 70s proved incapable of handling the complexities of urban systems,
numerous corporations continued to develop more sophisticated and automated methods
of data modeling that were used in-house to increase efficiency and productivity. Thus, corporations such as IBM, Siemens, and Cisco, which had successfully implemented
predictive models on a corporate scale within their own businesses, took a leading role in
initiating the resurgence of predictive modeling in urban planning in the early 2000s with
the concept of the "ubiquitous city" or "smart city."16 For these companies, the smart city
was an opportunity to market their technologies as municipal services, thereby developing
profitable long-term relationships with city governments.
The smart city is a futuristic, utopian city in which technology and data are
optimized to solve the inefficiencies of city management and ease the everyday frictions of
city life. In such a city, coordinated traffic-control systems eliminate gridlock,
efficiency-optimized systems control electricity flow, and sophisticated monitoring minimizes the
impact of natural disasters. The idea of the smart city closely resembles the dream of
systems theory advocates in the 1970s. The companies at the forefront of the smart cities
movement believe that improved methodology and advanced technology, better able to
respond to complex input, will allow a new generation of city planners to realize their
utopian vision while avoiding the issues that hindered systems theorists in the past.
The original vision of the smart city was a completely reimagined city, accomplished
by constructing experimental utopian cities from the ground up with a new kind of
infrastructure built in. New Songdo, South Korea, was an ambitious prototype, begun
in 2005, exemplifying this vision. New Songdo was imagined as an energy-efficient
"international business district" where all major information systems shared data, connected
by a digital infrastructure built into houses, streets, and office buildings. In the early days
of its construction, John Kim, vice president for strategy at New Songdo City Development, described it this way: "The same key can be used to get on the subway, pay a parking meter, see a movie, borrow a free public bicycle and so on. It'll be anonymous, won't be linked
to your identity, and if lost you can quickly cancel the card and reset your door lock....
[Residents will enjoy] full videoconferencing calls between neighbors, video on demand
and wireless access to their digital content and property from anywhere in Songdo."18
These services were all to be provided by Cisco, which developed an exclusive partnership
with New Songdo to provide digital infrastructure and services. For Cisco, the partnership
represented the kick-off of a new industry, whereby the company would offer all urban
necessities as a single internet-based utility. Today, New Songdo is only half-finished
and is a financial and technological disappointment. Townsend points out that given the
innovations in the years since construction began on New Songdo, building a city around
RFID seems anachronistic.9
Today, the term "smart city" more aptly refers not to new, specially designed cities, but rather to the practice of retrofitting existing cities to make them "smarter," a concept
popularized by IBM's "Smarter Planet" campaign, which was originally launched in 2008.
In a red paper published in 2011, IBM defines a smarter city as "one that makes optimal
use of all the interconnected information available today to better understand and control
its operations and optimize the use of limited resources."20 IBM partnered with Portland, Oregon in 2009 to model the relationships among the city's economy, housing, education, public safety, transportation, healthcare, government services, and utilities in order to
simulate how city systems work together and to suggest opportunities for innovation.
The goals of the project epitomized systems theory: to develop a model to improve
long-range planning and help the municipal government reduce negative consequences of their
services and to uncover opportunities for efficiency.21 In 2011, IBM partnered with Rio de
Janeiro's mayor, Eduardo Paes, to create a sophisticated Operations Center that predicted rainfall and flooding across the city, mapped car accidents and power failures, and integrated
information coming in from phone, radio, e-mail, and text message reports so that
government services could respond more quickly to events and access real-time information
while in the field.22 The solutions for Rio were an effort to augment flawed infrastructures
incapable of responding to crime and disaster. The dream of the smart city is still pervasive
today. A recent article in China Daily describes China's current preparation for a "smart city
construction boom," initiated in November 2012, which will implement dramatic changes
in 193 trial cities, in fields ranging from transportation to the financial sector. Both Beijing
and Shanghai will focus on developing a network to "facilitate transportation, tele-medicine, and smart homes," while Shanghai will specifically focus on "developing wireless broadband
technology and boosting the application of intelligent technology"23 These efforts to
smarten up cities in China, as well as the models that preceded them, rely on predictive
modeling to radically change existing infrastructures.
1.2.2 Problems of Data Modeling
Although data modeling has in many instances succeeded in improving efficiency, urban
planners have repeatedly failed to meet their objectives as they put data analytics into
practice in city management. Predictive modeling's first great flaw is that it rarely accounts
for human error; data is seen as being entirely objective, not vulnerable to mistakes in
collection or interpretation. Second, modeling tends to oversimplify complex factors and
point toward a single solution. Finally, the rhetoric of predictive modeling was developed
around the singular goal of improving efficiency, a motivation that was heavily influenced
by corporations and thus isn't always in the best interest of city residents. There often
emerges, in other words, a predictable conflict between profit-driven models and the needs
of citizens, needs which do not always fit neatly into monetizable problem-solution models.
First, there is minimal acknowledgement of the possibility of human error or misuse
in data modeling: data is often assumed to be more objective than human perception. Yet
there are ample opportunities for human error in the collection or analysis of data due to
can't speak for themselves, and data sets-no matter their scale-are still objects of human
design.... [T]here is a problematic belief that bigger data is always better data and that
correlation is as good as causation."2 Predictive city modeling developed from a desire to
improve services. Yet its overreliance on opaque technologies, without a corresponding effort
to educate the public or even the policy makers responsible for making data-based decisions, resulted in misuse by decision makers. This is the peril of an overreliance on data; when data
modeling is used without taking into consideration existing local knowledge, there can be
huge blind spots, intentional or not. Exacerbating this problem is the fact that relying on
conclusions drawn from data, using abstruse methods that seem authoritative, makes policy
harder for opponents to critique.
Adam Greenfield and Anthony Townsend both point to one of the most devastating
failures of data modeling in the 1970s, the fires that resulted from the RAND Corporation's
work for the New York Fire Department, as recounted in Joe Flood's 2010 The Fires.25 New
York City mayor John Lindsay and fire commissioner John O'Hagan sought the advice
of the RAND Corporation, a think tank, to use statistics and systems analysis to help
optimize performance of the fire department. RAND conducted a series of studies between
1973 and 1975 on FDNY response-time to determine the optimal distribution of fire
stations. Due to inaccurate reporting of data by fire captains and simplified formulas that
failed to account for fire station capacity and the effect of traffic on response time, RAND
recommended the closure of numerous fire stations concentrated in poor areas of the
city. When these closures were implemented, many of the remaining fire companies were
overwhelmed and numerous fires in the Bronx and other areas displaced more than a
half-million residents.26 In this instance, data modeling was used to provide "scientific" evidence
that confirmed Mayor John Lindsay's existing biases against stations where union leaders
were based. This failure came at the expense of many of the city's most underprivileged
communities.
A more recent example that illustrates skewed data modeling is Google's 2012
Flu Trends predictions, which vastly overestimated flu rates based on the prevalence of flu-related Internet searches. Google, whose prediction was twice as high as the Center for Disease Control's prediction the same year, discovered that the prevalence of Internet searches for flu-related terms does not correlate directly with flu rates. The 2012 snafu did not have fatal consequences, but it serves as a reminder that predictive probabilities are not always accurate.
Second, the logic of the smart city relies on the assumption that data will intrinsically reveal solutions, rather than just informing them. Implicit in the rhetoric
of the smart city is an "unreconstructed logical positivism" which suggests the world is perfectly knowable and its relations can reliably be encoded in data sets without distortion.2
1
"As applied to the affairs of cities, it is effectively an argument there is one and only one universal and transcendently correct solution to each identified individual or collective
human need; that this solution can be arrived at algorithmically, via the operations of a technical system furnished with the proper inputs; and that this solution is something which
can be encoded in public policy, again without distortion. 29 This is the belief that creating
a better model-one that accounts for complex inputs-will fix the errors encountered
in the past. Yet there will always be gaps or blind spots in data, and by indiscriminately
following models without fully realizing their limitations, governments hazardously
sidestep the democratic process. And since plans for smart cities so often suggest sweeping
infrastructural change, the stakes and the risks are high.
Finally, since corporations shaped the agenda of the smart city, the primary
professed goal is a corporate agenda: to improve efficiency. Yet policies that emphasize
efficiency at the sacrifice of other values are often not in the best interest of citizens. As
Adam Greenfield argues, the smart city rhetoric is a form of authoritarianism that takes
He argues that part of the smart city strategy is to change the behavior of residents to help
improve the efficiency of the new model-a form of collusion that encroaches on autonomy
and self-determination. 0 In other words, instead of creating technologies to better serve
people, smart cities demand that residents change their lifestyles to serve technology and
corporate interests.
These issues all have a profound impact on individual residents. Because data
collection is ubiquitous in everyday technologies, individuals themselves are being modeled.
Governments model their statistical data; corporations model their consumer data. In this
scenario, individuals have become the product. They are not consulted or considered in
top-down decisions that deeply impact them. Most individuals do not know what predictive
data modeling is, let alone have the knowledge to evaluate and point out the shortcomings
of the complex and opaque urban models implemented in their cities. Clearly, the public
needs better data literacy in order to understand and question these decisions and processes.
1.3 A Counter Move: Open Data and Bottom-Up
Data Innovation
The open data movement attempts to correct this problematic asymmetry between the
impact of data on individuals and their ability to conceptualize data by making local,
regional, and national data, especially publicly acquired data, available to the public in
a standardized form that allows for direct manipulation." In this movement, hackers, journalists, and activist organizations are working with data to draw attention to important issues and to build bottom-up services and technologies to respond to issues in their
communities. Embedded within the growing culture of open data is the understanding that
data is a publicly owned asset.
1.3.1 Institutions Move Toward Open Data
An increasing number of countries across the globe are implementing open data policies.
Open government data comprises an important component of the Open Government
Partnership, an initiative launched in September 2011 that includes 55 countries. Online data portals such as data.gov in the United States, launched in May 2009, and data.gov.
uk in the UK, launched in January 2010, have served as models for efforts in numerous
other countries. Although there are no recognized standards that define what open
data really entails, the Open Data Index,12 an effort to measure and classify open data
offerings across the globe, has defined a set of criteria for classifying open data initiatives
that gives us a sense of current expectations. The Index looks at the availability of data
such as transportation timetables, government spending, and legislation and asks a series
of questions to determine how public and accessible this data is online: Does the data
exist? Is it digital? Is it publicly available? Is it free of charge? Is it online? Is it
machine-readable? Is it available in bulk? Is it openly licensed? Is it up-to-date? According to the
Index, the UK, US, and Denmark rank highest in openness, but most of the 70 countries
surveyed meet at least some of the criteria.
The underlying idea of the movement is that public data should be available online
in order to increase transparency and accountability and promote public participation in
decision-making and social innovation. In President Obama's words: "One of the things
we're doing to fuel more private-sector innovation and discovery is to make vast amounts
of America's data open and easy to access for the first time in history. And talented
entrepreneurs are doing some pretty amazing things with it."" Of course, governments still
withhold much of the data they collect; in light of the NSA's revelations about PRISM, for
example, Obamas words must be taken with a grain of salt.
Democratic governments have been buying into the open data movement for two
second, they are responding to pressure from civil society over the last several years. In
Iceland, for instance, the open data movement gained traction after the collapse of the
financial system in 2008, when negligence by government and regulators was blamed. After
the collapse, there was an increased demand for transparency and access to public data.4 To
restore public confidence, the Icelandic government made open government a high priority
by implementing policies such as opening governmental data and even crowdsourcing
a constitutional bill, which ultimately failed but set a precedent for a new participatory
decision making process.35
Access to open government data can be seen as an extension of citizens' right
to information, the notion that the public has the right to access information held by
government on request and that governments have an obligation to actively disseminate
information to the public on matters of public interest. Although the right to information
has long been considered a basic right and has informed legislation in many countries, open government data is still seen as a privilege, and there are not yet established standards
about how data should be shared.3 6 It is very much an evolving practice that is currently in a critical moment of definition.
The open data movement has propagated a shifting notion of who the users of
data are. In the long history of data, citizens were always considered to be end-users who
provided their data to the collector and then interfaced with the end-products of
data-driven government innovations. In this new vision, government concedes that citizens can
best define and resolve the problems that plague their own communities-implying that
communities should take the data provided and use it to address their needs.
1.3.2 Grassroots Data Collection and Visualization
Many organizations and individuals have taken advantage of open data resources. There is a
growing group of not-for-profits that use open data to address issues in local communities,
often with the collaboration or sponsorship of local governments, innovating in ways
that government cannot. For example, Code for America's 2013 National Day of Civic Hacking encouraged programmers across the country to partner with organizations and
city governments to use public data for local problem-solving. Data Kind, a not-for-profit
in New York City, aims to connect volunteer data scientists and developers with social
organizations that want to use insights from data to serve their communities but lack the
expertise or resources to do so. These organizations aim not only to solve specific problems
but also to spread awareness and to create a community interested in using technology and
data for civic innovation.
The result of such efforts are applications like Code for America's
"Adopt-a-Hydrant," which called on Boston residents to help dig out fire hydrants during snow
storms, "Discover BPS," which helped Boston residents navigate complex requirements for
choosing a public school, and "Where's My School Bus?" which enabled parents to track
their child's bus in real-time. These interventions set a precedent for using technology to
enable citizens and government to work together to develop flexible bottom-up responses to
city issues using open data.
In addition to using open government data, many organizations have also created
applications that enable everyday citizens to provide information reflecting their local
knowledge and filling in gaps in government data. For instance, Ushahidi is a participatory
mapping platform that was originally developed in 2008 to allow Kenyans to submit
reports of violent incidents, using the Internet and mobile phones.7 The platform is now
used by organizations around the world to crowdsource information. Another example is
SeeClickFix, an online 311 platform that allows citizens to report neighborhood issues.
These applications rely on everyday citizens to identify the issues that concern them and to
1.3.3 Limitations of the Open Data and Grassroots Data Movements
Despite the promise of open government and grassroots data movements, most individuals
are afforded only minimal participation in data practices. While in a growing number of
instances everyday citizens have been encouraged to take a more active and deliberate role in
data collection, the civic hackers creating these applications and visualizations, and therefore
setting their agenda, are expert data scientists, programmers, and designers.
Although data has become ubiquitous and has a profound impact on individuals'
lives, the public's understanding of data has not grown proportionally. The open data
movement suggests that individuals and communities should use government data to
problem solve and become more engaged with policy, yet it does not equip them with
the resources to do so. Instead, governmental agencies appear to want to transfer the
responsibility for data interpretation to citizens who do not possess the necessary skills for
collecting or processing data.
Most individuals are still excluded; even in cities and countries that are at the
forefront of the open data movement, there is a data divide. We can dissect this problem
using the lens of the four critiques of open data set forth by Rob Kitchin: "open data
lacks a sustainable financial model; promotes a politics of the benign and empowers the
empowered; lacks utility and usability; and facilitates the neoliberalisation and marketisation
of public services."" I want to focus on two of the issues that Kitchin identifies: that open
data empowers the empowered, and that it lacks utility and usability.
First, I will address the question of empowerment. Most of the individuals who are
currently taking advantage of open data resources belong to an elite community of open
data and transparency activists and civic hackers-those who were lobbying for access in
the first place, and specialists in data science, who built businesses around open data. These
practitioners often do innovative work with widespread benefits, but they do not always
represent a larger public because data mining is not a practice accessible to everyday citizens.
These practices do, in a sense, represent bottom-up innovation, since individuals and small
organizations are working within alternative infrastructures independent of government or
industry. However, when independent organizations define problems or propose solutions, they do not necessarily consult or represent the communities they are attempting to assist.
Since data requires access to education, infrastructure, and technology, it favors
people who have more resources over those without means. Solly Benjamin and his
colleagues discovered one example of this unequal advantage while studying the impact of
the digitization of land records in Bangalore.
Their findings were that newly available access to land ownership and title information in Bangalore was primarily being put to use by middle and upper income people and by corporations to gain ownership of land from the marginalized and the poor. The newly digitized and openly accessible data allowed the well-to-do to take the information provided and use that as the basis for instructions to land surveyors and lawyers.. .to challenge titles, exploit gaps in titles, take advantage of mistakes in documentation, [and] identify opportunities and targets for bribery."
In addition, applications that seek citizen participation are less likely to capture
the opinions of the disadvantaged, who may lack access to the necessary technology. Kate
Crawford points out that, "if cities begin to rely on data that only comes from citizens
with smartphones, it's a self-selecting sample-it will necessarily have less data from those
neighborhoods with fewer smartphone owners, which typically include older and less
affluent populations."4 For instance, applications like SeeClickFix and the Boston Office
of New Urban Mechanics' Street Bump app, which collects smartphone data from drivers
going over potholes, are both affected by this issue.
Second, open data lacks utility and usability. Open data movements require a
genuine commitment from governments to maintain data portals in order to provide
complete and up-to-date information. They must also commit to publishing data
unconditionally, despite the fact that the results might be critical of government policies.
government transparency. There was a great amount of excitement about the launch,
because Kenya was only the second African country to open its data. Yet as of 2013, the
portal has not been updated in nearly a year, and traffic is stagnant. The government has
been reluctant to release its data, and most Kenyans either do not know how to use the site
or are not aware it exists.4' To truly increase accessibility and utility, open data initiatives
must provide data that is complete, up-to-date, and useful to the public.
Governments have been struggling to meet this last criterion, which relates to
the form data takes and how easy it is for individuals to interpret. Data is difficult to
understand; it is rarely possible to simply look at a data set and draw conclusions from
it. We require aids for comparing data in a way we can understand. Raw data sets, in the
form of spreadsheets or lists, are useless to the general public since analyzing and drawing
conclusions from raw data requires access to sufficient education and technology.
Compounding this difficulty is the issue that standard methods of communicating
data to the public-namely data visualizations-are also problematic. Visualizations are
often used as a gesture toward accessibility rather than as an actual window into content.
They are not always accurate, easy to interpret, or neutral. The purpose of data visualization
is to "discover the structure of a (typically large) data set. This structure is not known a
priori; a visualisation is successful if it reveals this structure."42 Yet every data set contains
multiple truths, and it is impossible to capture every truth in a visual representation.
Visualization is therefore an act of interpretation, not inherently one of communication.
We can't rely on institutions to process and present data sets for us in an objective manner,
because beliefs and biases are encoded into visualizations. Visualization is used just as often
to obscure information as to reveal it.
1.4 The Public Needs Better Data Literacy
Individuals are increasingly impacted by data wielded by government and corporate
institutions. Meanwhile, the rising culture of open data and civic hacking has made data more visible, more accessible, and more malleable. Despite data's problems and ambiguities, the ability to collect and analyze data is a powerful competency that allows individuals
to navigate our data-rich society and innovate for social good. The public has a new
opportunity to participate in the data dialogue, but they lack the resources and expertise to
do so. The public needs better data literacy-and I believe this is especially important for
young people so they learn to participate in an increasingly data-rich society. By supporting
young people in developing data literacy, we are giving the data scientists of the future the
tools to think critically and ethically about data.
In this Chapter, I illustrated the societal factors that have made data literacy so
important today and described why we have a new opportunity for supporting data literacy
among the public. In the following chapters, I will explore what it means to be data literate, how initiatives in different learning environments are supporting the development of data
literacy, and what strategies we can adopt to advance this field in the future.
NOTES
1 H. C. Darby, Domesday England (Cambridge University Press, 1986), 336.
2 Census History Staff US Census Bureau, "1790 Overview - History - U.S. Census Bureau," accessed December 11, 2013, http://www.census.gov/history/www/through. thedecades/overview/1790.html.
3 Census History Staff US Census Bureau, "Counting the Population - History - U.S.
Census Bureau," accessed December 11, 2013, http://www.census.gov/history/www/ innovations/data collection/countingjthe-population.html.
4 In 1940, with the introduction of statistical sampling, there was a shift to asking only a random sample of the population to provide additional information and using their results to extrapolate information about the rest of the population, marking an evolution toward the predictive data modeling that is pervasive today.
5 Anthony M. Townsend, Smart Cities: Big Data, Civic Hackers, and the Questfor a New Utopia (New York- W.W. Norton & Company, Inc., 2013), 59.
6 Ibid., 60.
7
J.
David Hacker, "New Estimates of Census Coverage in the United States,1850-1930. (cover Story)," Social Science History 37, no. 1 (Spring 2013): 75,
doi: 10.1215/01455532-1958172.
8 Ibid.
9 Ibid., 95.
10 Ibid., 83.
11 "Standards for Education Data Collection and Reporting (SEDCAR)," December 31, 1991, http://nces.ed.gov/pubsearch/pubsinfo.asp?pubid=92022; "About NCHS
- NCHS Fact Sheets -Overview," accessed May 5,2014, http://www.cdc.gov/nchs/ data/factsheets/factsheetoverview.htm; James
J.
Willis, Stephen D. Mastrofski, and David Weisburd, "Making Sense of COMPSTAT: A Theory-Based Analysis of Organizational Change in Three Police Departments," Law & Society Review 41, no. 1 (March 1, 2007): 147-88, doi:10.1111/j.1540-5893.2007.00294.x.12 Townsend, Smart Cities.
13 Kate Crawford et al., Big Data, Communities and Ethical Resilience: A Framework for Action, Community Resilience through Big Data and Technology (Bellagio Center:
Rockefeller Foundation, 2013), 2.
14 Nigel Taylor, Urban Planning Theory Since 1945 (SAGE, 1998), 63.
15 Ibid., 64.
16 Townsend, Smart Cities.
17 Pamela Licalzi O'Connell, "Korea's High-Tech Utopia, Where Everything Is Observed," New York Times 5 (2005), http://tofugalaxy.com/wp-content/ uploads/2010/11/nytimes.pdf.
18 Ibid.
19 Townsend, Smart Cities, 26.
20 Michael Kehoe et al., "Smarter Cities Series: A Foundation for Understanding IBM Smarter Cities," An IBM Redguide Publication, 2011, http://www.redbooks.ibm.com/ redpapers/pdfs/redp4733.pdf.
21 "IBM and City of Portland Collaborate to Build a Smarter City," CTB10, August 9, 2011, http://www-03.ibm.com/press/us/en/pressrelease/35206.wss.
22 Natasha Singer, "I.B.M. Takes 'Smarter Cities' Concept to Rio de Janeiro," The New York Times, March 3,2012, sec. Business Day, http://www.nytimes.com/2012/03/04/ business/ibm-takes-smarter-cities-concept-to-rio-de-janeiro.html.
23 "China Prepares for Smart City Construction Boom," accessed December 13, 2013, http://www.chinadaily.com.cn/business/2013-10/16/content_17035874.htm.
24 Kate Crawford, "Think Again: Big Data," Foreign Policy, May 10, 2013, http://www. foreignpolicy.com/articles/2013/05/09/thinkagain-big-data.
25 Adam Greenfield and Nurri Kim, Against the Smart City (The City Is Herefor You to
Use), 1.3 edition (Do projects, 2013), sec. 4; Townsend, Smart Cities, 80.
26 Joe Flood, The Fires. How a Computer Formula Burned down New York City-and
Determined the Future ofAmerican Cities (New York: Riverhead Books, 2010), 161.
27 Declan Butler, "When Google Got Flu Wrong,"Nature 494, no. 7436 (February 13, 2013): 155-56, doi:10.1038/494155a.
28 Greenfield and Kim, Against the Smart City (The City Is Herefor You to Use), sec. 4.
29 Ibid.
30 Ibid., sec. 11.
31 Michael B. Gurstein, "Open Data: Empowering the Empowered or Effective Data Use for Everyone?," First Monday 16, no. 2 (January 23, 2011), http://journals.uic.edu/ ojs/index.php/fm/article/view/3316.
32 http://index.okfn.org.
33 Crawford, "Think Again."
34 "Iceland: From the Financial Crisis to Open Data," Open Knowledge Foundation Blog, accessed December 12, 2013, http://blog.okfn.org/2010/03/26/iceland-from-the-financial-crisis-to-open-data/.
35 "Crowdsourcing Iceland's Constitution," IHTRendezvous, accessed December 12, 2013,
http://rendezvous.blogs.nytimes.com/2012/10/24/crowdsourcing-icelands-constitution/.
36 Janssen, Open Government Data. 37 http://ushahidi.com.
38 Rob Kitchin, "Four Critiques of Open Data Initiatives," Impact ofSocial Sciences,
November 27, 2013, http://blogs.lse.ac.uk/impactofsocialsciences/2013/11/27/four-critiques-of-open-data-initiatives/.
39 Gurstein, "Open Data." 40 Crawford, "Think Again."
41 Greg Brown, "Why Kenya's Open Data Portal Is Failing -And Why It Can Still Succeed," Sunlight Foundation, accessed December 7, 2013, http://sunlightfoundation. com/blog/2013/09/23/why-kenyas-open-data-portal-is-failing-and-why-it-can-still-succeed/.
42 Lev Manovich, "What Is Visualisation?," Visual Studies 26, no. 1 (March 2011): 36-49, doi:10.1080/1472586X.2011.548488.