Publisher’s version / Version de l'éditeur:
Building and Environment, 40, November 11, pp. 1479-1491, 2005-11-01
READ THESE TERMS AND CONDITIONS CAREFULLY BEFORE USING THIS WEBSITE. https://nrc-publications.canada.ca/eng/copyright
Vous avez des questions? Nous pouvons vous aider. Pour communiquer directement avec un auteur, consultez la première page de la revue dans laquelle son article a été publié afin de trouver ses coordonnées. Si vous n’arrivez pas à les repérer, communiquez avec nous à [email protected].
Questions? Contact the NRC Publications Archive team at
[email protected]. If you wish to email the authors directly, please see the first page of the publication for their contact information.
NRC Publications Archive
Archives des publications du CNRC
This publication could be one of several versions: author’s original, accepted manuscript or the publisher’s version. / La version de cette publication peut être l’une des suivantes : la version prépublication de l’auteur, la version acceptée du manuscrit ou la version de l’éditeur.
For the publisher’s version, please access the DOI link below./ Pour consulter la version de l’éditeur, utilisez le lien DOI ci-dessous.
https://doi.org/10.1016/j.buildenv.2004.11.019
Access and use of this website and the material on it are subject to the Terms and Conditions set forth at
Water entry function of a hardboard siding-clad wood stud wall
Sahal, N.; Lacasse, M. A.
https://publications-cnrc.canada.ca/fra/droits
L’accès à ce site Web et l’utilisation de son contenu sont assujettis aux conditions présentées dans le site
LISEZ CES CONDITIONS ATTENTIVEMENT AVANT D’UTILISER CE SITE WEB.
NRC Publications Record / Notice d'Archives des publications de CNRC:
https://nrc-publications.canada.ca/eng/view/object/?id=91030690-2247-4be4-ace1-5ad4b932f885 https://publications-cnrc.canada.ca/fra/voir/objet/?id=91030690-2247-4be4-ace1-5ad4b932f885http://irc.nrc-cnrc.gc.ca
W a t e r e n t r y f u n c t i o n o f a h a r d b o a r d s i d i n g
-c l a d w o o d s t u d w a l l
N R C C - 4 9 4 4 9
S a h a l , N . ; L a c a s s e , M . A .
A version of this document is published in / Une version de ce document se trouve dans: Building and Environment, v. 40, no. 11, Nov. 2005, pp. 1479-1491
Doi:10.1016/j.buildenv.2004.11.019
The material in this document is covered by the provisions of the Copyright Act, by Canadian laws, policies, regulations and international agreements. Such provisions serve to identify the information source and, in specific instances, to prohibit reproduction of materials without written permission. For more information visit http://laws.justice.gc.ca/en/showtdm/cs/C-42
Les renseignements dans ce document sont protégés par la Loi sur le droit d'auteur, par les lois, les politiques et les règlements du Canada et des accords internationaux. Ces dispositions permettent d'identifier la source de l'information et, dans certains cas, d'interdire la copie de documents sans permission écrite. Pour obtenir de plus amples renseignements : http://lois.justice.gc.ca/fr/showtdm/cs/C-42
Water entry function of a hardboard siding-clad wood stud wall
Nil Sahal1* and Michael A. Lacasse21
Assistant Professor; Istanbul Technical University, Faculty of Architecture, Taskisla, Taksim, 34437, Istanbul, Turkey
2
Ph.D., P.Eng. Senior Research Officer; Building Envelope and Structure, Institute for Research in Construction, National Research Council Canada, Montreal Road, Building M20 Ottawa, Ontario K1A 0R6 Canada
*Corresponding author Tel: +90-212-2931300-2246 Fax: +90-212-2514895
E-mail: [email protected] (N. Sahal)
Abstract
This paper presents derivation of a water entry function of a hardboard siding-clad wood stud wall assembly. Water entry function provides input data to heat, air and moisture simulation models to facilitate the prediction of the long-term water entry performance of the specific assembly. Initially, an experimental work was conducted in which the hardboard siding-clad wood stud wall specimen was subjected to simulated driving rain loads, i.e. spray rates and static pressure differential. The specimen included a drainage cavity and specific deficiencies such as a missing length of sealant at the interface between the cladding and penetrating components, i.e. window, ventilation duct and electrical outlet. Water entering the deficiencies was collected at the drainage and stud cavities just below the penetrating components. Water entry results provided information on water entry rates as functions of simulated driving rain loads, which in turn permitted the development of a water entry function of the assembly. Entry function is a basic relationship that relates the quantity of water entry in a certain location within the assembly to the simulated driving rain loads. Measured climatic data of a specific climate, i.e. rainfall intensity and wind speed, was related to the simulated driving rain loads, and the entry function provided a means of estimating the water entry loads of the hardboard siding-clad wood stud wall assembly located in the specific climate.
1. Introduction
Driving rain is one of the most significant moisture sources that may cause premature
deterioration of wood stud wall assemblies [1-4]. Driving rain deposited on the surface of the cladding may drain from the exterior surface of the cladding, be stored in the cladding by capillary absorption or penetrate further into the wall assembly [5]. As well, it may enter through the imperfectly designed, defectively installed and inadequately maintained interface details at through wall penetrations under the driving force of coincident wind pressure or gravity. Interface details at wall-window, wall-electrical outlet and wall-ventilation duct are the primary points for rainwater ingress. Water past the cladding through interface details at wall penetrations may drain and accumulate at the spaces between the cladding and the adjacent component, be stored in the adjacent component, or even transmitted into the stud space. This process may depend on several factors such as quantity of water past the cladding, type of deficiency, moisture content of the components, temperature, time and type of the assembly. Detrimental effects are saturation of sheathing board, wetting of cellulose thermal insulation material, rotting of wood studs and deterioration of gypsum board [6,7]. Hence, assessing rainwater entry into wood stud wall assembly prior to construction permits predicting the vulnerability of the components in the assembly to premature deterioration and thus estimating the long-term performance of the assembly.
Laboratory testing of full-scale test specimens for assessing water penetration performance are used to gain insights on the degree of moisture storage and rates of moisture transfer of the
components in the wall assembly. Additionally, they provide information on the quantity of water that may enter through the inadvertent deficiencies in the cladding and the location of the water
accumulation within the assembly when exposed to simulated driving rain loads, i.e. spray rates and pressure differences across the assembly. However, presenting the results of such tests to predict the long-term performance is difficult as deterioration is a time-related effect and short-term testing does not permit a means to predict such effects in a direct manner. Current heat, air and moisture (HAM) simulation models predict the long-term moisture uptake by the cladding due to the deposited driving rain on the cladding and rate of transfer through the wall components. Eventually, they identify susceptibility of the components to premature deterioration. However, they lack information to predict the quantity of water past through the deficiencies and the location of the water accumulation within the assembly when exposed to driving rain intensities and driving rain wind pressures. As for the
laboratory testing to provide useful information on the long-term water entry performance of the wall assembly, an approach is to develop basic relationships that will link the quantity of water entry in a certain location within the assembly to the simulated driving rain loads, namely water entry functions. Entry functions are essential for providing input data to HAM simulation models. Given the entry function, the model can compute the quantity of water entry at a certain location within the assembly under driving rain intensities and driving rain wind pressures. Then, it can predict whether the trapped water will eventually dry out or continue to accumulate under different climate loads. Hence, it can evaluate the potential for vulnerability of the wall assembly components to water entry.
Previously conducted experimental work [8-12] have provided substantial information on water entry rates of various claddings under simulated driving rain loads, however water entry functions were not evident. Recently, in the experimental work carried out by Brown et al [13] water entry function was obtained from the water entry testing of specimens when subjected to one level of spray rate at two levels of static pressure differences across the assembly. St- Hilaire et al [14] based their entry function on the water entry tests in which the specimen was subjected to one level of spray rate at one level of static pressure difference. More recently, in a study entitled MEWS (Moisture Management of Exterior Wall Systems) [15], water entry functions were obtained from water entry testing of full-scale wall assemblies for four cladding types, i.e. brick veneer, stucco, siding and EIFS. The test subjected specimens to two spray rates at three steps of increasing pressure differences across the assembly. The entry functions provided a basis for a systematic means of transferring water entry information to hygIRC, a mathematical hygrothermal model used in the MEWS project.
The present experimental work [16] was carried out with the intention of expanding the results obtained from the work previously carried out in the MEWS project. In this work, a wood stud wall with a hardboard siding cladding was selected from an existing stock of wall assemblies built for the MEWS project [17]. The specimen that incorporated specific deficiencies was subjected to simulated driving rain loads so as to quantitatively assess the water entry of the wall assembly. In the MEWS project, the driving rain loads were simulated by different levels of spray rate and pressure difference consistent with driving rain intensities that may occur in extreme climatic events in North America. However, in the present work, the specimen was subjected to a broadened series of simulated driving rain loads as compared to that defined in the MEWS project. The intention was to simulate a broad range of possible service conditions that might prevail across North America. It is suggested that the
results from these experiments would provide a better understanding of the water entry of the specific wall assembly from which a water entry function would be further developed and which subsequently would provide input to a HAM simulation model such as hygIRC.
2. Experimental work
The present experimental work consisted of conducting a test protocol on the hardboard siding-clad wood stud wall specimen. The test protocol was established to measure the air leakage,
pressure response and water entry of the test specimen. The tests were initiated by characterizing the air leakage of the assembly in order to determine the effect of air leakage of the wall assembly to driving pressures across the wall that may bring about water entry. Pressure response was measured at each level of air barrier system leakage to provide a measure of pressure differences across the wall assembly that in return established the driving pressures across the wall assembly. Quantifying the water entry through the specimen for different levels of air barrier system leakage provided information on water entry rates as functions of simulated driving rain loads, which eventually permitted the development of the water entry function of the assembly.
At all tests, the specimen was mounted in a steel test frame and the frame was affixed to Dynamic Wall Test Facility (DWTF). Exterior surface of the specimen faced the inside of the DWTF and interior surface was exposed to the laboratory for observation of the stud cavities during testing.
2.1. Test specimen: wood stud wall with hardboard siding cladding
The test specimen nominally measured 2.44-m by 2.44-m. The primary components of the wall assembly included hardboard lap siding, 19-mm cavity incorporating vertical pressure treated wood strapping, two layers of 30-min building paper (sheathing membrane), 12-mm glass mat gypsum board sheathing, and 38-mm by 89-mm wood studs. An acrylic sheet was placed onto the outer face of the wood studs to act as the air barrier system.
Three basic components were incorporated in the assembly, a vinyl flanged window, an electrical outlet and a ventilation duct, which is a component of ventilation system that exhausts air from kitchens, bathrooms, and supplies outside air to habitable rooms. The location of each three components is shown in Fig. 1. Each of these components penetrated the siding (1st line of defence), sheathing membrane (2nd line of defence) as well as the sheathing board, and hence was considered as a through wall penetration.
Fig 1. Location of through wall penetrations in test specimen (external elevation) [15] Deficiencies were specified as to be nominally representative of either imperfect installation or inadequate maintenance in the field. These were introduced in the 1st (siding outer surface) and 2nd (sheathing membrane outer surface) lines of defence. The intent was to provide water entry points in the wall assembly. The deficiency in the first line of defence was a missing length of sealant bead at each of the interfaces with the through wall penetrations, i.e. wall-electrical outlet, wall-ventilation duct and wall-window interface. At the wall-electrical outlet and wall- ventilation duct interfaces, a 50-mm of sealant length was missing between the top of the cover plate and the cladding, as shown in Figs 2 and 3, respectively. At the wall-window interface, which a sectional view is illustrated in Fig. 4, a 90-mm length of sealant was missing at the bottom centre of the windowsill, along one edge of the sill and at the bottom of the adjacent jamb.
Missing 50 mm of sealant length at top of cover plate
6 mm gap between building paper and edge of glass mat gypsum sheathing Exterior duplex electrical
outlet box
50 mm x 75 mm x 75 mm
Acrylic sheet acting as air barrier Hardboard lap siding
Nominal horizontal wood nailer 38 mm X 89 mm (2" X 4")
12 mm gap between sheathing and outlet box sealed with backer rod and sealant 3 mm gap between hardboard and outlet box 2 layers 30-minute building paper 19 mm x 38 mm vertical PT wood strapping, at 400 mm o.c. (over wood studs), 19 mm cavity
Openings in acrylic sheet simulate leakage of air barrier system 3 mm x 50 mm missing sealant at bottom of outlet box Filet bead of sealant
around perimeter of opening
Missing 50 mm of sealant length at top of cover plate
Acrylic sheet acting as air barrier
Hardboard lap siding
12 mm gap between edge of sheathing and perimeter of duct filled with backer rod and sealant
150 mm diameter ventilation duct Opening of duct closed
with a sheet of acrylic sealed at perimeter
6 mm gap between building paper and edge of sheathing board
3 mm gap between edge of hardboard and perimeter of duct
2 layers 30-minute building paper
19 mm x 38 mm P.T. wood strapping (lined up with studs)
Openings in acrylic sheet simulate leakage of air barrier system 3 mm x 50 mm missing sealant at bottom of duct
Glass mat gypsum board sheathing, 12 mm
Hardboard siding (not back primed)
2 layers 30-min building paper
Rough head protection membrane (225 mm high, extended
300 mm past opening) Nailing flange (not nailed at head)
Rough sill protection membrane (225 mm high, extended 400 mm past opening)
Drip flashing extending 25 mm past the opening (supplied by siding manufacturer)
19 mm x 38 mm @ 400 mm o.c. vertical PT wood strapping, 19 mm cavity
Acrylic sheet acting as air barrier
Acrylic sheet taped to window frame
2 layers 30-min
building paper Openings in acrylic
sheet simulate leakage of air barrier system Reverse lap between
rough sill protection and WRB 6 mm gap between window flange and WRB 90 mm of sealant length missing in center of sill, at one edge of sill, and at bottom of adjacent jamb
Glass mat gypsum board sheathing, 12 mm
J-track 10 mm
Sealant and backer rod
at jambs and sill Water collection gutter
At the second line of defence, the deficiencies introduced in the wall-electrical duct interface were a 6-mm gap between the edge of the sheathing board and the sheathing membrane, and a 50-mm of missing sealant length between the sheathing board and the bottom of the duct. The wall-vent duct incorporated the same kind of deficiencies as the wall-vent duct at the second line of defence. At the wall-window interface, a 6-mm gap between the window flange and the sheathing membrane was incorporated into the assembly. As well, a reverse lap between the rough sill protection and the sheathing membrane was introduced on the sheathing board.
A series of troughs, which were located in the 19-mm cavity, permitted collecting water that entered through the deficiencies in the cladding (1st line of defence). Troughs that were located in the stud cavity served likewise, i.e. collected water that entered through the deficiencies in the 1st and 2nd line of defence and deposited in the stud space behind the sheathing board (beyond 2nd line of defence).
Locations of each trough are illustrated in Fig 5. Troughs D, V, and TW were located in the 19-mm cavity, beneath the respective penetrations, i.e. electrical outlet (D), vent duct (V) and window (TW). Deflectors were placed above each component in the 19-mm cavity in order to prevent any unintentional water entry from above portion of the wall cavity to dilute the entry results in the troughs. As well, troughs T1 to T5 were located at the base of the wall in the cavity behind the cladding. Troughs T1 to T5 collected water that might penetrate the cladding and be deposited in the cavity. These troughs were limited nominally to the breath of a stud space. Additionally, three troughs were situated in the stud cavity beneath the electrical outlet (E), vent duct (L) and window (W).
Pressure taps were located in six parts of the wall assembly as shown in Fig 5. In each part, pressure taps were located in the 19-mm cavity between the siding and the sheathing board, and in the stud cavity. Certain pressure taps were specifically located in proximity to the deficiencies to obtain the pressure differences that may affect the likelihood of water entry past the cladding and the sheathing board.
An acrylic board situated on the outer surface of the wood studs served as the air barrier system. As illustrated in Figs 2 to 4, a series of three 6-mm diameter holes were introduced in the acrylic board about the centre of each of the stud space. Opening or closing the appropriate number of holes in the air barrier system could regulate the nominal rate of air leakage through the assembly.
L
E
CH9 CH6V
D
CH8 CH5T5
T4
T3
T2
T1
TW
CH17 CH14W
CH16 CH13Fig 5. Location of water collection troughs and pressure taps [15]
2.2. Test protocol: water entry assessment of wall specimen
Test protocol was established to measure air leakage, pressure response and water entry of the specimen when subjected to simulated driving rain loads, i.e. spray rates and static pressure
differences using the DWTF.
The air barrier system leakage (ABSL) of the specimen was obtained by measuring the air leakage through the specimen at 75 Pa pressure difference for a series of leakage areas (LA), which were obtained by opening or closing the appropriate number of holes in the air barrier system. The air leakage, calculated at 75 Pa, was obtained for each of the different nominal LAs, which were (a) when the specimen air leakage was minimized, i.e. airtight system-all the openings in the air barrier system were closed, (b) the specimen provided a nominal air leakage less than 0.6 L/s-m2 (c) the specimen was at the least airtight mode, i.e. leakiest system-all the openings in the air barrier system were open. The pressure response of the test specimen at different nominal levels of ABSL was measured under static pressure differences of 40, 75, 150, 300 and 600 Pa by using differential pressure transducers for a period of 10 minutes. The expected output was values of driving pressure across the cladding and the stud cavity under static pressure differences for different levels of ABSL.
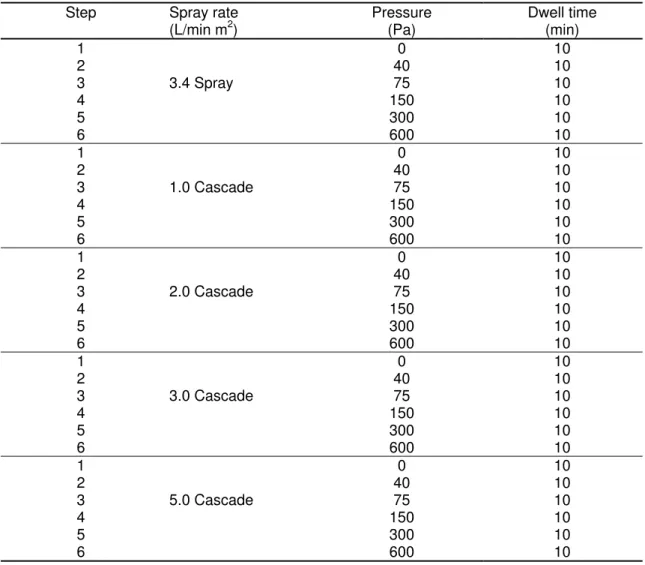
The water entry of the test specimen was measured by subjecting the test specimen to varying spray rates, static different pressure differences at selected levels of ABSL. Table 1 provides the steps of the test conducted on the airtight specimen. The same test series was repeated for the nominal ABSL requirement and the greatest ABSL. One of the expected outputs of the water entry test was to determine the pressure drops at each pressure tap locations for the given static pressure differences and level of ABSL. And the other was to quantify the water entry through the deficiencies at the cladding and sheathing board as a function of spray rates, static pressure differences and levels of ABSL.
Table 1 Series of spray rates at increasing pressure steps and dwell times for water entry testing
Step Spray rate
(L/min m2) Pressure (Pa) Dwell time (min) 1 0 10 2 40 10 3 75 10 4 150 10 5 300 10 6 3.4 Spray 600 10 1 0 10 2 40 10 3 75 10 4 150 10 5 300 10 6 1.0 Cascade 600 10 1 0 10 2 40 10 3 75 10 4 150 10 5 300 10 6 2.0 Cascade 600 10 1 0 10 2 40 10 3 75 10 4 150 10 5 300 10 6 3.0 Cascade 600 10 1 0 10 2 40 10 3 75 10 4 150 10 5 300 10 6 5.0 Cascade 600 10
3. Experimental results 3.1. Air leakage characterization
Air leakage of the test specimen at 75 Pa pressure difference was measured for various LAs. An ABSL of 0.3 L/s-m2 was achieved when all the holes in the air barrier system were closed. A series of seven (one in each stud cavity) nominally 6-mm diameter holes represented a LA of 169-mm2 and provided a nominal ABSL of 0.4 L/s-m2 at a pressure difference of 75 Pa. An ABSL of 0.6 L/s-m2 (LA 508- mm2) was achieved when all the holes at the air barrier system were open.
3.2. Pressure response characterization
When the ABSL of the specimen was either 0.3, 0,4 or 0,6 L/s-m2, the pressure drop at each pressure tap locations, which are given in Fig. 5, was measured for each given static pressure differences. Pressure drop is simply the difference between the static pressure difference across the specimen and the actual pressure at that specific tap location, namely the driving pressure. The driving pressure is the amount of pressure to drive water through an opening. Hence, the driving pressure ratio is the ratio of driving pressure across the cavity in relation to static pressure difference across the specimen. The higher this value, the greater driving pressure across the opening.
Pressure taps of interest across the width of the wall at the electrical outlet were CH5 and CH6, which were located at proximity to water collection troughs D and E, as given in Fig. 5. When the assembly provided an ABSL of 0.3 L/s·m2, the driving pressure ratio within the drainage cavity and stud cavity ranged from 0.0 to 0.1 for the given pressure range. Similar results were obtained when the ABSL was 0.4 and 0.6 L/s·m2. The results indicated that the acrylic sheet provided the greatest resistance to air pressure throughout the test.
The pressure tap locations considered across the width of the wall at the vent duct were CH8 and CH9, which were located at the drainage cavity and stud cavity, respectively. The driving pressure ratio in both cavities and each pressure step ranged from 0.0 to 0.1 when the ABSL was 0.3 L/s-m2. This result was essentially same for the remaining ABSL, i.e. 0.4 and 0.6 L/s·m2. The results implied that pressure moderation occurred in the drainage cavity, which in turn decreased the driving pressures across the cladding.
The pressure tap locations considered across the width of the wall at the window were CH13, CH14, CH16 and CH17. CH13 and CH16 were located immediately beneath the wall-window interface deficiency at the right and left drainage cavities when facing the inside of the wall,
respectively. CH14 and CH17 were situated at the right and left stud cavities when facing the inside of the wall, respectively. When the ABSL was 0.3 L/s·m2, the driving pressure ratio at the drainage cavity (CH13 and CH16) for each pressure step ranged from 0.0 to 0.1. However, when the specimen was evaluated with an ABSL of 0.4 L/s·m2, the driving pressure ratio at the drainage cavity increased, i.e. the ratio varied between 0.35 to 0.45 for the given range of pressures. When the ABSL increased to 0.6 L/s·m2, the ratio likewise increased and ranged from 0.45 to 0.50 for the same range of pressures.
The driving pressure ratio in the stud cavity for each pressure step increased with increasing ABSL. The driving pressure ratios were approximately 0.1 for each pressure steps when the ABSL was 0.3 L/s·m2, and the ratios varied between 0.65 to 0.95 and 0.85 to 0.98, when the ABSL was 0.4 and 0.6 L/s·m2, respectively. The results implied that when the specimen ABSL increases, the proportion of pressure available to drive water through the openings likewise increases. This further suggests that there is greater likelihood of water entry through the specific deficiency at the given assembly having an ABSL of 0.6 L/s·m2 as compared to 0.4 and 0.3 L/s·m2.
3.3. Water entry assessment
When water was sprayed on the cladding at the given rates and the pressure differences across the specimen were maintained at the given values, the water deposited on the hardboard cladding and stood on the deficiency at the electrical outlet and entered through the missing 50-mm of sealant length at the top of the electrical outlet into the drainage cavity. It was collected at trough D, which is located beneath the electrical outlet, for the duration of the tests. Water that found its way through the deficiency located above the electrical outlet, in some tests also worked its way along the outlet length to the underside of the outlet into the deficiency between the outlet and the sheathing board. This water was collected at trough E, which is located at the stud cavity, and its entry into the stud cavity was also observed. No water was collected at trough T1, which is located at the base of the wall directly below the electrical outlet.
Water entry rates in trough D at a given pressure level as a function of spray rates for each degree of air barrier system leakage is given in Fig 6a, b and c. A comparison of the range of values of entry rates in relation to changes in spray rates at a given pressure step to the range of values of entry rates in relation to changes in pressure levels at a given spray rate suggest that water entry rates are primarily dependent on the spray rate and not to the pressure difference across the assembly.
(a) 0,00 0,02 0,04 0,06 0,08 0,10 0,12 0,14 0,16 0,18 0,20 0,22 0,24 0,26 0,28 0,30 0 40 75 150 300 600
Static pressure difference (Pa)
W a ter en tr y r at e ( L /m in
) Spray rate (L/min m 3,4 1,0 2,0 3,0 5,0
2) (b) 0,00 0,02 0,04 0,06 0,08 0,10 0,12 0,14 0,16 0,18 0,20 0,22 0,24 0,26 0,28 0,30 0 40 75 150 300 600
Static pressure difference (Pa)
Wate r e n tr y r a te (L /m in
) Spray rate (L/min m 3,4 1,0 2,0 3,0 5,0
2) (c) 0,00 0,02 0,04 0,06 0,08 0,10 0,12 0,14 0,16 0,18 0,20 0,22 0,24 0,26 0,28 0,30 0 40 75 150 300 600
Static pressure difference (Pa)
Wa ter en tr y r a te (L /m in
) Spray rate (L/min m 3,4 1,0 2,0 3,0 5,0
2)
Fig. 6. Water entry rates through the deficiency above the electrical outlet that was collected at trough D, (a) ABSL 0.3 L/s m2, (b) ABSL 0.4 L/s m2, (c) ABSL 0.6 L/s m2
Water entering the deficiency above the ventilation duct was collected at troughs V and T2, and some instances at trough L. Small amounts of water were collected intermittently at trough V.
Water entry rates in trough T2 at a given pressure level as a function of spray rates when the assembly provided an ABSL of 3.0 L/s·m2 is given in Fig 7a. Increases in spray rate tended to slightly increase the water entry rate in this trough at each given pressure level. However, the increase in the entry rates was evident for spray rates of 3.0 and 5.0 L/min·m2 at pressure difference of 600 Pa.
Water entry rates for the ABSL of 4.0 and 0,6 L/s·m2 are provided in Fig 7b and c, respectively. Similar results were obtained at each ABSL. The water entry rates at spray rates 3.0 and 0.5 L/min·m2 and static pressure difference of 600 Pa increased at each increasing air barrier system leakage. Hence, the increase in the water entry rate was due to the increase in driving pressures across the cladding at static pressure difference of 600 Pa.
(a) 0,00 0,05 0,10 0,15 0,20 0,25 0,30 0,35 0,40 0,45 0,50 0,55 0,60 0 40 75 150 300 600
Static pressure difference (Pa)
Wa ter en tr y r a te (L /m in
) Spray rate (L/min m2) 3,4 1,0 2,0 3,0 5,0
(b) 0,00 0,05 0,10 0,15 0,20 0,25 0,30 0,35 0,40 0,45 0,50 0,55 0,60 0 40 75 150 300 600
Static pressure difference (Pa)
Wa ter en tr y r a te (L /m in
) Spray rate (L/min m2) 3,4 1,0 2,0 3,0 5,0
0,00 0,05 0,10 0,15 0,20 0,25 0,30 0,35 0,40 0,45 0,50 0,55 0,60 0 40 75 150 300 600
Static pressure difference (Pa)
Wa ter en tr y r a te (L /m in
) Spray rate (L/min m2) 3,4 1,0 2,0 3,0 5,0 (c)
Fig. 7. Water entry rates through the deficiency above the vent duct that was collected at trough T2, (a) ABSL 0.3 L/s m2, (b) ABSL 0.4 L/s m2, (c) ABSL 0.6 L/s m2
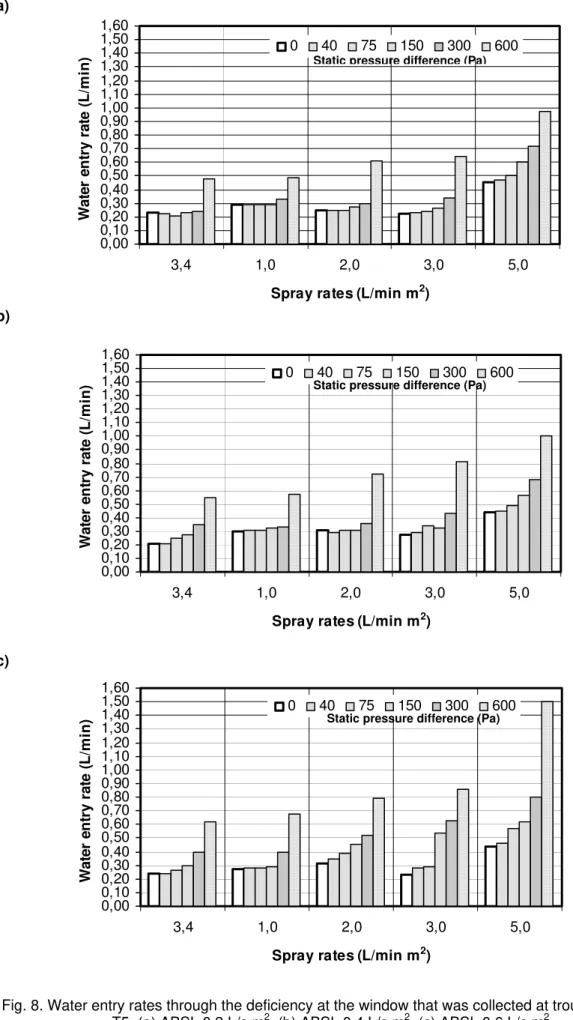
Water deposited on the cladding found its way through the deficiency beneath the window-wall interface and it was collected at troughs TW and T5. No water was collected at trough W.
Fig. 8a illustrates the entry rates as a function of pressure differences across the specimen at given levels of spray rate when the assembly provided an ABSL of 3.0 L/s·m2. At the spray rates of 3.4, 1.0, 2.0 and 3.0 L/min·m2, the pressure applied on the cladding was increased at steps from 40 Pa to 300 Pa and the water entry rate tended to slightly increase at each pressure step. However, at the given spray rates of 3.4, 1.0, 2.0 and 3.0 L/min·m2, water entry rates increased significantly at the pressure difference of 600 Pa. Increases in rates of water entry in relation to corresponding increases in pressure difference across the assembly were evident at the spray rate of 5.0 L/min·m2.
Fig. 8b and c demonstrate that the same pattern had occurred when the system provided an ABSL of 4.0 and 0,6 L/s·m2, respectively. At the spray rate of 5.0 L/min·m2, the water entry rates ranged from 0.44 to 1.0 L/min with corresponding pressure differences of 0 Pa to 600 Pa at when the assembly provided an ABSL of 0.4 L/s·m2. The water entry rates ranged from 0.44 to 1.5 L/min with corresponding pressure differences of 0 Pa to 600 Pa, when the assembly provided an ABSL of 0.6 L/s·m2. Hence, increase in the air barrier system leakage resulted an increase in the water entry rates.
One of the key findings obtained at all water entry tests was that water entry through the deficiency at the electrical outlet, vent duct and window occurred even when there was no pressure difference across the specimen, i.e. there was no driving pressure across the cladding. Hence, water leakage through the deficiency was attributed to gravity. At the electrical outlet, an average entry rate of 0.06 L/min accumulated at trough D at a spray rate of 3.4 L/min·m2 and an average entry rate of 0.20 L/min accumulated at the same trough at a spray rate of 5 L/min·m2, as given in Fig 5a,b and c. At the vent duct, the average values of entry for the spray rates of 3.4 and 5 L/min m2 were 0.11 and 0.20 L/min, respectively. Figs 6a,b and c demonstrate that the average minimum entry rate of 0.23 L/min was attained at the spray rate of 3.4 L/min·m2 and the average maximum rate of entry of 0.44 L/min was attained at a cascading rate of 5 L/min·m2. The results indicated that water ingress through the deficiency occurred as long as water was present at the vicinity of the deficiency and increase in the entry rate was dependent on the increase of the spray rate.
(a) 0,00 0,10 0,20 0,30 0,40 0,50 0,60 0,70 0,80 0,90 1,00 1,10 1,20 1,30 1,40 1,50 1,60 3,4 1,0 2,0 3,0 5,0
Spray rates (L/min m2)
Wa ter en tr y r a te (L /m in
) 0 Static pressure difference (Pa)40 75 150 300 600
(b) 0,00 0,10 0,20 0,30 0,40 0,50 0,60 0,70 0,80 0,90 1,00 1,10 1,20 1,30 1,40 1,50 1,60 3,4 1,0 2,0 3,0 5,0
Spray rates (L/min m2)
W a te r e n tr y r a te (L /m in
) 0 Static pressure difference (Pa) 40 75 150 300 600
(c) 0,00 0,10 0,20 0,30 0,40 0,50 0,60 0,70 0,80 0,90 1,00 1,10 1,20 1,30 1,40 1,50 1,60 3,4 1,0 2,0 3,0 5,0
Spray rates (L/min m2)
Wa ter en tr y r a te (L /m in
) 0 40Static pressure difference (Pa) 75 150 300 600
Fig. 8. Water entry rates through the deficiency at the window that was collected at troughs TW and T5, (a) ABSL 0.3 L/s m2, (b) ABSL 0.4 L/s m2, (c) ABSL 0.6 L/s m2
Figs 6 to 8 demonstrate that cascading water rates on the cladding surface resulted in higher rates of water entry than compared to spraying water on the cladding surface. For example in Fig. 6a, the rate of water entry obtained was 0.05 L/min, when a rate of 3.4 L/min·m2 was sprayed on the surface of the cladding and the pressure difference across the wall assembly was maintained at 40 Pa. At the same pressure step, water entry rates obtained were 0.07, 0.10, 0.13, and 0.21 L/min when the corresponding rates of 1.0, 2.0, 3.0 and 5 L/min·m2 cascaded on the surface of the cladding.
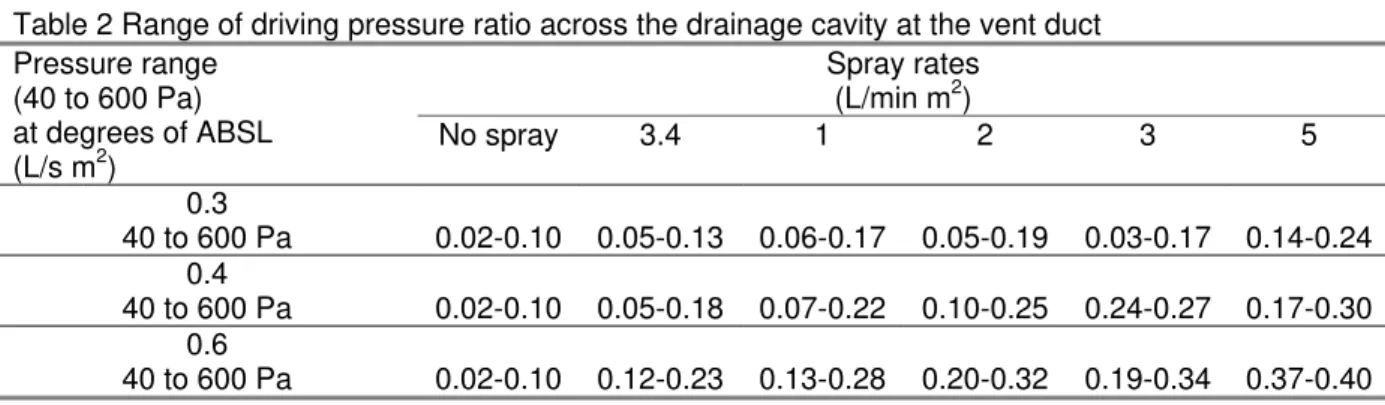
Another finding was that the presence of the water film at the surface of the cladding, in particular at the vicinity of the deficiency acted as a barrier, which reduced the airflow through the deficiency, thus reduced the cavity pressure and increased the driving pressure across the cladding. The driving pressure was further increased when the amount of water deposition, i.e. thickness of the surface film, increased on the cladding surface. Table 2 gives the range of driving pressure ratio across the drainage cavity at the vent duct for the range of static pressure differences across the assembly in relation to spray rates at each degree of air barrier system leakage. The pressure response testing (§ 3.2) have demonstrated that driving pressure ratio at the same cavity had ranged from 0.0 to 0.1 for the given pressure range at each degree of ABSL, when no water was applied on the cladding surface. However, the driving pressure ratio in the drainage cavity increased with increasing spray rates for the given pressure range at each degree of ABSL. In addition, the driving pressure ratios for the given pressure range at each spray rate increased with increasing ABSL. Table 2 Range of driving pressure ratio across the drainage cavity at the vent duct
Spray rates (L/min m2) Pressure range (40 to 600 Pa) at degrees of ABSL (L/s m2) No spray 3.4 1 2 3 5 0.3 40 to 600 Pa 0.02-0.10 0.05-0.13 0.06-0.17 0.05-0.19 0.03-0.17 0.14-0.24 0.4 40 to 600 Pa 0.02-0.10 0.05-0.18 0.07-0.22 0.10-0.25 0.24-0.27 0.17-0.30 0.6 40 to 600 Pa 0.02-0.10 0.12-0.23 0.13-0.28 0.20-0.32 0.19-0.34 0.37-0.40
3.4. Water entry function
3.4.1 Derivation of a water entry function
Water entry data indicated that water entering the deficiency at the electrical outlet-wall interface was mostly collected at trough D in the drainage cavity. Water was collected intermittently at trough E in the stud cavity. Water past the deficiency at window-wall interface was collected at troughs TW and
T5 in the drainage cavity at all tests. However, water entering the deficiency at the vent duct-wall interface found its way through the deficiency at the vent duct-sheathing board interface and it was collected at trough L located in the stud cavity. Water entering the stud cavity was significant in terms of long term of performance of the wall assembly. Hence, water entry rates, based on water collected in trough L was used to derive a water entry function for this specific wall when the ABSL was 0.6 L/s m2. Accordingly, Fig. 9 depicts the water entry rates through the deficiency at the wall-ventilation duct interface as a function of spray rate for different pressure levels. The lines represent the water entry functions obtained for the siding-clad wall assembly at six static pressure differences. Equations derived from the linear functions were fitted to the data points and regression coefficients are also provided as a measure of the reliability of the functions. The linear function is plotted such that the line passess through the origin,i.e. no water entry occurs if water is not sprayed to the wall.
The linear function that relates the water entry rate Q (L/min) and spray rate (L/min·m2) for each static pressure difference (ΔP, Pa) is expressed as the following [15].
Q = mp x Rp (1)
in which Q is the water entry rate (L/min), Rp is the spray rate (L/min·m 2
) and mp is the water entry
potential (L min-1/L min-1 m-2) for which subscript p refers to the given static pressure difference across the assembly. Q(600)= 0,0247x R2 = 0,9412 Q (300) = 0,0224x R2 = 0,9853 Q (150)= 0,0185x R2 = 0,9412 Q(75)= 0,0162x R2 = 0,9935 Q(40)= 0,0138x R2 = 0,9935 Q(0)= 0,0124x R2 = 0,9412 0,00 0,02 0,04 0,06 0,08 0,10 0,12 0,14 0,0 1,0 2,0 3,0 4,0 5,0 6,0
Spray rates (L/min m2)
Water entry rate (L/min)
600 Pa 150 Pa 300 Pa 40 Pa 0 Pa 75 Pa
Given that the slopes of the different water entry functions, as represented by the water entry potential, increase with corresponding increases in pressure differences, it is assumed that the water entry function is a function of the static pressure difference.
mp = f (static pressure difference, ΔP, Pa) (2)
Thus, the water entry potential, mp, can be plotted, as a function of static pressure difference,
and as shown in Fig. 10, an empirical relation has been derived based on a third order quadratic equation. The water entry potential (mp) derived for the ventilation duct of the hardboard siding-clad
wall, in relation to the static pressure difference is the following. mp = 3 E
-11
(ΔP)3 – 8 E-7 (ΔP)2 + 5 E-5 (ΔP) + 0.0123 (2)
Values of water entry potential range from 0.0124 to 0.0247 L min-1/L min-1 m-2 in relation to corresponding static pressure differences of 0 to 600 Pa. The reliability of the function is R2 = 0.9967, indicating a strong fit of data to the curve.
mp (P) = 3E-11x 3 - 7E-08x2 + 5E-05x + 0,0123 R2 = 0,9967 0 0,005 0,01 0,015 0,02 0,025 0,03 0 100 200 300 400 500 600 700
Static pressure difference (Pa)
W
a
ter entry potential, m
p
Fig. 10. Water entry potential as a function of static pressure difference
Based on the given relations, a step-by-step application of the water entry function can be developed to estimate the hourly amount of water entry into the stud cavity of the hardboard siding wall given hourly horizontal rainfall intensity and coincident wind speed for a specific location. Application of the method follows.
3.4.2 Estimating water entry
The method is developed in four steps, which is described below, and was used to estimate water entry through specific deficiencies of particular components of different wall assemblies in the MEWS project [15, 18].
Step 1. Hourly horizontal rainfall intensity and the coincident wind speed are extracted from the hourly weather data and converted to the amount of water deposited on the cladding, i.e. spray rate. For the purpose, Straube method [19] is used in the present exercise. This method relates the driving rain load to rainfall intensity and other climatic attributes according to the following relation:
WDR = RAF × DRF(rh) × cos (θ) × V(h) × rh (3)
where WDR is the wind driven load (L/m2 h), RAF is the rain admittance factor, DRF(rh) is the driving
rain factor, rh is the horizontal rainfall intensity (mm/m2 h), θ is the angle of the wind to the wall normal
and V(h) is the wind speed at the height of interest (m/s).
RAF is a linear factor, which transforms airfield driving rain to deposited rain on the building. RAF is estimated to be at a range of 0.3 to 1.0, which changes according to the geometry of the building. For the most severe conditions, Straube [19] proposes a value of 0.9 for the RAF.
The driving rain factor (DRF) is the proportionality constant relating rain on a vertical plane to rain on horizontal plane and is calculated from the following equation.
t h V 1 = ) DRF(r (4)
where DRF(rh) is the driving rain factor, Vt is the terminal velocity of raindrops (m/s).
The terminal velocity of the raindrops can be predicted from laboratory studies and Doppler radar measurements. Equation given below (5) and developed by Dingle and Lee [20] is accurate to ±2.5%:
Vt(Φ) = -0.16603 + 4.91884 x Φ - 0.888016 x Φ2 + 0.054888 x Φ3 (5)
where Vt(Φ) is the terminal velocity of a raindrop diameter Φ in still air (m/sec).
The cumulative probability distribution of raindrop diameter as a function of rainfall intensity given by Best [21].
( )
⎪⎭
⎪
⎬
⎫
⎪⎩
⎪
⎨
⎧
⎟
⎠
⎞
⎜
⎝
⎛
× − − = Φ 2.245 0.232 rh 1.30 Φ exp 1 F (6)where F(Φ) is the cumulative probability distribution of raindrop sizes for rh (mm/m2 h) and Φ is the
equivalent spherical raindrop diameter (mm).
Other straightforward procedures [18] to determine distribution of raindrop sizes for the rainfall intensity are to calculate either the median or the predominant drop size of the rainfall intensity. D50 is
the value of a drop diameter such that 50 percent of the water in the atmosphere is comprised of drops with a diameter less than D50. Dpred is the predominant drop diameter, which is the diameter of drops
that accounts for the greatest volume of water in the air. The following equations are given for D50 and
Dpred, respectively. n 1 0.69 a D50= × (7)
( )
n 1 n 1 n a Dpred⎟
⎠
⎞
⎜
⎝
⎛
− × = (8) where a = 1.30rhp, p = 0.232 and n = 2.25.Step 2. The coincident hourly wind speed is converted to wind pressure (Pa), i.e. static pressure difference across the wall assembly by the following equation.
Wind pressure = ½ ρ ν2 Cp (9)
where ρ is the density of air (kg/m3), v is the wind speed (m/s) and Cp is the pressure coefficient.
Step 3. The value derived from Step 2 for the average hourly wind pressure difference (ΔP) is substituted into the following equation and the resulting water entry potential (mp) is calculated.
mp = 3 E
-11 (ΔP)3
- 8 E-7 (ΔP)2+5 E-5 (ΔP) + 0.0123 (2)
Step 4. The following equation gives the hourly water entry load (Q, L/min) into the stud cavity, as the product of water entry potential (mp) and the spray rate (Rp).
3.4.3 An example – estimating water entry for a Wilmington Wet year
An example of the application of the step-by-step process to estimate the amount of water entry into the stud cavity follows. The estimate is based a given hour for a Wilmington, SC, climate (Wet year) and for a specific deficiency located in cladding of the hardboard siding wall.
In the initial step (1) hourly climate data for the given location and specific year are obtained from local weather files. A specific hour of data is selected that provides a wind velocity of 26 km/h and a coincident rainfall rate of 11 mm/h. Given these values, the median drop size of the rainfall intensity (D50) is calculated as 1.92-mm. The terminal velocity of the raindrops is calculated as 6.40
m/s, which gives the driving rain factor (DRF) of 0.156 s/m. Assuming a RAF value as 0.9, the amount of water deposited on the cladding (WDR, wind driven rain) is estimated as 11.17 L/min. This value is equivalent to a spray rate of 0.186 L/min-m2.
Step 2 gives the wind pressure due to the coincident wind speed of 26 km/h, as 33 Pa when the pressure coefficient (Cp) is assumed to be 1.
At Step 3, the water entry potential (mp) is estimated to be 0.013 L min -1
/L min-1 m-2 for the pressure of 33 Pa.
When this value combined with a spray rate of 0.186 L/min-m2, the entry, Q (L/min.) is estimated to be 0.00242 L/min or 145 L/h.
It shall be noted that the static pressure differences can be converted to wind speed and spray rates to horizontal rainfall intensity, i.e. measured climatic data can be related to test parameters as well [22].
The step-by-step process provides a systematic means of estimating water entry loads based on experimental results on a real wall assembly and readily available climate information.
4. Conclusions
Water entry function permitted estimating the quantity of water entering the stud cavity through a specific deficiency in relation to static pressure differences across the assembly and spray rates. The static pressure differences were related to wind speed and spray rates to horizontal rainfall intensity. Thus, given the climatic conditions, such as horizontal rainfall intensities and wind speeds, in a specific location, static pressure differences across the wall assembly and spray rates were calculated and using both these data in the function, the quantity of water entry through the specific deficiency into the stud cavity was estimated for the specific wall located in the specific climate.
The present experimental work was conducted on a hardboard siding-clad wood stud wall specimen. The specimen incorporated specific deficiencies at through wall penetrations, which provided a water leakage path into the stud cavity. Stud cavity, where moisture sensitive materials are present, was considered as critical region of focus of the wall in terms of water entry. When other types of wall constructions are considered, large-scale wall specimens with a specific deficiency at through wall penetrations providing a path to the critical region of focus of the wall assembly can be subjected to static pressure differences (simulating wind speed) and spray rates (simulating rain) in order to measure the quantity of water entry through the deficiencies into the region of focus of the wall assembly.
The water entry function of the specific wall assembly was derived from the experimental work, in which the specimen was exposed to static pressure differences across the assembly. In a further study, the water entry function may be derived from experimental work in which the specimen may be exposed to dynamic pressure.
Acknowledgement
Dr. Sahal gratefully acknowledges to the Istanbul Technical University, as well as the Institute for Research in Construction for having supported her work term at the National Research Council Canada.
References
[1] Killip IR, Cheetham DW. The prevention of rain penetration through external walls and joints by means of pressure equalization. Building and Environment 1984; 19(2): 81-91.
[2] Building Envelope Engineering Inc. Wall moisture problems in Alberta dwellings. Canada Mortgage and Housing Corporation; 1999.
[3] Canada Mortgage and Housing Corporation. Comparative analysis of residential construction in Seattle, Washington and Vancouver British Columbia. Building Envelope Research Consortium and Canada Mortgage and Housing Corporation; 1999.
[4] Carll C. Rainwater intrusion in light-frame building walls. 2nd Annual Conference on Durability and Disaster Mitigation in Wood-Frame Housing, Forest Products Society, Madison, WI, USA, 2001, p. 33-40.
[5] Straube J, Burnett FP. Rain control and design strategies. Journal of Thermal Envelope and Building Science 1999; 23: 41-56.
[6] Scott DL. Rain leakage in wood frame walls: two case histories. Building Research Note 210, Division of Building Research, National Research Council Canada; 1984, (BRN-210).
[7] Morrison Hershfield Limited. Survey of building envelope failures in the coastal climate of British Columbia. Canada Mortgage and Housing Corporation; 1996.
[8] Ritchie T, Plewes WG. Preliminary tests of the rain resistance of brickwork panels. Internal Report, No. 108, Division of Building Research, National Research Council Canada; 1956, (DBR-RP-108). [9] Ritchie T. Plewes WG. Moisture penetration of brick masonry panels. Research paper no. 118,
Division of Building Research, National Research Council Canada; 1961, (DBR-RP-118). [10] Roberts JJ. Rain penetration problems with concrete block work. Chemistry and Industry 1980;
194-197.
[11] Newman AJ, Whiteside D. Water and air penetration through brick walls-a theoretical and experimental study. Transactions Journal of the British Ceramics Society 1981; 80: 17-26. [12] Rathbone AJ. Rain and air penetration performance of concrete blockwork. Technical Report 553,
Cement and Concrete Association; 1982.
[13] Brown W, Ullett J, Karagiozis A, Tonyan T. Barrier EIFS clad walls: results from a moisture engineering study. Journal of Thermal Envelope and Building Science 1997; 20: 206-227.
[14] St-Hilaire AT, Derome D, Fazio P. Approach for the simulation of wetting due to rain infiltration for building envelope testing, Proceedings of the Ninth Canadian Conference on Building Science and Technology, National Building Envelope Council (NBEC) Canada, Vancouver, British Columbia Canada; 2003, p. 459-474.
[15] Lacasse MA, O’Connor TJ, Nunes S, Beaulieu P. Report from Task 6 of MEWS Project
Experimental assessment of water penetration and entry into wood-frame wall specimens, Final Report. Research report 133, Institute for Research in Construction, National Research Council Canada, 133; 2003, (IRC-RR-133).
[16] Sahal AN, Lacasse MA. Experimental assessment of water penetration and entry into siding-clad wall specimen. Internal Report, Institute for Research in Construction, National Research Council Canada, 862; 2004, (IRC-IR-862).
[17] Bomberg MT, Rousseau MZ, Desmarais G, Nicholls M, Lacasse MA. Report from Task 2 of MEWS Project-Description of 17 large-scale wall specimens built for water entry investigation in
IRC Dynamic Wall Testing Facility. Research Report 111, Institute for Research in Construction, National Research Council Canada; 2002, (IRC-RR-111).
[18] Cornick S, Dalgliesh A, Said N, Djebbar R, Tariku F, Kumaran MK. Report from Task 4 of MEWS Project-Task 4 Environmental conditions Final Report. Research Report 113, Institute for
Research in Construction, National Research Council Canada; 2002, (IRC-RR-113).
[19] Straube JF, Burnett EFP. Simplified prediction of driving rain on buildings. Proceedings of the International Building Physics Conference, Eindhoven University of Technology, Eindhoven, the Netherlands; 2000, p. 375-382.
[20] Dingle AN, Lee Y. Terminal fall speeds of raindrops. Journal of Applied Meteorology; 1972, 11: 877-879.
[21] Best AC. The size distribution of raindrops. Quarterly Journal of the Royal Meteorological Society; 1950,76: 16-36.
[22] Sahal AN, Lacasse MA. Water penetration of wall cladding-overview of climatic parameters, related test standards, and test and research facilities. Internal Report, Institute for Research in Construction, National Research Council Canada, 863; 2004, (IRC-IR-863).
Figure Captions
Fig 1. Location of through wall penetrations in test specimen (external elevation) [15] Fig 2. Wall-electrical outlet interface – vertical section [17]
Fig 3. Wall-ventilation outlet interface – vertical section [17] Fig 4. Wall-window interface – vertical section [17]
Fig 5. Location of water collection troughs and pressure taps [15]
Fig. 6. Water entry rates through the deficiency above the electrical outlet that was collected at trough D, (a) ABSL 0.3 L/s m2, (b) ABSL 0.4 L/s m2, (c) ABSL 0.6 L/s m2
Fig. 7. Water entry rates through the deficiency above the vent duct that was collected at trough T2, (a) ABSL 0.3 L/s m2, (b) ABSL 0.4 L/s m2, (c) ABSL 0.6 L/s m2
Fig. 8. Water entry rates through the deficiency at the window that was collected at troughs TW and T5, (a) ABSL 0.3 L/s m2, (b) ABSL 0.4 L/s m2, (c) ABSL 0.6 L/s m2
Fig. 9. Water entry rates as a function of spray rates
Fig. 10. Water entry potential as a function of static pressure difference
Tables
Table 1 Series of spray rates at increasing pressure steps and dwell times for water entry testing Table 2 Range of driving pressure ratio across the drainage cavity at the vent duct
![Fig 1. Location of through wall penetrations in test specimen (external elevation) [15]](https://thumb-eu.123doks.com/thumbv2/123doknet/14181912.476420/7.892.239.693.310.729/fig-location-wall-penetrations-test-specimen-external-elevation.webp)
![Fig 2. Wall-electrical outlet interface – vertical section [17]](https://thumb-eu.123doks.com/thumbv2/123doknet/14181912.476420/8.892.128.759.107.853/fig-wall-electrical-outlet-interface-vertical-section.webp)
![Fig 3. Wall-ventilation outlet interface – vertical section [17]](https://thumb-eu.123doks.com/thumbv2/123doknet/14181912.476420/9.892.125.801.103.805/fig-wall-ventilation-outlet-interface-vertical-section.webp)
![Fig 4. Wall-window interface – vertical section [17]](https://thumb-eu.123doks.com/thumbv2/123doknet/14181912.476420/10.892.155.777.111.977/fig-wall-window-interface-vertical-section.webp)
![Fig 5. Location of water collection troughs and pressure taps [15]](https://thumb-eu.123doks.com/thumbv2/123doknet/14181912.476420/12.892.232.709.110.584/fig-location-water-collection-troughs-pressure-taps.webp)