Late Weichselian deglaciation and early Holocene development of a cold-water coral reef along the Lopphavet shelf (Northern Norway) recorded by benthic foraminifera and ostracoda
Claudio Staldera,n, Silvia Spezzaferria, Andres Rüggeberga,b,c, Claudius Pirkenseera, Giordana Gennarid
aDepartment of Géosciences, University of Fribourg, Chemin du Musée 6, 1700 CH-1700 Fribourg, Switzerland
bRenard Centre of Marine Geology (RCMG), Department of Geology and Soil Science, Ghent University, Krijgslaan 281 S8, B-9000 Gent, Belgium
cGEOMAR|Helmholtz Centre for Ocean Research Kiel, Wischhofstrasse 1-3, D-24148 Kiel, Germany
dIstituto Andaluz de Ciencias de la Tierra (CSIC-UGR), Av. de las Palmeras, 4, 18100 Armilla, Granada, Spain
Cold-water coral (CWC) settlement in northern Norway is strongly related to the outlet-glaciers of the Fennoscandian Ice-sheet, and dating of known CWC structures show clearly post-glacial ages. Two gravity cores (POS391 559/2,277 cm long and POS391 559/3,282 cm long) were recovered on a CWC reef in the area of Lopphavet, northern Norway. Detailed investigations on lithology (sediment structures and composition), micropaleontology (foraminifera and ostracoda) and AMS14C dating on the epibenthic foraminifera Discanomalina coronata were performed on the two cores. Phosphorus analyses were performed only on core POS391 559/3. Results indicate that the whole core POS391 559/2 is representative of a CWC reef environment. The base of the core is dated at 10,6007120 cal. yr BP, thus representing one of the oldest ages of a Norwegian coral reef. Core POS391 559/3 documents the passage from a proximal glacier environment characterized byfine silty sediments with intercalation of several dropstone layers to a CWC ecosystem. The transition from the glacial to the interglacial stage is dated as old as 10,7257205 cal.
yr BP, whereas the base of the core is dated to an age of 15,3007550 cal. yr BP. Diversity of benthic foraminifera is higher within the CWC, especially in the intervals containing coral framework. Five clusters are identified based on the Bray–Curtis Similarity Term Analyses and the interpretation of data shows that they are related to different ecological settings, e.g.,fluctuations of the sea-ice cover; influence of the warmer and more saline Atlantic water masses; transitional to a fully interglacial environment; well oxygenated, nutrient-rich and high current setting being conducive to CWC.
Ostracod assemblages show that these crustaceans may be also used to characterize sedimentary facies on CWC reefs.
1. Introduction
Cold-water corals (CWCs) werefirst described from Norway in the eighteenth century (Pontoppidan, 1755; Gunnerus, 1768).
However, it is only from the last two decades that they have been extensively studied (e.g.,Mortensen et al., 1995; Freiwald et al., 1997; Hovland et al., 1998; Rogers, 1999; Freiwald et al., 1999;
Fosså et al., 2002;Lindberg and Mienert, 2005).
Recent studies (e.g.,Dorschel et al., 2005;Roberts et al., 2006;
Mienis et al., 2007;Huvenne et al., 2009;Thierens et al., 2010) have demonstrated a dominant oceanographic control in the development of cold-water coral reefs, mounds and ecosystems
in the north Atlantic. The distribution of frame-building scleracti- nian corals seems to be climatically controlled by a variability of physical, chemical and biological parameters such as water den- sity, temperature, salinity, pressure, currents, oxygen and nutri- ents availability (Roberts et al., 2006;Rüggeberg et al., 2007;Dullo et al., 2008). In particular δ15N signatures of CWC tissues (Duineveld et al., 2004), experiments of feedingLopheliain aquaria (Rapp and Sneli, 1999) or in situ observations on Norwegian reefs (Freiwald, 2002) suggest a rather large diversity in food sources.
Davies et al. (2009), Thiem et al. (2006) and Mortensen et al.
(2001) pointed out the preferential settlement of CWC along topographic highs and/or on locations affected by particularly strong tidal currents producing enhanced vertical flows and remobilization of suspended food particles. Furthermore,Hovland et al. (2012)demonstrated that the occurrence ofLopheliareefs on the shelf off mid-Norway are closely linked to pockmarks which
nCorresponding author. Tel.:þ41 26 300 89 79; fax:þ41 26 300 97 42.
E-mail address:claudio.stalder@unifr.ch (C. Stalder).
Published in 'HHS6HD5HVHDUFK3DUW,,
7RSLFDO6WXGLHVLQ2FHDQRJUDSK\±
which should be cited to refer to this work.
http://doc.rero.ch
may enhance the primary and secondary productivity through injection of nutrients to the water column and thus contribute to a continuous food supply for the living corals.
Roberts et al. (2006)andRüggeberg et al. (2007)showed that the decrease in temperature, nutrient supply, current speed and increase in sediment input during glacial times produces unfavor- able conditions for cold-water coral growth. They show that the return to interglacial/interstadial conditions is marked by the return to relatively warmer temperatures and by the re- establishment of high speeds in the circulation patterns with consequent removal of the glacio-marine deposits on topographic heights, thus producing again the favorable conditions for cold- water coral growth.
Since the last interglacial stage cold-water coral reef-like structures, dominated byL. pertusa, developed along the Norwe- gian continental shelf, from the inner of fjords to the shelf break (e.g., Dons, 1944; Mortensen et al., 1995, 2001; Freiwald et al., 1997,1999;Hovland et al., 1997;Hovland and Mortensen, 1999;
Fosså et al., 2000;Lindberg et al., 2007).
Pre-existing topographical heights on the sea floor, such as moraine ridges and iceberg plow mark levees control their distribution (Freiwald et al., 1999;Hovland and Mortensen, 1999;
Mortensen et al., 2001;Freiwald et al., 2002;Fosså et al., 2005). On the Norwegian margin, from the Oslo fjord to the northernmost reefs near the Nordkapp, living corals generally colonize the top and the upper slopes of these post-glacial structures and thrive at preferential water depths of 110–400 m influenced by Atlantic water masses (Fosså et al., 2002;Freiwald et al., 2004; Hovland et al., 1998;Hovland and Mortensen, 1999). However, CWC reefs do also occur at shallower sites as for instance the Tautra reef com- plex in the Trondheimsfjord (Dons, 1944;Hovland and Mortensen, 1999;Hovland et al., 2002).
In situ, dead corals characterize the steepflanks of the reefs, while bio-eroded coral rubble accumulates around the base. These reefs provide abundant and diverse microhabitats for benthic organisms (Mortensen et al., 1995).
In Norway, the corals colonized elevated hard substrates building elongated structures that can reach heights of 40 m and lengths of several kilometers (Freiwald et al., 1999;Freiwald et al., 2002).
Radiocarbon ages of Lophelia fragments clearly show the development of CWC reefs at least during the last 8000–8700 yr (Hovland and Mortensen, 1999;Hovland et al., 1998) whereas the onset of coral growth in Northern Norway was recently reported around 10,900 cal. yr BP according toLópez Correa et al. (2012), this latter age corresponds to the onset of the modern oceano- graphic conditions in the region.
This research focuses on two gravity cores (POS 391 559/2 and POS 391 559/3), which record the transition from glaciomarine sediments to an active cold-water coral reef spanning the interval from 15,300 to 2020 cal. yr BP. The micropaleontological study on benthic and planktonic foraminifera addresses the paleoenviron- mental evolution of the Lopphavet region from the Latest Pleisto- cene to the Holocene and benthic assemblages provide assessments of suitable conditions for coral growth during the last glacial/inter- glacial transition.
2. Study area and oceanography
Lopphavet is part of the Norwegian Sea located on the shelf north of Tromso (Fig. 1). This area is surrounded by the islands of Arnoya in the south, Loppa in the southeast, and faces the main entrance to the Kaevangenfjord and Altafjord (Fig. 1). The sea-floor
morphology at the study area is composed of generally shallow banks (less than 100 m water depth) and deep troughs reaching 380 m water depth (Fig. 1B and C). The bedrock at the core site consists mainly of Caledonian and Precambrian metamorphic rocks whereas further offshore Mesozoic and early Tertiary sedi- mentary rocks prevail (Fig. 1C,Sigmond, 1992;Winsborrow et al., 2012and references therein). The Quaternary sediment cover is generally thin on the shelf (o100 m) but increases towards the shelf break and consists mainly of till deposits and successions of glaciomarine sediments (Vorren et al., 1992;Laberg et al., 2012).
During the Last Glacial Maximum, northern Norway and the continental shelf of the South-Western Barents Sea were comple- tely covered by ice (Winsborrow et al., 2010). The Lopphavet area was at the confluence of the Fennoscandian and Barents Sea ice sheets during the last glaciation. Recent studies showed that this area has experienced intensive ice streaming during the last glacial maximum which lead to the formation of deep cross-shelf troughs on the sea-floor surrounded by moraines and banks (Vorren et al., 1998; Ottesen et al., 2008; Winsborrow et al., 2010, 2012).
Lopphavet was intensively influenced by a succession of retreats and advances of three major ice-streams (Hakjerringdjupet, Ful- goybanken and Sørøya through Ice Streams;Fig. 1B) and calving glaciers during the late Weichselian (Winsborrow et al., 2012).
The Late Weichselian deglaciation of Northern Norway was rather rapid, whereas the complexity of ice-streams and the timing of the ice-sheets retreat are still poorly understood (Landvik et al., 1998; Winsborrow et al., 2010). Retreat of the Fennoscandian Ice Sheet (FIS) from the shelf break is thought to have started around 18,000 cal. yr BP (Ottesen et al., 2005;Vorren and Plassen, 2002). Available studies from this region report early glaciomarine conditions by 17,100–14,128 cal. yr BP (Hald et al., 1989;Rasmussen et al., 2007;Vorren and Plassen, 2002;Vorren et al., 1978). From the area of Ingoydjupet (Fig. 1),Junttila et al.
(2010)andAagaard-Sørensen et al. (2010)even report glacier free conditions at about 18,700 and 18,600 cal. yr BP, respectively.
According to Winsborrow et al. (2012) glaciomarine conditions prevailed at the outermost Soroya Trough around ca. 15,000 cal.
yr BP and at ca. 14,500 cal. yr BP at the outer Altafjorden close to Lopphavet (Fig. 1).
The surface water circulation off Norway is characterized by two northward-trending current systems (Fig. 1), the Norwegian Atlantic Current (NwAC) which is mainly a continuation of the North Atlantic Current (NAC) and the Norwegian Coastal Current (NCC), which has its main source in the Skagerrak region (Hebbeln et al., 2006). The warm and saline Atlantic water (temperature¼ 6–91C, salinity¼435) enters the Norwegian Sea through two major pathways, from the southwestern part by passing the Iceland–Faroe Ridge and from the southeast along the Faroe– Shetland Channel (Orvik et al., 2001;Orvik and Niiler, 2002). The western branch of the NwAC follows the slope topography of the Vøring Plateau towards Jan Mayen and continues further north- ward to the Fram Strait. The inflow along the Faroe–Shetland Channel is mainly constraint along the Norwegian shelf edge with a minor stream flowing parallel to the NCC on the shelf and converging again southwest off the Lofoten Islands (Poulain et al., 1996). The lower boundary of the NwAC reaches a water depth ranging between 500 m and 600 m (Blindheim, 1990).
The core of the eastern NwAC branch has an annual mean velocity of 30 cm/s but may reach maximum values up to 117 cm/s on the uneven shelf topography (Orvik et al., 2001). Around the CWC reefs, strong bottom currents prevail with velocities up to 44 cm/s measured at the Sula reef (Eide, 1979).
Further north, the NwAC enters the Barents Sea before dividing into a stream flowing northward (West Spitsbergen Current) to Spitsbergen and a stream bifurcating to the east (North Cap Current) parallel to the northern Norwegian coast (Loeng, 1991).
http://doc.rero.ch
Off Troms, close to the study area,Sundby (1984)andMoseidjord et al. (1999)have shown that glacially eroded trenches are steering Atlantic water onshore. Such deep troughs allow the Atlantic water to enter the fjords where it is, through tidal and circulation-controlled patterns, periodically renewed (Ljoen and Nakken, 1969;Rüggeberg et al., 2011).
At its main source, the NCC consists primarily of a mixing of freshwater from the Baltic Sea outflow and from the surrounding river discharges (Mork, 1981;Sætre, 2007). Its salinity (30–34.9) and temperature (3–181C) may strongly change with seasons (Mikalsen et al., 2001). Flowing parallel to the Norwegian shore, the NCC caps additional freshwater from the mainland. Driven by the density contrast to the Atlantic water it stretches to the shelf edge over the NwAC, getting broader and shallower in summer (Sætre et al., 1988;Garvine, 1995).
At the entrance into the Barents Sea, the density contrast between the NCC and the NwAC diminishes and increased mixing promotes the separation of the NCC in a branchflowing along the slope driven by local winds and a branch overlying the Atlantic water further offshore and more controlled by buoyancy (Skagseth et al., 2011).
In winter the NwAC and NCC mix and in combination with the trade winds and the sea floor topography produce eddies and
upwelling of nutrient rich waters triggering plankton blooms (Berner and Wefer, 1994; Sætre, 1999). In summer the two currents separate again at a water depth of about 100 m because their density gradient prevents mixing (Sætre, 1999;Mitchelson- Jacob and Sundby, 2001;Mikalsen et al., 2001).
The cold-water coral ecosystems occurring between 140 and 320 m are under the influence of the NwAC.
3. Materials and methods
During R/V POSEIDONcruise 391 in 2009 gravity cores POS391 559/2 (70126.925 N, 21111.101 E; water depth 225 m; core length 277 cm) and POS391 559/3 (70126.946 N, 21111.175 E; water depth 237 m; core length 282 cm) were recovered from a cold-water coral reef along Lopphavet on the northwestern Norwegian shelf (Fig. 1). A schematic representation of the core positions along the reef is provided inFig. 2. Based on multibeam data and in situ observations (submersible dives), Fig. 2A shows the general sedimentary facies distribution around and on the reef structure.
A close-up of the core location area displays internal small-scale variations of the main sedimentary facies (Fig. 2B). The cores were 22°E
70°N 20°E
21°E
21°E 21°30’E
21°30’E 20°30’E
20°30’E 70°30’N
70°15’N 80°N
75°N
70°N
65°N
60°N
55°N 0°
5°E
10°E 15°E 20°E 25°E 30°E
35°E
21°12’E
21°03’E 21°08’E
70°28’N
70°27’N
POS391 559/3 POS391 559/2
1 km
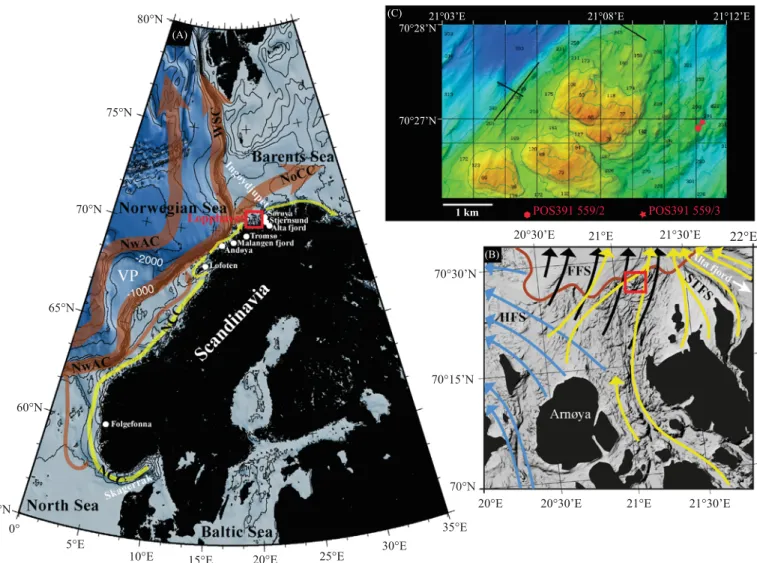
Fig. 1.(A) Location of the study area (red box) along the Norwegian continental margin. (B) Close-up of the Lopphavet sea with shaded sea-bottom topography (http://www.
mareano.no/en) and surrounding islands (black). The arrows show main paleo ice-streamflows (Winsborrow et al., 2012): Håkjerringdjupetflow set (HFS, blue arrows), Fugløybankenflow set (FFS, black arrows) and Sørøya Troughflow set (STFS, yellow arrows). Indicated are also the contact between sedimentary and crystalline bedrocks (brown solid line,Winsborrow et al., 2012), the location of the sampled cold-water coral reef (red box) and the trough connecting the Stjernsund to the Altafjord (white arrow). (C) Multibeam map acquired during POSEIDON cruise 391 showing the location of the studied gravity cores. Water depth is expressed in meters. (For interpretation of the references to color in thisfigure legend, the reader is referred to the web version of this article.)
http://doc.rero.ch
stored at 41C, opened, described and sampled at the GEOMAR| Helmholtz Centre of Ocean Research Kiel.
3.1. Micropaleontological study
Samples for micropaleontological analyses (benthic and planktonic foraminifera and ostracods) were taken at 3 cm interval for both cores and processed following standard procedures (seeSchönfeld et al., 2012and references therein). They were weighted, and then washed through 63mm, 125mm and 250mm sieves to obtain three size fractions. Residues were dried at room temperature and weighted.
When a residue contained sensibly more than the target number of 300 specimens of foraminifera in a single fraction, it was split using a dry splitter. A minimum of 200 specimens were identified at species level, glued on Plummer cell-slides and counted for each fraction (about 900 specimens per sample).
When samples contained less than 200 specimens per fraction, all specimens were counted. All 94 samples from core POS391 559/
3 were analyzed for their micropaleontological content, whereas a
total of 31 samples chosen according to lithological changes were investigated for core POS391 559/2. The identified species of benthic foraminifera are listed in Appendices 3 and 4. The two cores are stored at GEOMAR in Kiel and the foraminiferal collec- tion is stored at the Department of Geosciences, University of Fribourg.
Raw data of benthic foraminifera were statistically treated using the Software PRIMER 6 (Clarke and Warwick, 2001). The Fischer-alpha index was obtained by univariate statistical analysis.
The data set was also double-square root transformed to limit the contribution of most abundant and ubiquitous species (Field et al., 1982) and the Bray–Curtis (dis-)Similarity Term Analysis was calculated (Clifford and Stephenson, 1975). The same similarity matrix used for Bray–Curtis (dis-)similarities was used also to obtain the non-metric MultiDimensional Scaling-nMDS plot (Kruskal, 1964; Kruksal and Wish, 1978). An overview of the characteristics of the nMDS plot can be found in (Warwick and Clarke, 1991; Clarke and Warwick, 2001) and example of its application on foraminiferal data inBasso and Spezzaferri (2000) andMargreth et al. (2009).
The nMDS plot was interpreted according to the Similarity Percentage Analysis (SIMPER), which highlights the contribution of each species to the total average similarity and dissimilarity between different groups and within single groups. Taxonomic notes, and quantitative data of benthic foraminifera are reported in Appendices 1and2.
Ostracods were investigated using the same samples previously studied for foraminifera and each individual specimen was identified at species level.Appendix 2reports the list of the identified species.
Both cores have also been investigated for their main biogenic components (MBC) at 3 cm interval including sponge spicules (SiO2), radiolarians, serpulids, echinoderm fragments (ophiurid ossicles and shields, urchin spines), bryozoans and marine shells (brachiopods, bivalves, gastropods).
3.2. AMS14C dating
Radiocarbon dating was performed at the Eidgenössische Tech- nische Hochschule (ETH) Zürich using the accelerator mass spec- trometry (AMS) technique. Table 1 reports the dated samples, corrected and calibrated (AD 1950).
From selected samples, benthic foraminifera were picked until at least 5–10 mg of pure carbonate were obtained. The species Discanomalina coronata, which lives attached to a hard substrate and associated to the cold-water coral ecosystems (Margreth et al., 2009) was chosen whenever possible. Alternatively mixed benthic species were picked. Specimens were cleaned in ultrasounds to remove eventual contamination. They were dissolved in concen- trated phosphoric acid (Hajdas et al., 2004a) and the extracted carbon dioxide was converted into graphite as described byHajdas et al. (2004b). A reservoir age correction of 390 years with a
Table 1
Radiocarbon dates, calibrated ages and mean sedimentation rates of core POS 391 559/2 and POS 391 559/3.
Lab. code Core number Core depth
(cm)
Material 14C age (yr BP) (reservoir corrected)
95.4% 2scal.
age ranges (yr)
Age used (cal. yr BP)
Sedimentation rate (cm/kyr)
ETH-42972 POS391 559/2 1 D. coronata 2405740 2170–1870 20207150
ETH-42973 POS391 559/2 226 D. coronata 9130750 10,120–9660 98907230 28.6
ETH-46546 POS391 559/2 274 D. coronata 9730740 10,715–10,480 10,6007120 67.6
ETH-42969 POS391 559/3 1 D. coronata 6350745 6950–6650 68007150
ETH-42970 POS391 559/3 64 D. coronata 9815750 10,930–10,520 10,7257205 16.1
ETH-42971 POS391 559/3 274–277 N. labradorica, 13,200760 15,850–14,750 15,3007550 45.9
C. pachyderma 100 m 180
200 220 240 260 280 300 Water Depth (m)
POS 391 559/3
POS 391 559/2
Glaciomarine sediment with dropstone layers Dropstone layer at the base of the corals
Coral debris with fine to coarse grained sediments (mainly reworked) Coral framework with high abundance of bivalves/gasteropods and serpulids
NwAC
Not to scale
Fig. 2.Sketch of the sampled cold-water coral reef. (A) Topography and main sedimentary facies are based on in situ observations with the Jago submersible and bathymetric data (modified afterFreiwald et al., 2002; Spezzaferri et al., 2013).
(B) Close-up of the studied cores along the reef. Sedimentary facies are according to the core lithology.
http://doc.rero.ch
regional deltaR-value of 10735 (Reimer et al. 2009) was applied to obtained radiocarbon conventional ages, which were then calibrated using the program OxCal 3.10 (Bronk Ramsey, 2005).
All ages are given in calendar years before present (cal. yr BP).
3.3. Phosphorus analyses
A 5-step sequential extraction technique following the SEDEX method ofRuttenberg (1992)was applied on the 94 samples of core POS391 559/3 to quantify 5 different phosphorus phases contained in the sediment. Around 80 mg of dry bulk sediment were ground to pass through a 150mm mesh sieve. This technique allows to distin- guish the contribution of loosely-bound phosphorus, authigenic apatite, detrital apatites (igneous, metamorphic and sedimentary) and organic-bound phosphorus. In this study, only detrital phos- phorus data will be presented and discussed. A whole characteriza- tion of the phosphorus fractions from core POS391 559/3, including organic carbon content and mineralogy determination of the IRD layers is part of a complementary study. Since detrital phosphorus occurs in detrital grains it has often been used to estimate the variability of detrital inputs (river and glacially related discharges, eolian inputs) to the surrounding sedimentary environments (Louchouarn et al., 1997; Tamburini et al., 2002). Extraction was performed at the University of Fribourg and samples were measured with a Bio-Tek Uvikon XS spectrophotometer using the molybdate blue method (Grasshoff et al., 1983).
3.4. Sedimentology
Ice-rafted debris (IRD) and grain size distribution were system- atically evaluated in both cores using the largest fraction (4250mm) of the residues prepared for micropaleontological investigations (Fig. 3). The IRD were counted in the 4250mm and 41 mm size fractions following Watkins et al. (1974) and standardized for 1 g of the total dry weight of each sample. Grain size distribution was obtained by weighting the three mesh sieves residues used for micropaleontological analyses and is expressed in percentage of the total dry sediment of the samples (Fig. 3).
Distinction between coral rubble and coral framework is based on core description and X-ray tomography.
4. Results
4.1. Lithology, biogenic components and IRD content 4.1.1. Core POS391 559/2
Scleractinian coral fragments (mainlyL. pertusa) and the men- tioned biogenic components (sponge spicules (SiO2), radiolarians, serpulids and echinoderm fragments) are continuously present all over the 277 cm long sediment core (Fig. 3A). Three lithological units can be recognized. The sediments from 229–277 cm belong to lithological unit P-1 and consist of coral rubble in a dark olive brown (3/3 2.5y) muddy silt matrix. The lithological unit P-2 ranges from 86–228 cm and is characterized by a succession of coral rubble and coral framework intervals in a grayish brown (4/2 2.5y) sandy mud. Dense and interconnected coral branches occur from the base of lithological unit P-2 to 180 cm and from 103– 137 cm core depth. The intervals from 137–180 cm and 86–103 cm contain dislocated coral fragments (rubble). Sample 211 cm con- tains a large abundance of serpulids. Any sedimentary structures have been identified in P-2 and P-3. The lithological unit P-1 from 85 cm to the top of the core consists of light olive green (5/3 2.5y) muddy sand (sand lenses) with a visible coarsening up starting from 40 cm upwards. In this lithological unit, coral framework has been identified from 47–86 cm and 17–29 cm core depth. Coral rubble occurs from 29–47 cm and from 17 cm to the top of the core. Low abundance of IRD is observed in P-3 (up to 4 debris/g of sediment at 264 cm) and almost no IRD was found in P-2 (up to 1 debris/g of sediment at 220 cm). The highest content of IRD of 9 particles/g of sediment was found at 1 cm core depth. Grain size distribution shows a gradual decrease of the finer fraction (o63mm), from the base of the core to the top passing from a matrix with more than 95% of silts/clays at 271 cm to less than 25%
at 1 cm.
4.1.2. Core POS391 559/3
Three different lithological units can be identified in Core POS 391 559/3 (Fig. 3B).
The sediments from 68–282 cm belong to the lithological unit G, which is characterized by 4 IRD layers from 264–282 cm (L1), 184–191 cm (L2), 132–138 cm (L3) and 67–94 cm (L4) in a gray (5/
1 2.5y) silty mud matrix without any coral fragments and apparent sedimentary structures. Scarce biogenic components are present along lithological unit G with echinoderm fragments present from
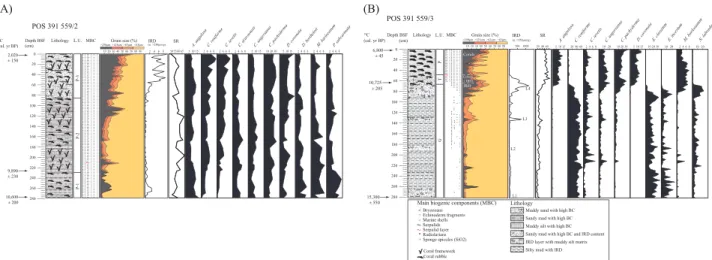
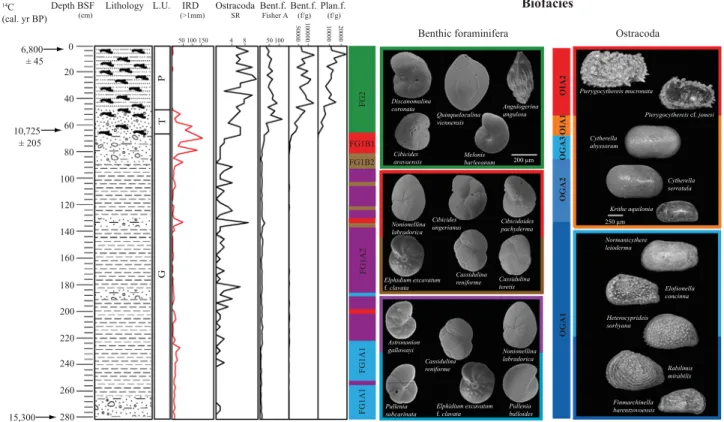
Fig. 3.Lithological log of core POS 391 559/2 (A) and POS 391 559/3 (B) plotted versus grain size distribution, IRD, main biogenic components (MBC),14C ages (cal. yr BP).
Also shown are species richness of benthic foraminifera (SR) and the distribution of the ten most common benthic foraminiferal species in both cores (in % of the total fauna).
http://doc.rero.ch
the base of the core and abundant radiolarians, sponge spicules and marine shells between 118–187 cm. Thefirst occurrence of a marine shell (bivalve) was observed at 223 cm. The IRD record (Fig. 3B) shows a continuous distribution from the base of the core up to 49 cm with a positive peak (up to 900 debris/g of sediment) (L3) and a maximum for L4 (up to 1300 debris/g of sediment).
These 4 IRD layers (L1–L4) contain angular to subrounded drop- stones with different mineralogical composition (e.g., granite, gneiss, old red sandstone) and different size (up to 6 cm in diameter). Few IRD (0–16 debris/g of sediment) is also present in lithological unit P with a slightly higher contribution in thefirst 7 cm (up to 16 debris/g of sediment at 4 cm core depth). Grain size distribution shows a nearly gradual decrease of silts and clays along unit G, from values of 96% at 247 cm, 65% at 133 cm and 40%
at 67 cm whereas lithological units T and P show an alternation between sandy and muddy levels.
The lithological unit T ranges from 49–67 cm and consists of coral fragments (coral rubble; mainly L. pertusa) and shows a continuous distribution of biogenic components (e.g., gastropods, bivalves, brachiopods, radiolarians, echinoderms and abundant sponge spicules) except for the serpulids and the bryozoans occurring for thefirst time at 61 cm depth. This lithological unit contains a large number of well-sorted subangular IRD (up to 800 particles per gram of sediment) in a coarse light olive green (5/3 2.5y) silty matrix. The transition from the lithological unit T to P coincides with a drastic increase of serpulids (Fig. 3B) at 49 cm.
From 48 cm up to the top of the core sediments are characterized by coral rubble (mainlyLophelia pertusa) mixed with other different biogenic fragments (e.g., gastropods, bivalves, brachiopods, bryozoans,
serpulids, radiolarians, echinoderms and abundant sponge spicules) in an olive brown (4/3 2.5y) sandy mud matrix and correspond to the lithological unit P.
4.2. AMS14C chronology
Three AMS14C ages obtained fromD. coronataprovide an age of 10,6007120 cal. yr BP for the base for core, 98907230 cal. yr BP at 226 cm and 20207150 cal. yr BP for the uppermost part of core POS391 559/2.
Age assessment of core POS391 559/3 is based on two AMS14C ages obtained fromDiscanomalina coronata(benthic foraminifer) and one age based on mixed benthic foraminifera species. The deeper sample (274–277 cm) was too small for monospecific dating, therefore mixed benthic foraminifers were picked. Ages and sedimentation rates are shown inTable 1.
The sediments at the base of the core are dated as old as 15,3007550 cal. yr BP.
The sample immediately below the interval containing cold- water coral fragments displays an age of 10,7257205 cal. yr BP while the sediments at the top of the core are dated at 68007 150 cal. yr BP.
4.3. Foraminiferal and ostracods abundance and distribution Micropaleontological analyses on core POS391 559/2 and POS391 559/3 provided a dataset of 176 benthic foraminifera species (Appendices 3 and 4). Abundance (in % of total abun- dance) and distribution of the ten most common species Fig. 4.(A) Dendrogram based on the Bray–Curtis (di)-similarity matrix of the benthic foraminifera data set. Dashed horizontal lines separate high level clusters (64%) from lower level clusters (72%). Dashed vertical lines highlight non-significantly different cluster levels (SIMPROF, Similarity Profile test). (B) Non-metric MultiDimensional Scaling (nMDS) plot obtained from the Bray–Curtis (di)-similarity matrix of the benthic foraminifera data set. Dashed line separates cluster FH1 from cluster FH2.
http://doc.rero.ch
recorded in the two cores are shown in Fig. 3. Planktonic specimens have also been counted and eight species (Globiger- ina bulloides, Globigerinita glutinata, Globigerinita uvula, Neogloboquadrina dutertrei,Neogloboquadrina incompta,Neoglo- boquadrina pachyderma,Strepochilus tokelaue,Turborotalia quin- queloba) are identified in both cores. Because of their extremely low abundance in core POS391 559/3, planktonic foraminifera will not be discussed in further detail.
While the list of references dealing with the subject of temperate to arctic (deep) marine ostracods is quite extensive, only one overview paper recording ostracods from cold-water coral mounds has been published so far (Coles et al., 1996). The high-resolution sampling in both of our investigated cores repre- sents a unique opportunity to investigate the transition of Latest Pleistocene to Holocene ostracod assemblages in detail in a high- diversity environment.
The low number of specimens and the presence of a relatively high ratio of instars renders a quantitative statistical analysis of the ostracod assemblages unfeasible. Therefore a subdivision of faunal assemblages is based on a qualitative analysis of lowest and highest occurrences (range charts) and simple species richness curves.
4.3.1. Core POS391 559/2
The ten most abundant benthic foraminifera species of core POS391 559/2 are continuously present from the base to the top of the core (Fig. 3A). The distribution of epifaunal speciesCibicidoides pachyderma and Discanomalina coronata follows an increasing trend toward the top. Cibicidoides pachyderma has remarkably lower values in the interval 181–277 cm (12–26.2%) than in the interval 1–169 cm (17–31%), whereasD. coronatais less abundant from 136 to 277 cm (3.7–13.5%) than in the overlying sediments (9.4–18.6%). A considerable positive peak (þ7.2%) ofD. coronata occurs around 82 cm coinciding with a change in lithology (base of P-1) and with a drop in diversity down to 51 species.
The abundance curves of the infaunal species Cassidulina reniformeandCassidulina teretisclearly show an increasing trend, similar to both species from the base toward the top of the core.
The lowest abundances are observed from 226 to 277 cm (values between 0.3–2.8% and 0.3–1.9%, respectively) and the highest abundances are in the uppermost part with a peak at 10 cm (up to 9.5% and 8.5% respectively for both species). At 121 cm and 166 cm C. reniforme becomes temporarily less abundant while benthic foraminifera species richness shows two major peaks of diversity (69 species at 121 cm and 67 at 166 cm). Such a negative
1
47 1013 16
19 2225 28 3134 37 40
43 464952 55 58 61
64 67 7082 85 88 91 106 121 136 79 73 76 133 199 217 220 157 193 214 211
154 166 178 196 208 202 205 175 181 190 169 172 223 94 97 253 163 184 127 145 148 142 160 100 11
5
151 11
2
139 109 11
8
124 103 130 232 280 187 256 235 247 262 268 259 277 274 226 241 271 250 265 244 229 238
Similarity (%)
0
20
40
60
80
100
FG2
FG2 FG1
FG1B FG1A
FG1A1
FG1A1 FG1A2
FG1A2 FG1B2
FG1B2 FG1B1
FG1B1 14
44 57
1
4 7
10
13 16
19 22
2528 31
34 37
40 43 46
49 5552
5861 64 67 199
70 76
73 79
133 85 91
82 106 136
121 88 250
244 229
187 256
262 238235 268232 274
280
277 226271 265
259 247
241
223 220 211
217 154148 214 94157 205
154145 253 172163193
196100127 139124 178118 160142 208115
109103 16917519097 181202112130
2D Stress: 0.06
5 clusters at 57% similarity
“Glacial”
“Interglacial”
FG2 FG2
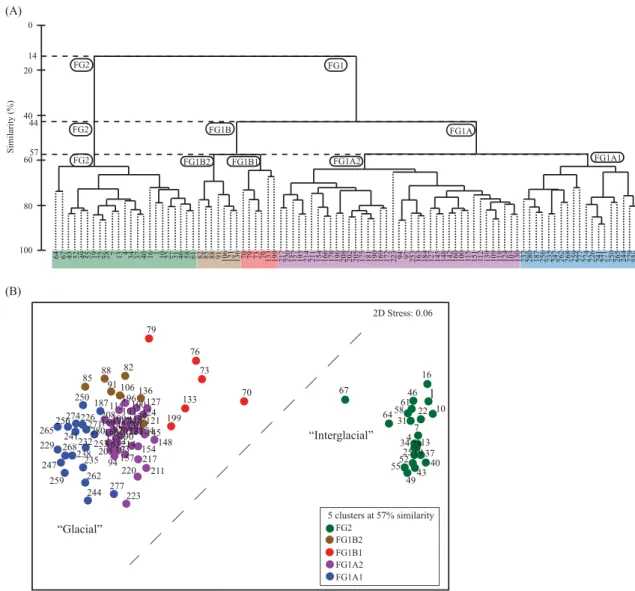
Fig. 5.(A). Dendrogram based on the Bray–Curtis (di)-similarity matrix of the benthic foraminifera data set. Dashed horizontal lines separate high level clusters (14%) from lower level clusters (44% and 57%). Dashed vertical lines highlight non-significantly different cluster levels (SIMPROF, Similarity Profile test). (B) Non-metric Multi- Dimensional Scaling (nMDS) plot obtained from the Bray–Curtis (di)-similarity matrix of the benthic foraminifera data set. Dashed line separates Interglacial/Coral facies cluster FG2 from the glaciomarine clusters FG1A1, FG1A2, FG1B1 and FG1B2.
http://doc.rero.ch
correlation seems to develop from 118 cm to the top of the core, where C. reniforme clearly increases in abundance while the SR becomes lower. Highest abundances ofC. reniformeandC. teretis are observed in P-1 where the IRD input is important.
The abundance curves ofAngulogerina angulosa, Discorbinella bertheloti, Melonis barleeanum and Pullenia subcarinata show an opposite pattern with a decreasing trend toward the top of the core. The absolute maximum for each of these species is recorded within P-3. In particular, the two infaunal speciesM. barleeanum andP. subcarinataare consistently present and more abundant in thefinest sediments of the core (P-3) reaching values up to 8.5%
(M. barleeanum) and 9.3% (P. subcarinata). They progressively decrease in abundance in the coarser sediments. The lowest abundance of M. barleeanum (1.3%), recorded at 166 cm, corre- sponds to generally lower values of the other infaunal species (e.g.,A. angulosa,C. reniforme,C. teretis,P. subcarinata). Epibenthic species Cibicides aravaensis and Cibicides ungerianus show a relatively constant distribution in the whole core contributing with values from 2% to 6.6% and 3.5% to 11.8%. Fisher's alpha index of the benthic foraminifera shows values ranging from 36.3 at 1 cm to 103.6 at 196 cm core depth. Highest values are reached within the sediments belonging to coral framework intervals.
Fisher's alpha index generally shows a positive correlation to coral framework (Fig. 6).
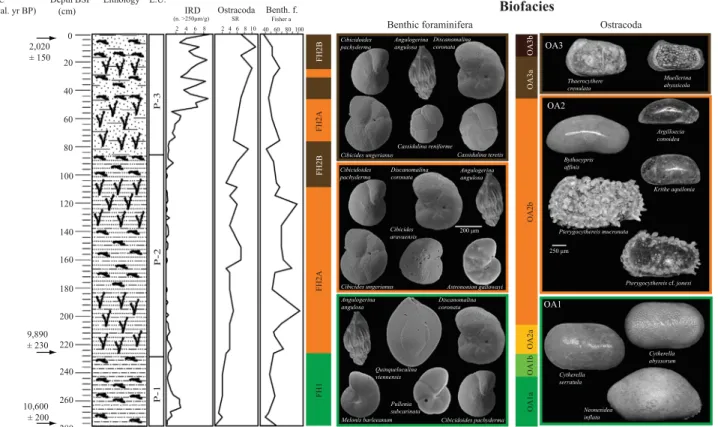
The lowest sample in proximity to the Pleistocene–Holo- cene boundary is ostracod-barren (Fig. 6). In subsequent samples we distinguish three assemblages (OA1–3), with OA1 further subdivided (Fig. 6). Species richness increases rather gradually from the oldest to the youngest sample, with afirst maximum in OA2 (9 taxa) and a second in OA3 (10 and 11 taxa).
Only Neonesidea inflata occurs in all samples. OA1 (205– 271 cm) is characterized by the stepwise (OA1a-b) establish- ment of the most common and long-ranging species (Cytherella spp. andNeonesidea inflata, laterPterygocythereisspp.), leading
to a moderate increase in species richness (2–4 taxa). In OA2 (46–241 cm) the last common genus (Krithe spp.) and acces- sory taxa (e.g., Bythocypris affinis,Argilloecia conoidea,Cyther- opteron spp.) appear, with the latter occurring in a rather scattered pattern. OA3 (0–46 cm) is characterized by the simultaneous lowest occurrence of Thaerocythere crenulata and Muellerina abyssicola and the disappearance of Pterygo- cythereis muconata. The last record ofCytherella serratulais in mid-OA3 (Fig. 6).
4.3.2. Core POS 391 559/3
The abundance curves of the ten most abundant benthic forami- nifera species clearly show (Fig. 3B) two major distribution patterns in this core.
Lithological unit G is characterized by high abundances of Cassidulina reniforme, Elphidium excavatum f. clavata, Elphidium incertum and Nonionellina labradorica which contribute with at least 75% to the total fauna. The dominant speciesC. reniformehas a relatively homogenous distribution along lithological unit G with highest frequencies between 91 and 282 cm (up to 65% at 223 cm).
This species decreases considerably from 30% at 88 cm to less than 3% at 64 cm. The distribution ofElphidium excavatumf.clavataand E. incertumis relatively similar. They are abundant and frequent in the lowest part of the core (223–282 cm) with values up to 35% at 247 cm forE. excavatum f. clavataand 27% at 250 cm forE. incertum.
From 223 cm an important decrease in abundance for both species occurs (values are less than 10% forE. excavatumf.clavataand 1% for E. incertum). Both species show then a strong increase in the upper part of the core just before their simultaneous disappearance at the base of the coral debris (64 cm). This pattern and decline occurs at different depths/times: E. excavatum f. clavata starts to increase from 106 cm and declines from 88 cm, whereasE. incertumincre-
Fig. 6.Lithostratigraphy of core POS391 559/2 plotted against ostracoda species richness (SR) and Fisher's alpha index of benthic foraminifera and the assemblages obtained from the benthic foraminifera and ostracoda compositional data set.
http://doc.rero.ch
ases from the base of the IRD layer L4 (94 cm) and decreases from 85 cm.
Nonionellina labradoricashows a continuous distribution from the base of the core to the top of lithological unit T (49 cm). Within lithological unit G, the lowest abundances ofN. labradorica are observed from 223 to 282 cm (1–5%) and at the base of the dropstone layer L4 (less than 2%).
A drastic increase inN. labradoricaco-occurs with IRD layer L4 and coincides with the increase ofE. incertum. The maximum abundance ofN. labradorica (22%) is reached at 79 cm and a remarkable decrease is observed from 70 cm (18%) to 67 cm (3%) corresponding to the first occurrence of A. angulosa and D.
coronata(67 cm). This species is observed in lithological unit P only in a few samples with very low contribution (less than 0.5%).
An opposite distribution pattern prevails for Discanomalina coronata and Angulogerina angulosa. Discanomalina coronata is completely absent in lithological unit G, whereasA. angulosa is found in only seven samples with isolated specimens. However, both species are abundant in the interval containing coral frag- ments (P and T; 1–67 cm).
A similar distribution pattern is observed for the two epibenthic speciesC. ungerianusandC. pachyderma. Their abundances increase stepwise to the top of the core with values lower than 4% between 217 and 282 cm, up to 15% from 85 to 217 cm and higher than 30% in the uppermost part of the core.Melonis barleeanumfollows this trend with sporadic occurrences along lithological unit G and a continuous presence from 85 cm to the top of the core. This species is continuously present but never abundant (less than 2%) from 82 to 217 cm and drastically increases from 82 cm to 40 cm, where the curve shows the highest abundances (up to 8% at 40 cm).
Furthermore, the record ofM. barleeanum reveals two major peaks at 199 cm (4%) and 208 cm (6%) as well as a clear decrease in abundance from 28 cm upward.
The distribution pattern of Cassidulina teretisis slightly different with scattered occurrences from 217 to 282 cm (abundances less than 2%) and higher frequencies between 67 and 214 cm (up to 8%). Two major abundance peaks occur at 211 cm and 199 cm coinciding with sporadic higher abundances ofM. barleeanum.
In lithological unit P, C. teretishas relatively constant abun- dances in the interval 34–61cm (1.1–1.9%) before increasing sensibly between 1 and 31 cm (1.8–5%).
Benthic foraminifera species richness displays an identical step- wise increasing distribution pattern as observed for the abundance of single species e.g.,C. ungerianus,C. pachydermaandM. barleea- num. The lowest diversity occurs from 229 to 282 cm (13 to 27 species) followed by remarkably higher diversity from 79 to 226 cm (16–40 species) and highest species richness (30–72 species) occurs from 1 to 76 cm. A considerable higher diversity (40 species) is identified at 133 cm within IRD layer L3. A similar trend is observed in correspondence to the top of IRD layer L4 (from 67–79 cm).
Fisher's alpha index of the benthic foraminifera from this core shows the same gradual and stepwise increase from the base to the top of the core with lowest values in the interval 226–280 (4 at 229 cm) and highest scores within the sediments containing coral fragments (up to 115.3 at 55 cm core depth). However, in litholo- gical unit P Fisher's alpha index clearly decreases towards the top of the core (Fig. 7).
The stratigraphic distribution of ostracod species (Fig. 7) allows the distinct separation of two main assemblages, referred to as
“glacial”(OGA, 67–280 cm) and“interglacial” (OIA, 0–67 cm). No species of the former occur in the latter, except for fragmented or badly preserved, presumably reworked rare specimens in the lowermost samples of OIA1.
The“glacial”assemblage is subdivided in four sub-assemblages.
OGA1 (133–280 cm) is characterized by an extremely low number of specimens, a low species richness (max. 2 taxa) and a high number of ostracod-barren samples. Within OGA1 there are two
Fig. 7.Lithostratigraphy of core POS391 559/3 plotted against ostracoda species richness (SR) and Fisher's alpha index of benthic foraminifera, specimens per gram of sediment, and the assemblages obtained from the benthic foraminifera and ostracoda compositional data set.
http://doc.rero.ch
diversity peaks (at 181 and 133 cm, 6 and 8 taxa respectively), despite a low general diversity (1–2 taxa). There is a gradual transition to OGA2 (85–133 cm), with the lowest occurrence of the most common speciesNormanicythere leiodermaclose to the basal sample, and the disappearance of 3 taxa in the topmost sample (Rabilimis mirabilis,Heterocyprideis sorbyana,Finmarchinella bare- ntzovoensis). In OGA3 (67–85 cm) the average species richness is higher, due to the scattered occurrence of rare accessory taxa (e.g., Cytheropteron spp., Finmarchinella aff. finmarchica). The species Normanicythere leiodermaand Elofsonella concinna are only pre- sent in this brief interval and disappear at the top of the unit.
A complete faunal turnover on species and to a large scale on generic level takes place in sample 67 cm, with a marked increase in species richness from 2 to 6 taxa. OIA1 (55–67 cm) is charac- terized by the stepwise establishment of the most common and long-ranging species (Cytherellaspp.,Krithe aquilonia,Neonesidea inflata,Pterygocythereisspp.). The succession of lowest occurrences however is markedly different from core POS 391 559/2, especially the presence ofMuellerina abyssicolaandThaerocythere crenulata in the basal sample 67 cm. In OIA2 accessory taxa (e.g.,Bythocypris affinis, Argilloecia conoidea, Macrocypris sp., Cytheropteron spp.) appear in a rather scattered pattern, increasing the overall species richness to 5–10 taxa.
4.4. Statistical treatment of the benthic foraminifera dataset Hierarchical clustering based on the Bray–Curties Similarity matrix (Figs. 4A and5A) and nMDS (Figs. 4B and5B) plots were applied on the data set of both cores (Appendices 3and4). Results obtained from this multivariate statistical treatment provide use- ful information about possible and discrete distribution patterns of foraminiferal assemblages in sediment cores, including the con- tribution (Appendices 1and2) of each single species to the total similarity (Clarke and Warwick, 1994). To simplify the interpreta- tion (Appendices 1and2) and reduce the number of species with very low contributions without losing significant information, a cutoff value of the cumulative contribution was fixed at 90%.
A similarity cut is applied to the two cores at different similarity levels. This procedure is made according to the interpretation of the assemblages made with the abundance curves and with the lithology.
4.4.1. Core POS 391 559/2
The hierarchical cluster analysis on core POS 391 559/2 (Appendix 1) shows two clusters (FH1 and FH2) separated at 64% of the Bray– Curties Similarity (Fig. 4A). Samples from the lower part of the core (226, 241, 256, 268, 271 and 277) belong to cluster FH1 whereas all the others belong to cluster FH2 (Fig. 4A). On the nMDS plot (Fig. 4B) this separation between cluster FH1 and FH2 is highlighted by a dashed line. At a lower level of similarity (72%), three clusters can be recognized.
Cluster FH1 keeps unchanged (226, 241, 256, 268, 271 and 277).
Thirty-four species account for 90.3% of the average similarity (Appendix 1). This assemblage is dominated byC. pachydermaand A. angulosawhereasP. subcarinata,C. ungerianusandD. coronataare major accessory species contributing at almost the same level (Appendix 1; Fig. 4). Cluster FH1 is exclusively found within lithological unit P-3. Cluster FH2 is further subdivided in cluster FH2A and FH2B. Cluster FH2B includes samples from the upper part of the core (1, 10, 16, 31, 76, 82 and 91) where the IRD content is generally higher and species diversity lower (Fig. 6). Thirty-three species represent 90.6% of the average similarity (Appendix 1). In this ClusterCibicidoides pachydermagives the highest contribution to the assemblage followed byD. coronataand accessory speciesA. angu- losa,C. ungerianus,C. teretisandC. reniforme(Appendix 1;Fig. 4).
The remaining samples belong to cluster FH2A mostly correspond- ing to lithological unit P-2 (except samples 25, 46 and 61). Thirty-nine species account for 90.4% to this assemblage (Appendix 1) dominated byC. pachyderma. Accessory species areA. angulosa,D. coronata, and C. ungerinaus.
4.4.2. Core POS391 559/3
The dendrogram and the nMDS plot resulting from the Bray– Curties similarity matrix based on the dataset of core POS391 559/
3 (Appendix 4) is given inFig. 5. At lowest similarity (14%) the hierarchical clustering separates two assemblages, FG1 and FG2 (Fig. 5A). The separation between those clusters is characterized by a dashed line on the nMDS plot (Fig. 5B). Cluster FG1 includes the samples from 70 to 282 cm exclusively found in lithological unit G (Fig. 3B). All other samples belong to cluster FG2 (1–67 cm) and correspond to the upper part of the core containing coral fragments. The cluster coincides with lithological units P and T (Fig. 3B).
By increasing the similarity (44%), three assemblages (FG1A, FG1B and FG2) (Fig. 5A) are highlighted. This procedure allows to split cluster FG1 into cluster FG1A and FG1B. Samples from cluster FG1B consist of eight transitional samples found in dropstone layer L4 (70–91 cm) just below the coral facies (cluster FG2), two samples (133 and 136 cm) from IRD layer L3 and three other samples (106, 121 and 199 cm) distributed along lithological unit G.
At 57% of Bray–Curties Similarity the dendrogram (Fig. 5A) displaysfive clusters (FG1A1, FG1A2, FG1B1, FG1B2 and FG2). At this level the dissimilarity between the clusters is lower but still in agreement with the SIMPROF test and thus clearly statistically significant. Furthermore, compared to the (dis-)similarity between clusters in core POS391 559/2 (Appendix 2;Fig. 4A), a value of 57%
similarity points out considerably larger differences. The nMDS plot (Fig. 5B) shows also the ordination of the samples using a low stress value of 0.06 and the affiliation to their respective assemblages.
The samples (187, 226–250 and 259–282 cm) belong to cluster FG1A1 and correspond to the lower part of the core (Figs. 5and7).
All samples from cluster FG1A1 (except sample 187 cm) represent almost continuously the lowest part of the glaciomarine sediments (G), except for sample 253 cm belonging to FG1A2 (Fig. 7). In this assemblage ten species contribute the 91.7% of the average similarity. Assemblage FG1A1 is dominated by C. reniforme and E. excavatumf.clavata. Elphidium incertumis considered as a major associated species (Appendix 4; Fig. 5). Cluster FG1A2 groups samples covering the largest part of lithological unit G (94–103, 109–118, 124–130, 139–196, 202–223 and 253 cm). Thirteen spe- cies account for 90.2% of the average similarity. This assemblage is largely dominated byC. reniforme. Elphidium excavatumf.clavatais the major accessory species together with the less contributing species N. labradorica, C. ungerianus and E. incertum. In cluster FG1B1 are found samples preceding those from the coral facies (70–79), one sample (133) from the upper part of IRD layer L3 and sample 199 cm (Fig. 7). Fourteen species represent 90.3% of the average similarity of this assemblage largely dominated by C. reniforme followed by the accessory species N. labradorica, C. pachydermaandC. ungerianus. Cluster FG1B2 includes samples from the lower part of IRD layer L4 (82–91) and L3 (136) as well as scattered samples from lithological unit G (106 and 121 cm). Only twelve species account for up to 91.4% of the average similarity (Appendix 2).Cassidulina reniformeshows the highest contribution within this assemblage whileE. excavatum f.clavata,E. incertum andN. labradoricaare the principal accessory species. Cluster FG2 keeps unchanged at all the three (dis-)similarity levels and groups the samples (1–67) from the coral facies (Fig. 7). Thirty-one species account for 90.4% of the average similarity of this