Publisher’s version / Version de l'éditeur:
Transportation Research Record, 2044, 11, pp. 96-104, 2008-10-10
READ THESE TERMS AND CONDITIONS CAREFULLY BEFORE USING THIS WEBSITE.
https://nrc-publications.canada.ca/eng/copyright
Vous avez des questions? Nous pouvons vous aider. Pour communiquer directement avec un auteur, consultez la
première page de la revue dans laquelle son article a été publié afin de trouver ses coordonnées. Si vous n’arrivez pas à les repérer, communiquez avec nous à [email protected].
Questions? Contact the NRC Publications Archive team at
[email protected]. If you wish to email the authors directly, please see the first page of the publication for their contact information.
This publication could be one of several versions: author’s original, accepted manuscript or the publisher’s version. / La version de cette publication peut être l’une des suivantes : la version prépublication de l’auteur, la version acceptée du manuscrit ou la version de l’éditeur.
For the publisher’s version, please access the DOI link below./ Pour consulter la version de l’éditeur, utilisez le lien DOI ci-dessous.
https://doi.org/10.3141/2044-11
Access and use of this website and the material on it are subject to the Terms and Conditions set forth at
Effect of bituminous material rheology on adhesion
Al-Qadi, I. L.; Fini, E. H.; Masson, J-F.; McGhee, K. M.
https://publications-cnrc.canada.ca/fra/droits
L’accès à ce site Web et l’utilisation de son contenu sont assujettis aux conditions présentées dans le site LISEZ CES CONDITIONS ATTENTIVEMENT AVANT D’UTILISER CE SITE WEB.
NRC Publications Record / Notice d'Archives des publications de CNRC:
https://nrc-publications.canada.ca/eng/view/object/?id=6ced7170-22ef-4e66-afab-f12443916b05 https://publications-cnrc.canada.ca/fra/voir/objet/?id=6ced7170-22ef-4e66-afab-f12443916b05
http://irc.nrc-cnrc.gc.ca
E f f e c t o f b i t u m i n o u s m a t e r i a l r h e o l o g y o n
a d h e s i o n
N R C C - 5 0 8 3 3
A l - Q u a d i , I ; F i n i , E . H . ; M a s s o n , J - F . ; M c G h e e , K . M .2008-10-01
A version of this document is published in / Une version de ce document se trouve dans:
Transportation Research Record, v. 2044, no. 11, 2008
The material in this document is covered by the provisions of the Copyright Act, by Canadian laws, policies, regulations and international agreements. Such provisions serve to identify the information source and, in specific instances, to prohibit reproduction of materials without written permission. For more information visit http://laws.justice.gc.ca/en/showtdm/cs/C-42
Les renseignements dans ce document sont protégés par la Loi sur le droit d'auteur, par les lois, les politiques et les règlements du Canada et des accords internationaux. Ces dispositions permettent d'identifier la source de l'information et, dans certains cas, d'interdire la copie de documents sans permission écrite. Pour obtenir de plus amples renseignements : http://lois.justice.gc.ca/fr/showtdm/cs/C-42
Effect of Bituminous Material Rheology on Its
Adhesion
Imad L. Al-Qadi, Eli. H. Fini, J-F. Masson and
Kevin M. McGhee
Illinois Center for Transportation
www.ict.uiuc.edu
Transportation Research Board
87th Annual Meeting
January 13-17, 2008
Washington, D.C.
Duplication for publication or sale is strictly prohibited without
prior written permission of the Transportation Research Board.
Effect of Bituminous Material Rheology on Its
Adhesion
Imad L. Al-Qadi
Founder Professor of Engineering Illinois Center for Transportation, Director University of Illinois at Urbana-Champaign 205 N. Mathews Ave., MC-250, Urbana, IL 61801
e-mail: [email protected]
Eli. H. Fini
Graduate Research Assistant
Advanced Transportation Research and Engineering Laboratory Department of Civil and Environmental Engineering
University of Illinois at Urbana-Champaign 1611 Titan Dr., Rantoul, IL 61866
e-mail: [email protected]
J-F. Masson Senior Research Officer Institute for Research in Construction National Research Council of Canada
Ottawa, ON, Canada, K1A 0R6 e-mail: [email protected]
Kevin M. McGhee Senior Research Scientist
Virginia Transportation Research Council, VDOT Charlottesville, VA 22903
ABSTRACT
Bituminous materials are used in many civil engineering applications where adhesion to a substrate is essential for good performance. Yet, it is not possible to predict the adhesion strength of these materials. The particular case of bituminous crack sealants is of interest in this paper, where the effect of sealant viscosity, aging, test temperature and loading rates are investigated by means of a blister test. This test provides the bonding
characteristics to a model aggregate in terms of interfacial fracture energy (IFE). From the testing of several sealants, it was found that pouring viscosity affects adhesion and that higher viscosities help to attain higher IFEs. Temperature was found to play a key role on bonding characteristics and failure mechanism because it affects the viscoelastic properties of the sealant. In other words, the glass transition temperature (Tg) was found to have a governing role on bonding characteristics. At temperatures above Tg, bond strength was found to be affected by sealant flow such that failure is flow related, i.e., cohesive failure prevails. At temperatures below the Tg, where sealants are stiff and bulk deformation is low, stress is directed towards the interface so that failure tends to be adhesive. In taking into account temperature and test rates, an IFE master curve was obtained for a sealant. Such curve may be used in predicting and comparing sealant IFE.
Keywords: adhesion, asphalt, bitumen, binders, blister test, bonding, interfacial fracture energy, sealants, time-temperature superposition, viscosity, WLF.
Al-Qadi, Fini, Masson, McGhee 2
INTRODUCTION
Bitumen and bituminous materials are important engineering materials, with more than one hundred uses (1). In most applications, waterproofing and adhesion are key material characteristics; hence, many studies have dealt with the adhesion of bituminous materials (2-14), including the compatibility between bitumen and aggregates in hot-mix asphalt (HMA) (4-5), and the effect of water on the bitumen-aggregate bond in HMA
(7-10). The ultimate goal is to predict the adhesion of the bituminous material to the
substrate, such as HMA, aggregates, or model aggregates as glass or aluminum (2,
10-11).
Given the importance of pavement maintenance and the emphasis to extend the service life of aging roadways, efforts have been directed towards better understanding crack sealing and bituminous crack sealants, including characterization their adhesion in sub-zero temperatures (12, 13). Sealants are complex mixtures (3) for which adhesion has been related to viscosity or temperature (11, 12, 13, 15); but given the few sealants studied, it is generally impossible to predict sealant adhesion.
In an effort to expand the knowledge of the factors that affect bituminous crack sealants adhesion and help predict their adhesion to aggregates, the effect of temperature, viscosity, and sealant composition on adhesion has been investigated, along with the effects of aging, and test rate. It was found that sealant rheology, that is, viscosity and stiffness, govern sealant adhesion and that a newly developed blister test (2) allows for an unprecedented characterization of the adhesion behavior of the materials, and that the development of adhesion master curves may be useful predictive tool.
EXPERIMENTAL Materials and methods
Three bitumens (asphalt binders) and eight bituminous sealants were studied. The binders were graded as PG 64-22, PG 58-28, and PG 70-22. The sealants were purported to meet the ASTM D6690 specifications. Table 1 shows some characteristics, including the glass transition temperature (Tg) measured with a Mettler Toledo DSC821e differential
scanning calorimeter. The Tg was taken as the mid-point of the change in heat capacity (16) upon heating from –150°C to 150°C at 10°C/min in an 80mL/min flow of nitrogen.
Sealant viscosity was measured from 140°C to 200°C in steps of 10°C by means of a Brookfield Thermocel viscometer equipped with an SC4-27 spindle rotated at 60 rpm (17). Sealant aging was done in vacuum at 115°C for 16h, the details of this aging method are to be provided in another publication.
Sealant composition
The concentration of styrene-butadiene (SB) copolymer in sealants was measured by infrared spectroscopy (18). The polybutadiene band at 966 cm-1 and the polystyrene band at 699 cm-1 (3) were used to calculate that concentration.
The concentration of ground tire rubber (GTR) in sealants was measured after a combination of solvent extraction and pyrolysis. In a first step, 1g of sealant was
extracted with trichloroethylene on a Soxhlet extractor (19). After drying and weighing, the insoluble material was burnt in a muffle furnace at 620°C. From the calcium oxide residue, the content of calcium carbonate filler and GTR was calculated.
Table 1. Characteristics of bituminous sealants. Penetration Flow Resilience Tg ID 25°C
(dmm)
60°C (mm)
25°C °C
AE N/A N/A N/A –68
BB 148 0 80 –54 DD 80 1.5 50 –20 EE 47 0 51 –76 MM 120 1 70 –54 NN 75 0 70 –60 PP 130 1 44 –78 QQ 22 0 36 –53 UU 62 1.5 N/A –30
VV N/A N/A N/A –31
WW N/A N/A N/A –63
YY 42 N/A N/A –38
ZZ 42 N/A N/A –27
Blister test
The bond between the bituminous materials and aluminum, a normalized aggregate surface, was measured by means of a blister test (2). In this test, a piston, moving at a constant rate, forces a liquid (alcohol) through an orifice in the substrate. Pressurized alcohol pushes bituminous sealant away from its aluminum counterpart. As the material blisters under the action of the pressurized liquid, the pressure and the blister height are monitored over time. In this study, the orifice radius, a, was 12.5mm, the sample thickness, h, was 4.7mm, and the Poisson ratio, v, was taken as 0.35 (2). The tests were conducted at 8°C, 2°C, –4°C, –10°C, –16°C, –22°C, –28°C, –34°C, and –40°C. Not all sealants were tested at all temperatures; because many sealants tend to fail cohesively at relatively extreme temperatures. Binders were tested at 5°C and 10°C only. The load rate (piston motion) was 0.1mm/s, unless stated otherwise, which translated into a liquid flow rate of 0.1L/h (2).
RESULTS AND DISCUSSION Blister testing
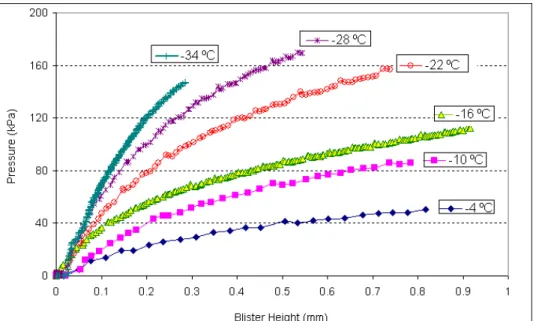
Typical test results of sealant blistering prior to adhesion are shown in Figure 1. At any given temperature, the height of the blister increases with pressure. The slope rises with cooling as sealant stiffness increases; but the pressure-height relationship is never linear, although it approaches linearity at the lowest temperatures. The curves typically show three stages, at –16°C for instance, the pressure increases linearly and most steeply below a 0.1mm deformation, before pressure slowly levels down to a steady-state regime
beyond a deformation near 0.5mm. This progression is typical of viscoelastic materials, for which deformation is in turn elastic (glass-like), viscoelastic and finally viscous (liquid-like). At –34 °C, the initial slope is higher and longer, which demonstrates that the elastic glass-like response dominates the low temperature behavior.
Al-Qadi, Fini, Masson, McGhee 4
The data in Figure 1 are reminiscent of those obtained from the tensile testing of polymers at various temperatures and for which the modulus is plotted against
deformation (20). It follows that the pressure data in Figure 1 can be converted to modulus by means of Equation 1 (2).
) ( ) ( ) ( ] 7 . 1 ) 1 ( 3 . 5 ) 1 ( [ ) ( ) ( ) ( 2 3 4 2 t d t p g f h a v h a v t d t p t E = − + + = (1)
where E (t) is the modulus at time t, p(t) is the pressure, d(t) is the blister height, v is the Poisson ratio, a is radius of the orifice in the substrate, and h is the material thickness. A geometric function, f(g), along with pressure and blister height thus define the modulus.
FIGURE 1 Pressure-height results from a blister test on a sealant. Figure 1 shows the change in blister height at short times. At longer times, however, deformation and pressure reach a maximum before they starts to decrease (Figure 2). Around the maximum, adhesive failure occurs at the interface between the bituminous material and the substrate. At failure, the pressure starts to decrease, and the blister starts to grow horizontally, while continuing its vertical growth.
From the E(t) and p(t) of Equation 1 taken at the maximum pressure (Figure 2), knowing the geometry of the specimen, the energy spent in debonding the material from the substrate, can be obtained. This is also known as the interfacial fracture energy (IFE), which is calculated using Equation 2 (2). The IFE can be used to assess the effect of various parameters on bonding characteristics. In this respect, the effect of pouring viscosity, aging due to heat, test temperature, and test rate are described next.
FIGURE 2 Blister test results with bulging followed by debonding after a pressure threshold.
]
)
1
(
2
10
)
1
(
3
32
)
1
(
3
[
)
(
)
(
2 3 2 3 2π
v
h
v
a
h
v
a
t
E
a
t
p
IFE
=
−
+
+
+
−
(2)Viscosity, sealant composition, and bonding characteristics
During installation, sealants are heated to a liquid state so that they can be poured into joints or cracks of irregular profile. The higher the heating temperature, the more liquid the sealant becomes. Consequently, installation crews sometimes have a tendency to use higher temperatures to achieve a greater production rate; but the effect of temperature is material dependent. A 10°C change in temperature, for instance, causes a change of 2% to 35% in viscosity (17). The more liquid sealant may also more easily wet the irregular crack surface (15) and provide a better bond (11); but the higher temperature required to achieve the lower viscosity can degrade the sealant and affect its elasticity (21). The temperature and the viscosity of sealants during installation thus affect performance, but few researchers have investigated this relationship (11).
The viscosity of seven sealants was measured at 140 °C to 200 °C (Figure 3). As expected, the viscosity decreased with a rise in temperature. Viscosity being a complex function of composition, not all sealants showed the same trend, although all sealants showed a non-linear decrease of viscosity with a rise in temperature. As will be discussed below, viscosity affects bonding characteristics; but a short digression on the effect of composition on viscosity is instructive.
In polymer modified bitumen, a rise in polymer concentration or an increase in polymer molecular weight (i.e., chain length) promote viscosity (22) because of chain entanglement (23). In rubber asphalt, the swelling of GTR with asphalt oils (24), imparts elasticity and raises viscosity (25). Given that bituminous sealants can contain a styrene-butadiene (SB)-type copolymer, ground-tire rubber (GTR), or both (3), sealants can be viscous due to both polymer and GTR.
Al-Qadi, Fini, Masson, McGhee 6 0 2 4 6 8 10 140 150 160 170 180 190 200 210 Temperature (oC) V isc o s it y (Pa .s ) AD AE WW YY NN QQ DD
FIGURE 3 Effect of temperature on sealant viscosity.
Simple rheological fluids show a linear (i.e., Arrhenius) relationship in plots of log viscosity vs 1/T (26). For sealants, such representation reveals that sealants DD, QQ and YY are complex fluids, as shown by the curved dotted lines in Figure 4. In contrast, sealants AD, AE, WW, and NN are simple rheological fluids as shown by the lines of constant slope. These sealants thus contained little gelled, cross-linked, material like swollen GTR that would prevent simple flow. The data on sealant composition in Table 2 show that this is the case. Another indication of relative composition is the viscosity itself. Sealants AD, AE and WW had a much lower viscosity than the other sealants (Figure 3). At 180°C (1/T =0.0022), for instance, they had viscosities near 2Pa.s, or lower, whereas the sealant DD did not become so fluid until 200°C (1/T =0.0021), and the other sealants never reached that fluidity.
0.1 1 10 0.0021 0.0022 0.0023 0.0024 0.0025 1/T (K) V is c os it y (P a. s ) AD AE WW YY NN QQ DD
FIGURE 4 Arrhenius representation of the effect of temperature on sealant viscosity
Table 2 shows that sealant AD had a high content of mineral filler, 19%, and yet the lowest viscosity. This suggests that fillers play a minor role in the viscosity of sealants. Despite its low viscosity, sealant AD surprisingly had the highest polymer content, 8.1%. Given that it is the entanglement of long polymer chains that raise viscosity, the low viscosity of sealant AD indicated that it contained a polymer of low molecular weight with little capacity for entanglements and viscosity enhancement.
Overall, the viscosity of the sealants correlated best with the content of GTR (Table 2). Sealants DD, QQ and YY displayed the highest viscosities (Figure 3) and the highest GTR contents. Obviously, the SB copolymer and its molecular weight also play a role. Sealant QQ, for instance, shows a viscosity higher than sealant DD, yet its
concentration in GTR and SB was only half as high. This demonstrated that the molecular weight of the polymer in QQ was greater than that in DD.
TABLE 2 Viscosity of some sealants and their composition AD AE WW DD QQ YY NN Viscosity*, Pa.s 0.6 1.9 2.8 4.5 5.9 6.9 8.6 Filler (mass %) 19 ND 3.1 10 2.5 4 ND SB§(mass %) 8.1 ND 5.9 6.8 3.5 1.4 ND GTR†(mass %) 0 ND 3 18 9 24 ND GTR + SB 8.1 ND 8.9 24.8 12.5 25.4 ND * At 180°C. §
Styrene-butadiene-type copolymer. †Ground tire rubber. ND: not determined
To investigate the principal topic of interest in this section, the effect of viscosity on the interfacial bonding energy, the sealants were poured at two temperatures on the aluminum substrate used for the blister test. The highest temperature of 200°C provided for the lowest viscosity. A lower temperature was selected as to provide a viscosity at least 1Pa.s higher than at 200°C; but never higher than 3Pa.s (Table 3).
TABLE 3 Pouring viscosity (Pa.s) before the blister test Temperature, °C Sealant 140 170 180 190 200 Δη AD 2.1 0.4 1.7 AE 2.3 1.2 1.1 WW 2.6 1.5 1.1 DD 4.2 2.1 2.1 YY 7 4 3 NN 6.1 4.7 1.4 QQ 5.1 3.4 1.7 Δη: Viscosity difference
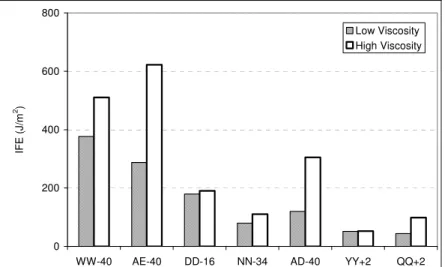
The effect of viscosity on sealant IFE is shown in Figure 5. Without exception, the higher viscosity provided for a greater IFE. These results contrast with the result of Svec et al. (11) who poured one sealant at two viscosities in an HMA rout and measured
Al-Qadi, Fini, Masson, McGhee 8
a better adhesion at the lower viscosity. These combined results indicate that a low-viscosity sealant can develop a good bond with a rough surface, by interlocking within the surface pores (15, 27); but that once wetting of the surface is ascertained (as with the smooth aluminum substrate), high-viscosity sealants show a better bond. This clearly demonstrates that sealant bulk properties play a key role on the structure and strength of the interface, which is consistent with the viscoelastic response of adhesives (28).
0 200 400 600 800
WW-40 AE-40 DD-16 NN-34 AD-40 YY+2 QQ+2
IF E ( J /m 2) Low Viscosity High Viscosity
FIGURE 5 Interfacial fracture energy at 2°C to –40°C after pouring sealants at high and low viscosities.
Effect of aging on bonding characteristics
Sealants are installed hot and liquid so that they can follow irregular crack profiles. However, excessive temperature and long heating times can degrade the sealant and affect its properties (21). In practice, an aged sealant is always installed, and it ages further in service due to weathering. It was thus of interest to briefly investigate the effect of aging on bonding characteristics.
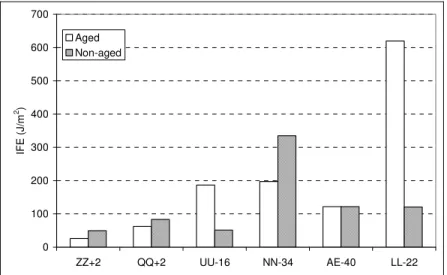
Figure 6 shows the effect of aging on the IFE of six sealants tested between +2 and –40°C. Three sealants showed lower IFE upon aging, two sealants showed a greater bond, and one sealant was unaffected. This trend is consistent with the effect of aging on the tensile strength (21) in that it indicates that aging is material specific. In some cases, stiffening occurs, whereas in other cases softening prevails. Aging thus affect sealant properties, including adhesion, differently based on composition.
Effect of temperature on bonding characteristics
Sealants have unique compositions and rheology. In cold temperatures, some sealants are flexible, some others are rigid, and others yet, semi-rigid. The data in Figure 6 showed IFE values for sealants at a single temperature, selected such that a fairly flexible state was maintained. To better define the effect of temperature on the IFE, sealants were tested at another temperature, along with three PG binders.
The effect of temperature on the IFE is shown in Figure 7, where the labels appended with an “A” indicate an aged material. Two trends are conspicuous. Figure 7-a shows that the binders and some sealants initially had a low IFE that increased with cooling. These results are consistent with those in Figure 5; a stiffer sealant shows greater
IFE. In contrast, some sealants initially showed a very high IFE that was lowered by cooling, as shown in Figure 7-b. Given that all sealants became stiffer upon cooling; this lowering of the IFE may be an indication of a viscoelastic transition in the bituminous material, as it is the case with polymeric adhesives (28).
0 100 200 300 400 500 600 700 ZZ+2 QQ+2 UU-16 NN-34 AE-40 LL-22 IFE ( J /m 2) Aged Non-aged
FIGURE 6 Interfacial fracture energy of aged and non-aged sealants. The conjugation of the data in Figure 7 and Table 1 reveal that materials with an initially low IFE that increases upon cooling generally had a Tg at –30°C or higher, and that sealants with a high initial IFE that decreases upon cooling had a Tg below –60 °C. With the Tg of bitumens usually between –5 and –30°C (29), and that of the butadiene unit of SB copolymers near –90 °C (3), the disparity in Tgs is an indication of relative copolymer concentration. The greater is the SB concentration; the lower is the Tg of the mixed polymer-bitumen phase (30). The lower Tg indicates that the sealant matrix is rich in polymer. At a concentration greater than about 5%, a continuous polymer matrix and dispersed bitumen phase is obtained. A polymer concentration in excess of 5% was confirmed by FTIR (Table 4). Interestingly, a low Tg enhances sealant field performance (3).
TABLE 2 Copolymer concentration in sealants vs IFE trends in Figure 7. Rising IFE SBS, wt % Dropping IFE SBS, wt %
QQ NA AE 8.9
UU 3.5 LL 12.2
VV NA NN 6.2
ZZ NA PP 5.8
NA Not assessed
Effect of temperature and loading rate
The above section revealed that material composition and Tg affect bonding. Given that Tg is frequency and rate dependent (31), it may be expected that blister test results on bituminous materials would be rate dependent, like those for adhesives (28). To
investigate this possibility, sealant UU was used, as it could readily be tested over a wide range of temperatures, –4ºC to –34 ºC.
Al-Qadi, Fini, Masson, McGhee 10 0 40 80 120 160 200 10 8 5 2 -4 -10 -16 Temperature (ºC) IFE (J/m 2) UUA VVA ZZA QQA PG 64-22 PG 70-22 PG 58-28 (a) 0 200 400 600 800 1000 1200 1400 -16 -22 -28 -34 -40 Temperature (ºC) IFE (J/m 2 ) AEA PPA NNA LLA (b)
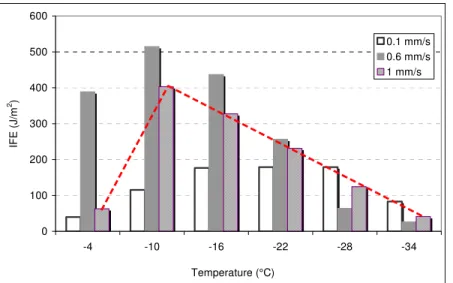
FIGURE 7 IFE at peak pressure for sealants adhered to aluminum. Figure 8 shows the IFE for sealant UU upon the application of loading rates of 0.1mm/s, 0.6mm/s, and 1mm/s at six temperatures. The results are sibyl to the combined trends in Figure 7. At all rates, the IFE first increased with cooling, before it started to decrease. The trend is highlighted with a dotted line for the IFE obtained at 1mm/s. The slower rate led to a more gradual trend and to the lower temperature at which the trend reversal was observed. It occurred near –28°C at 0.1mm/s, in good agreement with the middle of the Tg for this sealant at –30°C (Table 1).
Figure 8 also shows that the IFE is as affected by rate as it affected by
temperature. At each temperature down to –22 °C, the IFE increased before it decreased. Starting at –28°C, however, the trend changed. This may be related to the Tg of this sealant at –30 °C.
0 100 200 300 400 500 600 -4 -10 -16 -22 -28 -34 Temperature (°C) IFE (J/m 2) 0.1 mm/s 0.6 mm/s 1 mm/s
FIGURE 8 Interfacial fracture energy for sealant UU as a function of temperature and test rate.
Working on polymers, William, Landel, and Ferry related temperature and rate in an elegant fashion to produce a modulus master curve where data at one temperature could be shifted to fit naturally with data obtained at another temperature, thus providing a much improved perspective on the effect of temperature, or rate, on modulus and its change at Tg (31). To normalize the data with respect to the glass transition, a shift factor,
aT, was calculated with the WLF equation (Equation 3). ) ( 6 . 51 / ) ( 4 . 17 g g T T T T T a Log = − + − (3)
where T is the test temperature of the viscoelastic material. The WLF equation is restricted in its use to viscoelastic materials tested above their Tg so it does not hold for glassy or crystalline materials.
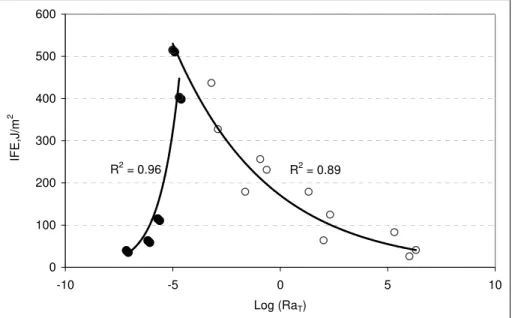
Adhesives being polymers above their Tg, the WLF equation was applied to the study of polymer adhesion onto rigid substrates (28). Bituminous materials being viscoelastic adhesives, the WLF equation is also of interest to normalize the IFE in Figure 8 with respect to Tg. The result of this normalization is a master curve as shown in Figure 9, where RaT is the effective test rate.
The adhesion master curve in Figure 9 retains the duel trends observed in Figure 8 where the IFE increases before it decreases. The master curve allows for a rheological interpretation of these trends. At low rates, viscoelastic materials show liquid-rubbery behaviour, whereas at high rates they show stiffer, if not glassy, behaviour (31). In the case of sealant UU, the divide between the two behaviours is the maximum IFE near 515 J/m2, which represents the rubbery-glassy transition, i.e., the Tg.
Figure 9 shows that IFE is reduced as the sealant is tested away from its glass transition. At low rates, or high temperatures, adhesion is reduced as liquid behaviour becomes prevalent, that is because liquid deformation expends little energy; to the extend that at relatively high temperatures or low loading rates, failures become cohesive as the material tends to fail by coming apart. In contrast, as the rate increases, or
Al-Qadi, Fini, Masson, McGhee 12
deformation because it is stiffer. In this case, energy is spent at the interface and failure tends to be adhesive.
The master curve in Figure 9 indicate that in practice sealant failure is cohesive at high and moderate temperatures, whereas it is adhesive at low winter temperatures. Field observations have demonstrated the prevalence adhesive failure (32, 33). Consequently, the Tg of sealants is often too high. To help select sealants with proper adhesion, the comparison of IFE master curves from representative rates and temperatures would be advantageous. R2 = 0.96 R2 = 0.89 0 100 200 300 400 500 600 -10 -5 0 5 10 Log (RaT) IFE,J/m 2
FIGURE 9 IFE versus reduced rate for sealant UU on aluminum.
CONCLUSION
Bituminous materials often fail in adhesion during winter. This is especially true of bituminous sealants applied to roadway cracks and joints. In an effort to better understand the nature of this failure, the effect of viscosity, aging, temperature and strain rate on the interfacial fracture energy (IFE) of bituminous sealants and binders were measured by means of a blister test. The substrate was a normalized model aggregate, namely, smooth aluminum.
When sealants were poured at a high and a low viscosity, the higher viscosity always led to a stronger bond. This indicated that in the absence of interfacial defects, the sealant bulk properties play a key role on the interfacial strength. Of particular
importance in this respect was the content of rubbery material, namely, ground tire rubber (GTR) and SB copolymer. Aging, which modifies viscosity, also affected the bonding; but given that aging was material specific, no trend emerged between bonding
characteristics and aging.
After the measure of IFE at various temperatures and rates, and the time-temperature superposition of the results into a master curve, the effective viscoelastic properties of the sealants were found to play a determining role on bonding and the mechanism of interfacial failure. In conditions where the material is in a liquid-rubbery state, above the glass transition temperature (Tg), IFE shows an increasing trend with
loading rate; which shows bulk property is dominant. At very low loading rate, failure tends to be cohesive. However, failure tends to be adhesive when the material is stiff, below the Tg. Sealants with a low Tg, below –60°C because of high polymer content, were found to have the highest IFE when tested in sub-zero temperatures.
The benefit of this study is in being able to predict sealant bonding under realistic field conditions. With the combination of loading rates and temperatures expected in service, sealant users could determine and compare the IFE of various products. Alternatively, sealant producers could generate IFE master curves to better identify the conditions under which a particular sealant would perform well.
ACKNOWLEDGMENTS
The authors thank Peter Collins and Maria Veitch for their respective quantification of SB-copolymer and GTR contents in sealants. Funding was provided by the Federal Highway Administration "pooled-fund study TPF5 (045)" and the Canada-US Crack Sealant Consortium. The contribution of the participating states, industry, and provinces is acknowledged. The contents of this paper reflect the view of the authors who are responsible for the facts and the accuracy of the data presented herein. The content does not necessarily reflect the official views or policies of the pool-fund participating Departments of
Transportation or the Federal Highway Administration. This paper does not constitute a standard, specification, or regulation.
REFERENCES
1. Anonymous, The Asphalt Handbook, Manual Series No. 4 (MS-4), Asphalt
Institute, Lexington, 1989.
2. Fini, E., I. L. Al-Qadi, and J-F. Masson. A New Blister Test to Measure Bond Strength of Asphaltic Materials. Association of Asphalt Paving Technology
(AAPT) Journal, Vol. 76, 2007, pp. 275–302.
3. Masson, J-F, P. Collins, J. Margeson, and G. Polomark. Analysis of Bituminous Crack Sealant by Physicochemical Methods. In Transportation Research Record:
Journal of the Transportation Research Board, No. 1795, TRB, National
Research Council, Washington, D.C., 2002, pp. 33–39.
4. Anderson, D. A. Binder Characterization and Evaluation, Vol. 3: Physical Characterization. SHRP-A-369, Strategic Highway Research Program, Washington, D.C., 1994.
5. Bhasin, A., E. Masad, D. Little, and R. L. Lytton. Limits on Adhesive Bond Energy for Improved Resistance of Hot-Mix Asphalt to Moisture Damage. In
Transportation Research Record: Journal of the Transportation Research Board,
No. 1970, TRB, National Research Council, Washington, D.C., 2006, pp. 3–13.
6. Fini, E., I. L. Al-Qadi, and S. H. Dessouky. Adhesion of Hot-Poured Crack
Sealant to Aggregate. Paper No. 2888, 85th Annual Meeting of the Transportation Research Board, Washington, D.C., 2006.
7. Hammons, M. I., H. Von Quintus, G. M. Geary, P. Y. Wu, and D. M. Jared. Detection of Stripping in Hot-Mix Asphalt. In Transportation Research Record:
Al-Qadi, Fini, Masson, McGhee 14
Journal of the Transportation Research Board, No. 1949, TRB, National
Research Council, Washington, D.C., 2006, pp. 20–31.
8. Lu, Q., and J. T. Harvey. Long-Term Effectiveness of Antistripping Additives: Laboratory Evaluation. In Transportation Research Record: Journal of the
Transportation Research Board No. 1970, TRB, National Research Council,
Washington, D.C., 2006, pp. 14–24.
9. Copeland, A., N. Kringos, A. Scarpas, and J. Youtcheff. Determination of Bond Strength as a Function of Moisture Content at the Aggregate-Mastic Interface. In Proceedings of 10th Conference of the International Society for Asphalt Pavement (ISAP), August, 2006, Quebec City, Canada.
10. Kanitpong, K., and H. U. Bahia. Relating Adhesion and Cohesion of Asphalts to Effect of Moisture on Asphalt Mixtures’ Laboratory Performance. In
Transportation Research Record: Journal of the Transportation Research Board,
No. 1901, TRB, National Research Council, Washington, D.C., 2005, pp. 33–43.
11. Svec, O. J., J. Kennepoh, and G. Ponniah. Development of Testing Pavement Crack Sealing Techniques, Proceedings of the Fifth International RILEM Symposium, Lyon, France, 1997, pp. 137–144.
12. Masson, J-F, and M. A. Lacasse. Effect of the Hot-Aired Lance on Crack Sealant Adhesion. Journal of Transportation Engineering, Vol. 125, No. 4, July/August 1999, pp. 357-363.
13. Zanzotto, L. Laboratory Testing of Crack Sealing Materials for Flexible Pavement. Transportation Association of Canada, Ottawa, ON, 1996.
14. Chehovits, J., and M. Manning. Materials and Methods for Sealing Cracks in Asphalt Concrete Pavements. In Transportation Research Record: Journal of the
Transportation Research Board, No. 990, TRB, National Research Council,
Washington, D.C., 1984, pp. 21–30.
15. Masson, J-F, and M. A. Lacasse. A Review of Adhesion Mechanisms at the Crack Sealant Asphalt Concrete Interface. In Proceedings of the 3rd International
Symposium on Durability of Building and Construction Sealants, A. Wolf, Ed., RILEM, Paris, 2000, pp. 259–274.
16. ASTM E1356 Standard Test Method for Assignment of the Glass Transition Temperatures by Differential Scanning Calorimetry. American Society for Testing and Materials.
17. Al-Qadi, I. L., E. Fini, M. A. Elseifi, and J-F. Masson. Procedure for Viscosity Determination of Hot-Poured Bituminous Sealants. In Transportation Research
Record: Journal of the Transportation Research Board, No. 1958, National
Research Council, Washington, D.C., 2006, pp. 74-81.
18. Masson, J-F., L. Pelletier, and P. Collins. Rapid FTIR Method for the
Quantification of Styrene-Butadiene Type Copolymer in Bitumen. Journal of
Applied Polymer Science, Vol. 79, No. 5, January 2001, pp. 1034-1041.
19. Vogel, A. I. Vogel’s Textbook of Practical Organic Chemistry. Longman Group, London, 5th edition, 1989.
20. Brostow, W., and Corneliussen, R. D. Failure of Plastics, Hanser Publishers, New York, 1986.
21. Masson, J-F., C. Lauzier, P. Collins, M. A. Lacasse. Sealant Degradation During Crack Sealing of Pavements. Journal of Materials in Civil Engineering, Vol. 10, No. 4, 1998, pp. 250-255.
22. Masson, J-F., P. Collins, G. Robertson, J. R. Woods, and G. Margeson,
Thermodynamics, Phase Diagrams, and Stability of Bitumen-Polymer Blends,
Energy & Fuels Vol. 17, 2003, pp. 714-724
23. Mark, J.E., A. Eisenberg, W.W. Graessley, E. T. Samulski, J L. Koenig, and G. D. Wignall, Physical Properties of Polymers, Chap. 3, American Chemical Society, Washington, 2nd Edition, 1993.
24. Airey, G. D., M. M Rahman, A. C. Collop, Absorption of Bitumen into Crumb Rubber Using the Basket Drainage Method. International Journal of Pavement
Engineering, Vol. 4, 2003, pp. 105-119.
25. Shen, J. and S. Amirkhanian. The Influence of Crumb Rubber Modifier (CRM) Microstructures on the High Temperature Properties of CRM binders.
International Journal of Pavement Engineering, Vol. 6, No. 4, December 2005,
pp. 265-271.
26. Mezger, T. G., The Rheology Handbook. Vincentz, Hannover, 2002.
27. Wu, S. Polymer Interface and Adhesion. Marcel Dekker, Inc. New York and Basel, 1982.
28. Gent, A. N., and R. P. Petrich. Adhesion of Viscoelastic Material to Rigid Substrates. In Proceeding of the Royal Society, A. 310, 1969, pp. 433-448.
29. Wada, Y., and H. Hirose. Glass Transition Phenomena and Rheological Properties of Petroleum Asphalt. Journal of the Physical Society of Japan, Vol. 15, No. 10, October 1960, pp. 1885-1894.
30. Masson, J-F., G. Polomark, and P. Collins. Glass Transitions and Amorphous Phases in SBS-bitumen Blends. Thermochimica Acta Vol. 435, 2005, pp. 96-100. 31. Ferry, J. D. Viscoelastic Properties of Polymers. Wiley, New York, 3rd Edition,
1980.
32. Evers, R.C. Evaluation of Crack Sealing Compounds for Asphaltic Pavements,
Project No. 33, Interim Report 3. Ministry of Transportation and Communications
of Ontario, Canada, 1983.
33. Masson, J-F., P. Collins, and P.-P. Légaré. Performance of Pavement Crack Sealants in Cold Urban Conditions. Canadian Journal of Civil Engineering, Vol. 26, No. 4, August 1999, pp. 395-401.