ACROSS PERMEABLE STRUCTURES:
COMPARISON BETWEEN THEORY AND
EXPERIMENT
byZhenya Zhu, Xiaoming Tang*, C.H. Cheng, and M.N. Toksoz Earth Resources Laboratory
Department of Earth, Atmospheric, and Planetary Sciences Massachusetts Institute of Technology
Cambridge, MA 02139 *NER Geoscience 1100 Crown Colony Drive
Quincy, MA 02169
ABSTRACT
The attenuation of borehole Stoneley waves across a permeable structure (e.g., frac-tures or fracture zone) is correlated with the permeability of the structure. Using a simplified Biot theory, the structure can be modelled as a permeable porous layer inter-secting the borehole. In order to study the effect of such a structure on Stoneley waves and to evaluate the theoretical model, we performed laboratory experiments using ul-trasonic borehole models. The porous layer model is made of fine-grained sands with high permeability and porosity. The experiments are carried out with three saturant fluids: water, alcohol, and glycerol. The iso-offset Stoneley waveforms are recorded by moving the source and receiver across the porous layer. In this way, robust estimates of Stoneley wave transmission coefficients are obtalned. The experimental transmission coefficients are compared with the theoretical coefficients calculated using the borehole and permeable zone parameters. There is good agreement between theoretical results and experimental results. For low viscosity fluid water and ethyl alcohol, the agree-ment is very good. For high viscosity fluid, glycerol, the agreeagree-ment is fair with the experimental Stoneley attenuation higher than the theoretical value.
INTRODUCTION
Permeable fractures in reservoirs are of major significance in assessing the fluid transport properties in the production of petroleum. Permeable fractures are also important in
waste disposal siting studies and in environmental geophysics, as well as ground water transport. Through field observations, Paillet (1980) was able to recognize the effect of fractures intersecting the borehole on full wave acoustic logging waveforms. The low frequency Stoneley waves are especially sensitive to the formation permeability and fluid transportation, and they have been used as important means in the detection and characterization of borehole fractures.
Paillet and White (1982) observed that the borehole Stoneley wave attenuates across permeable fractures. Hornby et al. (1989) showed that permeable fractures also give rise to reflected Stoneley waves. Theoretical studies (Stephen et aI., 1985; Tang, 1990; Kostek, 1991) have been carried out to model the effects of a borehole fracture. In all these models, the analogy of a parallel planar fluid layer was commonly adopted to represent the fracture. Although both the attenuation and the reflection of the Stoneley wave are predicted by the plane-fracture model, it takes a rather large fracture aperture (on the order of centimetres) to produce significant Stoneley wave attenuation. However, fractures with such apertures are rarely found in the field (Hornby et aI., 1989), but Stoneley wave attenuation of up to 50% or more across in situ fractures is commonly observed (Paillet, 1980; Hardin et aI., 1987). Paillet (1989) suggested that in situ fractures may consist of an array of low passages and that fracture permeability is not directly related to the apertures of a plane-parallel fracture. Tang and Cheng (1991) explicitly modeled the borehole fractures as a permeable porous zone, in which a simplified Biot-Rosenbaum theory (Tang et aI., 1991a) was used to calculate the effect of the porous zone. Using this model, they investigated the propagation of borehole Stoneley waves across a permeable fracture zone. The results show that strong Stoneley wave attenuation is produced across the permeable zone. Although the model seemed to explain some field data sets fairly well (Tang et aI., 1991b), its accuracy and validity have not been tested with a controlled experiment. Through laboratory experiments, Winkler (1989) verified the validity of the Biot-Rosenbaum theory of Stoneley wave propagation in a porous formation. The purpose of this study is to test the validity and applicability of the simplifled Biot-Rosenbaum theory of Tang et al. (1991a) to the modeling of Stoneley wave propagation across permeable fractures.
Laboratory experiments with fluid-filled plane fracture models were performed in recent years (Hornby et al., 1989; Giller and Toksoz, 1987; Poeter, 1987; Zlatev et aI., 1988). The attenuation of the Stoneley wave was measured using the ultrasonic models with horizontal or inclined fluid-filled fractures of various apertures. In these experi-ments, the acoustic source was fixed, and the receiver was moved across the fracture along the borehole. The array waveforms were recorded. It has been shown that the amplitude attenuation of waveforms is related to the apertures of the fractures. In the present study, the source and receiver spacing is fixed and the assembly is moved across the permeable zone. This geometry is adopted to simulate the iso-offset configuration in an acoustic logging measurement.
This study investigates the propagation of Stoneley waves across a permeable porous zone in an ultrasonic model. Parameters such as porosity, permeability, and P- and S-wave velocities of the material of the zone are independently measured. These parame-ters will be used in the theoretical model to calculate Stoneley wave propagation and the results will be compared with the experimental results. To perform the experiments, a pair of transducers for use in the ultrasonic model borehole are built using piezoelectric rings. The received waveforms are recorded with a digital oscilloscope to measure the effect of permeable zone. The transmission coefficient of the Stoneley wave across the fracture is calculated and is compared with the theoretical one. This comparison offers a test of the validity of the theory.
ULTRASONIC MODEL AND MEASUREMENT SYSTEM
In the previous ultrasonic borehole models with fracture (Hornby et aI., 1987), a hor-izontal fluid-filled gap was used to simulate the fracture. The primary interest of the present study is to model the fracture as a permeable zone sandwiched between two inpermeable solids.
To simulate the iso-offset downhole acoustic logging commonly used in the field, we have built a laboratory logging tool that consists of source and receiver transducers made from piezoelectric rings of small diameter. The source and receiver can move in the model borehole with fixed or variable spacing to measure· waveforms across the . permeable structure.
Ultrasonic Model
Quartz sands with grain diameters ranging from 0.5 to 0.8 mm are used to construct the synthetic porous permeable material. The sands are mixed with a low-viscosity glue (Ladd ultra-low viscosity enbedding medium #21220) at room temperature, and are shaped into cylinder and disk samples. The shaped samples are cured at 70°C temperature for 8 hours. The physical parameters of the samples are then measured and later used in the theoretical modelling.
The compressional and shear velocities are measured with the dry cylinder sample. They are 2510
mls
and 1420mis,
respectively. Then the sample is fully saturated with water. The weights of the sample before and after water saturation, and the weight of the sample suspended in water, are then measured. The densities of grain matrix and the water-saturated sample are 2.50glcm3 and 1.96glcm3, respectively. From the densities, the porosity of the sample is estimated to be 36.1%.
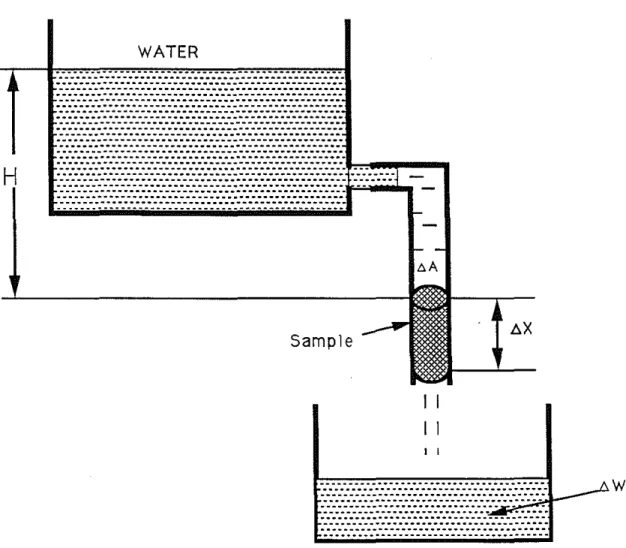
The permeability is measured by means of the steady-state flow method with the setup shown in· Figure 1. A constant pore pressure gradient is applied across the sample and the volume of fluidflowing through it per unit time is measured. The penneability K is given by Darcy's law:
(1)
where Jl, is the water viscosity (1.002 centipoise), t!>.A is the cross-sectional area of the sample, p the water density, t!>.W the mass of water flowing through the sample of length t!>.x in the time interval t!>.t, H the height difference of water surfaces shown in Figure 1, and9 is the gravitational acceleration (i.e., 980
ern/sec
2 ).In our experiment, the height difference was 19.6 cm, the water mass through the cylinder sample of diameter 3.15 cm and length 4.0 cm in the time interval of 90 seconds was 385 gram. Therefore, the penneability is estimated to be 126 darcy (l0-Sern2) for the synthetic porous material.
The man-made porous disk has a thickness of 1.15 cm. A borehole of 1 cm diameter was drilled at its center. The ultrasonic borehole model with a permeable structure was constructed by sandwiching the disk between two aluminum cylinders. The cylinders have an outer diameter of 20.3 cm and height of 15.2 cm. The center of the cylinder was drilled to make a borehole of 1cm diameter. The various parameters of the borehole model are given in Table 1.
Transducers
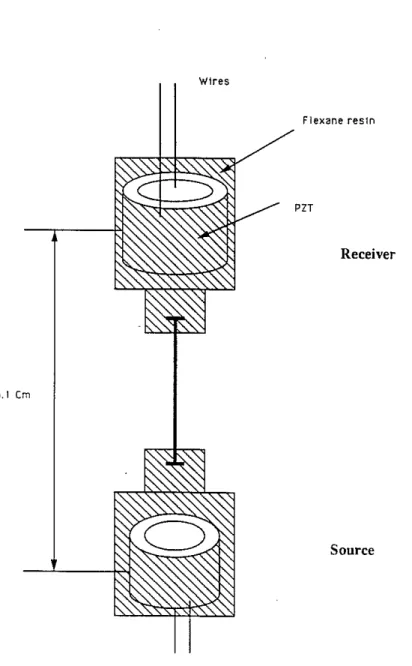
A pair of transducers, one source and one receiver, are made of piezoelectric rings. The rings have an outer radius of 0.35 cm, inner radius of 0.14 cm, and height of 0.7 cm. When excited by an electric pulse, the rings vibrate primarily in the radial direction. Each ring was sealed by silicon rubber (Flexane resin) to fonn a single transducer, which has a diameter of 0.83 cm. A downhole tool is assembled by connecting two single transducers with a flne steel wire (Figure 2). The distance between source and receiver is 6.1 cm. During the experiment, the assembly shown in Figure 2 is placed in the borehole model to simulate the iso-offset acoustic logging in the field.
The frequency response of a single transducer was measured in a water tank. The experiment shows that the transducer has good response down to 30 kHz. When placed in the borehole , the borehole will change the excited and received signals of the trans-ducers. Because the diameter of the tool is only slightly smaller than that of borehole (0.83 cm vs. 1 cm), the cut-off frequencies of the borehole pseudo-Rayleigh waves will be shifted to very high frequencies. Even at fairly high frequencies (up to 350 kHz), the received wavefonn consists primarily of Stoneley waves. Therefore, this design of ultrasonic transducers is especially suited for generating and receiving Stoneley waves.
Experimental Setup
The block diagram of the experimental setup is shown in Figure 3. A function generator produces a sync-trigger signal to activate a high-voltage pulse generator. The source is driven by a sharp pulse and emits acoustic waves in the fluid-filled borehole. The waves propagating along the borehole are received and converted into electrical signals by the receiver transducer. The signals are first amplified and filtered. Then the signals are digitized by a digital oscilloscope (Data Precision 6000). The digital waveforms are stored in an IBM/AT or transferred to the VAX 8800 for further analysis. The transduc-ers are mounted on a frame which can be moved step by step by a step motor controller along the borehole. The microseismograms can be recorded at different locations in the model borehole.
MEASUREMENTS IN THE MODEL
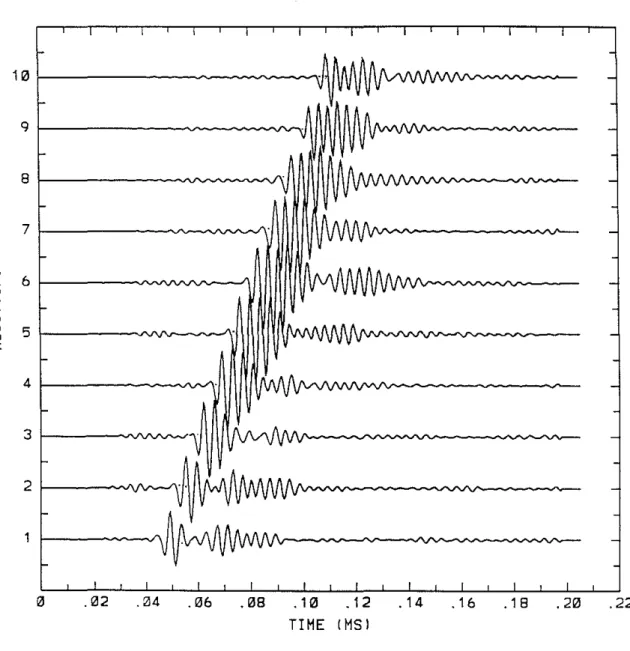
To test the ultrasonic measuring system, we performed the measurement in a homoge-neous aluminum model, using the variable source-receiver spacing configuration. Figure 4 shows the array waveforms obtained for this configuration.
The center frequency of the signals is about 250 kHz, which is above the cut-off frequency (about 170 kHz) of the first pseudo-Rayleigh mode for the fluid-filled 1 cm diameter aluminum borehole. However, because the borehole transducer has a diameter that is only slightly smaller than the borehole diameter, the pseudo-Rayleigh waves are not excited in this frequency range, and the received waves are dominated by Stoneley waves. This can be seen by measuring the moveout velocity of the waveforms, which is the Stoneley wave velocity (1450 m/s). The microseismograms also show that the other wave modes (such as P-Leaky modes) are suppressed by the transducer used.
The ultrasonic measurements were carried out to study the effect of the permeable layer on the Stoneley waves. To test the theoretical model, we use three saturant fluids with very different physical properties. They are water, ethyl alcohol and glycerol. The physical properties of these fluids are given in Table 2.
RESULTS AND DISCUSSION
From the recorded microseismograms, the average amplitude of Stoneley waves of each trace can be computed. This amplitude is calculated as the square root of the sum of the squared amplitudes of the waveforms. The plot of the amplitudes across the porous layer gives a robust estimate of the Stoneley wave transmission coefficient across the layer (Tang et aI., 1991b).
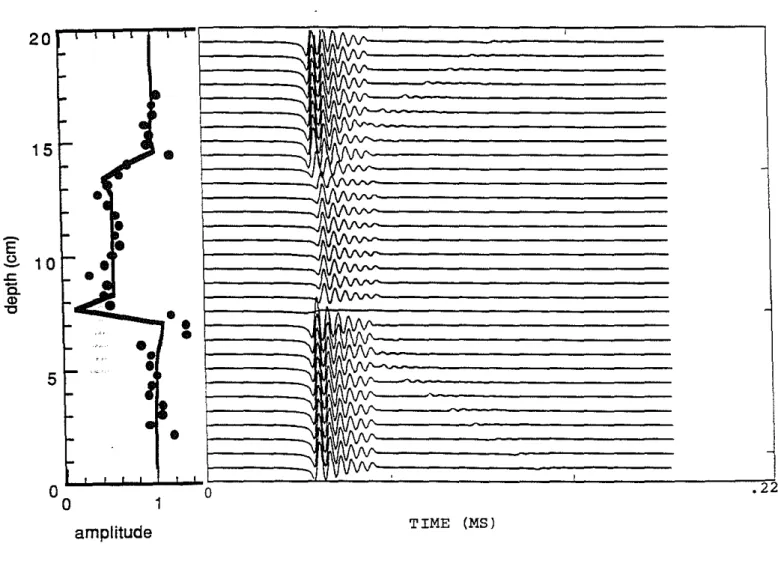
We first show the theoretical and experimental results for the water-saturated porous layer. Figure 5a shows the recorded iso-offset waveforms and the calculated wave ampli-tudes. The Stoneley waves propagate across the porous layer; the amplitudes are appre-ciably decreased by the layer, due to the dissipation of wave energy into the permeable layer. Figure 5b shows the theoretical modelling results. The results are calculated using the Tang and Cheng (1991) theory with the parameters given in Tables 1 and 2. The theory, together with a correction due to the finite vertical extent of the permeable zone, is described in the Appendix. The theoretical waveforms show the characteristic amplitude decrease across the permeable zone, as we have seen in Figure 5a. In addition, there are reflected waves generated by the zone. However, the reflected waves cannot be measured with the transducers shown in Figure 1, because the small fluid annulus at the receiver will cause the generated (small) reflection events to be largely reflected away from the receiver. Therefore, we can only rely on the transmitted waves. The amplitude log at the edges of the anomaly is considerably smaller than in the central part of the anomaly. This is also true for the following two examples. This happens when either the source or receiver is within the permeable zone. Because the zone is much softer than the surrounding (aluminum) model, the excited (or received) waves are much weaker than when the source or receiver is outside the zone. Therefore, only the central part of the amplitude anomaly is used to measure the transmitted amplitude, from which the transmission coefficient is calculated as the ratio of the transmitted amplitude over the incident amplitude. The comparison between the theoretical transmission coefficient and the experimental coefficient obtained for the frequency of measurement is shown in Figure 5a for the water-saturated case. The agreement is excellent.
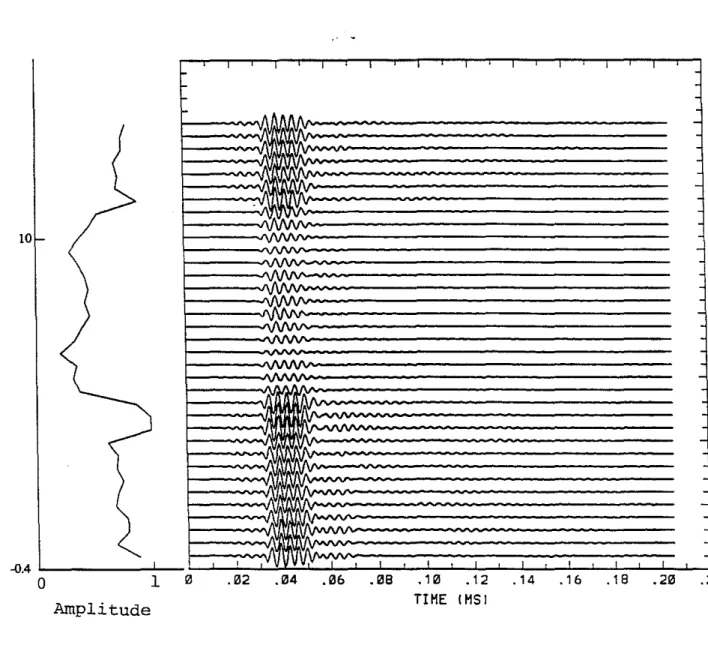
In the second example, we compare the theoretical and experimental results for the ethyl alcohol, which was used to saturate the porous layer and fill the borehole during the experiment. The results are shown in Figures 6a and 6b. Because of the low velocity of ethyl alcohol, the arrival of Stoneley waves is significantly delayed compared to the water-saturation case in Figure 5a. The synthetic waveforms across the porous layer agree with the measured waveforms very well. The amplitude log calculated from the synthetic waveform fits the measured log excellently (see also Figure 6b).
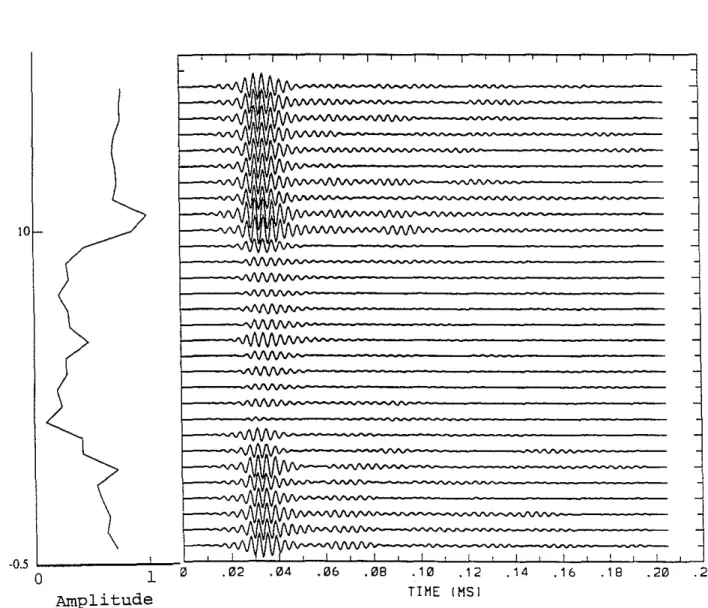
The third example is for a highly viscous saturant fluid glycerol (p.=1490 cpl. Both the measured waveform (280 kHz center frequency) and the experimental amplitude log (Figure 7a) show amplitude decrease across the porous layer. The theoretical attenua-tion value (Figure 7b) of 0.5 is close to but higher than the experimental value (0.43). In this case, the theory underestimates the experimental transmission loss across the porous layer. This discrepancy could be due to the high viscosity value of the fluid and may imply that if a reservoir is saturated with very viscous hydrocarbons, the Stoneley wave attenuation may be higher than the simplified Biot's theory predictions.
CONCLUSIONS
We have established an experimental procedure for measuring Stoneley wave propaga-tion across permeable structures in the laboratory borehole models. With controlled model parameters, we evaluated the applicability of simplified Biot's theory to the mod-elling of a permeable structure intersecting the borehole. This theory gives satisfactory results for low viscosity fluids like water and ethyl alcohol. For a highly viscous fluid such as glycerol, the Stoneley wave exhibits more attenuation than the theory predicts. In general, the theory and experiment agree fairly well. The experiment validates the theory as a usefui model for calculating Stoneley wave propagation across a permeable zone.
ACKNOWLEDGEMENTS
This research was supported by the Borehole Acoustics and Logging Consortium at M.LT. and Department of Energy grant DE-FG02-86ER13636.
REFERENCES
Biot, M.A., 1956a, Theory of propagation of elastic waves in a fluid-saturated porous solid, I: low frequency range, J. Appl. Phys., 33, 1482-1498.
Biot, M.A., 1956b, Theory of propagation of elastic waves in a fluid-saturated porous solid, II: Higher frequency range, J. Acoust. Soc. Am., 28, 168-178.
Cheng, C.H., J. Zhang, and D.R Burns, 1987, Effects of in-situ permeability on the propagation of Stoneley (tube) waves in a borehole, Geophysics, 52, 1297-1289. Giller, F., and M.N. Toks6z, 1987, Ultrasonic laboratory study of fnil waveform acoustic
logs in boreholes with fractures, M.l. T. Pull Waveform Acoustic Logging Consortium Annal Report.
Hardin, E.L.. , C.H. Cheng, F.L. Paillet, and J.D. Mendelson, 1987, Fracture characteri-zation by means of attenuation and generation of tube waves in fractured crystalline rock at Mirror Lake, New Hampshire, J. Geophs. Res., 92, 7989--8006.
Hornby, RE., D.L. Johnson, K.H. Winkler, and RA. Plumb, 1989, Fracture evaluation using reflected Stoneley-wave arrivals, Geophysics,
54,
1274-1288.Johson, D.L., J. Koplik, and R Dashen, 1987, The theory of dynamic permeability and tortuosity in fluid-saturated porous media, J. Fluid Mech., 173, 379--400.
Kostek, S., 1991, Borehole acoustic wave propagation in the presence offractures: a finite difference approach, SEG 61st Annual International Meeting, Expanded Abstracts,
863-866.
Paillet, F.L., 1980, Acoustic propagation in the vicinity of fractures which intersected a fluid-filled borehole, Trans., SPWLA 21st Ann. Symp., paper DD.
Paillet, F.L., and J.E. White, 1982, Acoustic modes of propagation in the borehole and their relationship to rock properties, Geophysics,
47,
1215-1228.Paillet, F .L., C.H. Cheng, and X.M. Tang, 1989, Theoretical models relating acoustic tube-wave attenuation to fracture permeability-reconciling model results with field data, Trans. SPWLA 30th Annl. Symp., paper FF.
Poeter, E.P., 1987, Characterizing fractures at potential nuclear waste repository sites with acoustic waveform logs, The Log Analyst, 453--461.
Stephen, D.P., F. Pardo-Casas, and C.H. Cheng, 1985, Finite difference synthetic acous-tic logs, Geophysics, 50, 1588-1609.
Tang, X.M., and C.H. Cheng, 1988, A dynamic model for fluid flow in open borehole
fracture, J. Geophy. Res., 94, 7567-7576.
Tang, X.M., 1990, Acoustic logging in fractured and porous formations, Sc.D Thesis, Massachusetts Institute of Technology, Cambridge, MA.
Tang, X.M.,and C.H. Cheng, 1991, Borehole Stoneley wave propagation across hetero-geneous and permeable structures, M.l. T. Full Waveform Acoustic Logging Consor-tium Annual Report.
Tang, X.M., C.H. Cheng, and M.N. Toks6z, 1991a, Dynamic permeability and borehole Stoneley waves: A simplified Biot-Rosenbaum model, J. Acous. Soc. Am., 90,
1632-1646.
Tang, X.M., C.H. Cheng, and F.L. Paillet, 1991b, Modelling Stoneley wave propagation across in-situ fractures, Trans. 36th Soc. Prof. Well Log Analysts.
White, J.E., 1983, Underground Sound, Elsevier Science Publishing Co. Inc.
Winkler, K.W., H.L. Liu, and D.L. Johnson, 1989, Permeability and borehole Stoneley waves: Comparison between experiment and theory, Geophysics, 54, 66-75.
Zlatev, P., E. Poeter, and J. Higgins, 1988, Physical modeling of the full acoustic wave-form in a fractured, fluid-filled borehole, Geophysics, 53, 1219-1224.
Appendix A.
THEORY OF STONELEY WAVE PROPAGATION
ACROSS A PERMEABLE ZONE
In this appendix, we describe the theory of Stoneley wave propagation across a per-meable borehole structure. A modification of the original theory of Tang and Cheng (1991) is also presented.
Consider a horizontal permeable zone of thickness L sandwiched between two non-permeable formations. In order to describe the wave characteristics in the borehole section0
<
z
<
L, we use the equation of mass conservation for a small amplitude wave motion (Tang and Cheng, 1989)i
~-
iwl
iw U . dS
=
- - 2 -pdvS PfVf 'VV
(A-I)
where
U
is the fluid displacement, Pf is fluid density, Vf is fluid acoustic velocity, p is pressure; w is angular frequency, \7V = 1rR2L ( R=bore radius) is the volume of the borehole section located at the permeable zone, andS is the surface enclosing\7V. Eq. (A-I) means that the dynamic volume compression of\7V equals the net fluid flux into\7V. The axial flux can be easily calculated. At z=O, the flux is iwUz(O)1r R2 . At z=L, it is -iwUz(L)1rR2, where Uz is the axial displacement. In the radial direction, the dis-placement includes two contributions (Tang et al., 1991a). The first is the disdis-placement of the equivalent elastic formation without flow, given by Ue • The second is the fluid flow into the permeable formation, given by ¢Uf , where ¢ is the porosity of the zone. With these quantities specified, Eq. (A-I) can be written as
(
(A-2)
Dividing Eq.(A-2) by1rR2L and using
U _ 1 dp
z - pfw2dz'
and the approximation
U(l) - U(O) dU
L
""
dz'we obtain a wave equation for the borehole pressure in the 0
<
z<
L region, given asd2p
+
[w2+
2pfW2(Ue+
¢Uf)Jp=
O.Without fluid flow (i.e., Uj = 0), Eq.(A-3) describes the Stoneley wave propagation in the equivalent elastic formation with a wave number
ke
=
(A-4)At low frequencies, Ue = V2 (White, 1983), thus we see that kR e =
li '
where CT=
P P s T
V is the low frequency tube wave velocity, P and
V.
are formation densityPjVj
1
+l/:2
P s
and shear velocity, respectively. At high frequencies, ke is approximately the Stoneley wave number calculated using the equivalent formation properties (Tang et al., 1991a). This approximation is due to the I-D simplification used here.
We now calculate the flow Uj into the permeable zone. Outside the borehole into the porous zone, the equation governing the dynamic fluid flow pressure P is (Tang et al., 1991a) (A-5) (A-6) where D
=
K(W)pjVj </>JI,(1+
1;")is the pore fluid diffusivity,JI,is viscosity, I;" is a correction for pore matrix compressibility . (see Tang et al., 1991a), and K(W) is the dynamic permeability (Johnson et al., 1987)
The solution to Eq.(A-5) is found to be
~ Ko(r..j-iw
I
D+
ka)P= L. J{, (R..j-·
I
k2 )[Pncosknz+
qncosk,.zln=Oo
zwD+
nwhere Ko is the modified Bessel function, Pn and qn are Fourier expansion coefficients, and kn's are the vertical wave numbers in the zone, which can be specified by boundary conditions at z=O and z=L. The fluid flow is given by the modified Darcy's law (Tang et al., 1991)
. - K(W)
-zw</>Ur
=
---\lP. JI,Due to the assumption that the permeable zone is sandwiched between two imper-meable formations, the vertical flow Uj. =
K(~)
aa
P should be zero at z=O and z=L.ZW,+,JI, z Computing
~~
using Eq. (A-6) results inand
(n= 0,1,2,3,···).
The radial flowUf =
~(~) ~lr=R
can also be calculated using Eq.(A-6). Averaging2W",J1. uZ .
Uf over 0
<
z
<
L, we see that all then
>
0 terms in Eq.(A-6) vanish and only then = 0 term contributes to the average flow, with Po equal ot the borehole pressure P in the 0
<
z<
L region. This gives the average flow(A-7)
Substituting Eq. (A-7) into the wave equation (Eq. A-3), we see that the Stoneley wave propagation in the permeable zone is characterized by a wave number
k= (A-8)
In the original theory of Tang and Cheng (1991), the term J iwlD was J-iwlD
+
k~,whereke was due to coupling of the formation fluid flow with the borehole propagation in a borehole of infinite extent (Tang et ai., 1991a). The elimination ofke in the present case means that the flow in the permeable zone is primarily in the radial direction and does not couple with the borehole propagation, because of the limited vertical extent of the zone. We point out that this correction is not significant in the low frequency range where wiD» ke. Only at high frequencies where iwlD becomes k~low (where kslow is the Biot's (1956b) slow wave number at high frequencies), will this correction have some measurable effects.
Once the wave number k in the permeable zone is found, the Stoneley wave trans-mission and reflection coefficients TC and RC are calculated using ( Tang and Cheng, 1991) ( 4k1ke-ikL TC = (kl
+
k)2e
ikL _ (kl _ k)2e
ikL RC= 2i(k2 - kf)sin(kL) (kl+
k)2 e ikL - (kl _ k)2 eikLwhere kl is the Stoneley wave number outside the 0
<
z
<
L region.(A-9)
Table 1: Physical parameters of the ultrasonic borehole model, the value of tortuosity a( =2.4) is taken from Winkler et al. (1989) for a synthetic porous medium.
P-wave S-wave Density Compres- Porosity Perme-
Tortuo-Medium Vp(dry) Vs(dry) p sibility rj; ability sity
(mls) (mls) (kglm3 ) Ks(Gpw) rj;(%) K(darcy) a Synthetic Porous 2510 1420 2500 37.9 36.1 126 2.4 Layer Aluminum 6400 3100 2700 - - -
-Table 2: Saturant fluid properties
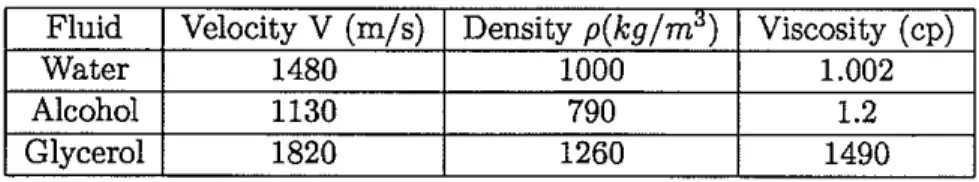
Fluid Velocity V (m/s) Density p(kglm") Viscosity (cp)
Water 1480 1000 1.002
Alcohol 1130 790 1.2
H
WATER ..____..__.-_._---.-- _...••_---_-_
. -...-_
_---_-
_--_
_-- .. ...... _---- ...•...-_---_
--_...• ......_-
_--- _-- _-__--_
...•••..•... ... _---- ...••..._--- _-_.-.-_ . ...--.-- _----_ . ...-._--- _--- ...••... ...:-:-:-:-:.:-:-:-:-:.:-:.:.:.:.:.:.:-:-:-:.:-:.:.:.:.:.:.:.:.:.:.:.:.:.:.:.:.:.:.:.:.:.:.:.:.:.:-:-.t=>o...
...••. • • • • • • • • • • • _ . _ . -e • • • • _ • • • _ _ • ee e • • • • _ e . _ • • • • ( SampleI I
I I
I I L:.X-_._._
... -._ _ .. ...... ......_.._ . ......_..•••....•..Figure 1: A diagram of experiment designed to measure the permeability of a sample with steady-state flow method.
Wires Flexane resIn 6.1 em PZT Receiver Source
Figure 2: Schematic diagram of the source-receiver pair made of PZT piezoelectric rings. The outside diameter of the transducers is 0.83 em.
VAX 8800 Sync Function Generator High-Voltage Pulse Genarator IBMPC/AT Swltchl Controller Step Motor Controller Oscilloscope DATA6000 Sync BaMpass Filter PreamplIfIer ( ReceIver Source
Figure 3: Block diagram of experiment setup.
Steo Motor
Hl 9 8 7
'"
6 L ~ > ~ u 5 ~ 0:: 4 3 2 .02 .34 .06 .08 .10 .12 TIME IMSI .14 .16 .18 .20 .22Figure 4: Waveforms recorded in an intact aluminum model at varying source-receiver spacing of 1.0 em. The center frequency of the signals is about 250 kHz.
I-I I
,
,
, I I0 1
0 Amplitude .02 .t=..
C-Ol Cl 10-)~I
:vvVVV,v' .04 .06 .08 .10 .12 TIME IMSI .14 .16 .18 .20 -.22 ( (Figure 5: a) Amplitude of Stoneley waves and waveforms recorded (depth increment=O.4 em) in a permeable zone borehole model saturated with water. The width of the permeable zone is 1.15 em. The porosity and permeability are 36.1
%
and 126 darcy respectively. The measured transmission coefficient is 0.52....
151- I- r-amplitude 1o
TIME (MSJ -.220Figure 5: b) Synthetic waveforms (depth inerement=O.75 em) and amplitude log. For comparison, the experimental log (dots) is also plotted. The two logs agree very well.
( ,02 .04 ,06 . 08 . , 0 . 12 . '4 . , 6 . , 8 .20 .22 TIHE IHSI
o
>- I I 1 I T I I-'0J'AM~H~
~
'.V.V -tV . -'-'-A'01
-,'AV: \f1 "AVAV-~
···-~·hA·"-v,
rlr
v , v , ' -'v, 'y -'.VV IV-::~:.I
'·A' ·....
· ,v-,
· -0.4o
1 Amplitude ..c....
Q..,
Cl ~ Eu
Figure 6: a) Amplitude log of Stoneley waves and waveforms (depth increment=OA cm) recorded in a permeable zone borehole model saturated with ethyl alcohol. The measured transmission coefficient is 0.59. The parameters of the permeable fracture zone are the same as in Figure 5a).
5
.220 TIME (MS) 1 I -\ \11/\ 11\'1
~
-l-•
,
v;~
I--r,
,
I",V.•
" V"P 1-- ,-
.
~
IJ,V,.
-
:
,.
-
•
·h'.V•
IV" I--•
I'h',•
I-~
(Vv'·,..
-
,
\ 1\ •e-
It
~~.
I--,
11}
, V V I-:
'
,
/,v
'v
Ie-
,
"\ ,J.V.V l- i,
~;:/-•
' \ ,".V•e-
' IVV,
..
,
, 0 ,o
o
amplitude 1520
E
~a
10 Q) "t:lFigure 6: b) Synthetic waveforms (depth increment=O.75) and amplitude log across the permeable zone. The theory and experiment agree very well.
'I:
I I,
,
I I I -'v -·v, ,_v..
-'V, "'v,-,i
,;
'v A -f- 'yvv-....
-':AVAVV ~,:....
• v~.v,V -_..
-...
'V.V_Y".-
.
'V. ~.y' 'V, ,_V ,A -A ' v 'V' " ;,
,
,
, , .c-
c. wo
10 -0.5o
1 Amplitude .02 .04 .06 .08 .10 .12 TIHE IHSJ .14 .16 .18 .20 .22 ( (Figure 7: a) Amplitude log of Stoneley waves and waveforms(depth increment=0.5 cm) recorded in a permeable zone model saturated with glyceroL The measured transmission coefficient is 0.43. Other parameters are the same as in Figure 5a).
5
.220 TIME (MS) I I I I~
::Mf.l~
,I-ie
0!!v'r.V;A I- l ,JAVv~ ~
'-1oo- t•
.,
'y',v.vv•
'-
'v 'v v -I- ',v•'-
•
•
..,VA~,v.,'-
•
•
i,vA 100-•
,h~Af\,v•
I- •"!Y:
.-
""\ I!' 'v l-•
•
'-
•
100-•
i:.
•
'-
•
~hV:v I- , v,v;v••
'-
I,';
l-II
IVv -I , , I IV~ 0 ,o
o
1 amplitude 15 20E
.3-~ 10a
Q) "t:lFigure 7: b) Synthetic waveforms and amplitude log across the permeable layer (depth increment=O.75 em). In this very viscous saturant fluid case, the experiment exhibits more attenuation than the theory predicts.
a.
1 II. II. 0.8 _ W 0 'Mory (,) 0.8 -Z(
Q...",-1Il 0.4 -1Il mouullld ~ 1Il 0.2 Z Saturant: water c
a:
0 I-0 100 200 300 400 FREQUENCY (kHz)b.
1 II. II. w 0.8-m7
Ured 0 (,) Z 0.6 -0If
thllOfYill
0.4 -~ en 0.2 -Z (C Saturant: ethyl alcohol
a:
I- 0 -,-0 100 200 300 400 FREQUENCY (kHz) C. 1 II.I~
II. 0.8 -W theory 0 (,) Z 0.6 -0 iil 0.4 - OJ ::J en~
~ (f) 0.2 - measured Z Saturant: glycerolc
a:
0 I-o 100 200 300 FREQUENCY (kHz) 400Figure 8: Comparison of theoretical and measured transmission coefficients in the fre-quency range of measurement for the three saturant fluids.