Publisher’s version / Version de l'éditeur:
Vous avez des questions? Nous pouvons vous aider. Pour communiquer directement avec un auteur, consultez la première page de la revue dans laquelle son article a été publié afin de trouver ses coordonnées. Si vous n’arrivez pas à les repérer, communiquez avec nous à PublicationsArchive-ArchivesPublications@nrc-cnrc.gc.ca.
Questions? Contact the NRC Publications Archive team at
PublicationsArchive-ArchivesPublications@nrc-cnrc.gc.ca. If you wish to email the authors directly, please see the first page of the publication for their contact information.
https://publications-cnrc.canada.ca/fra/droits
L’accès à ce site Web et l’utilisation de son contenu sont assujettis aux conditions présentées dans le site LISEZ CES CONDITIONS ATTENTIVEMENT AVANT D’UTILISER CE SITE WEB.
Client Report (National Research Council of Canada. Construction), 2016-07-19
READ THESE TERMS AND CONDITIONS CAREFULLY BEFORE USING THIS WEBSITE.
https://nrc-publications.canada.ca/eng/copyright
NRC Publications Archive Record / Notice des Archives des publications du CNRC : https://nrc-publications.canada.ca/eng/view/object/?id=6637cc9c-e662-45c6-ba7d-2163f57ba470 https://publications-cnrc.canada.ca/fra/voir/objet/?id=6637cc9c-e662-45c6-ba7d-2163f57ba470
Archives des publications du CNRC
For the publisher’s version, please access the DOI link below./ Pour consulter la version de l’éditeur, utilisez le lien DOI ci-dessous.
https://doi.org/10.4224/23002875
Access and use of this website and the material on it are subject to the Terms and Conditions set forth at
Les terrasses de la chaudière: preliminary risk assessment of existing
brick-faced wall panels
Banister, C.; Cusson, D.; Lacasse, M. A.; Laouadi, A.; Saassouh, B.;
Trischuk, K.; Zhang, J.
Construction
Les Terrasses de la Chaudière
— Preliminary Risk Assessment
of Existing Brick-faced Wall
Panels
C. Banister, D. Cusson, M. A. Lacasse, A. Laouadi,
B. Saassouh, K. Trischuk and J. Zhang
A1-008997-01
19 July, 2016
Table of Contents
Table of Contents ... i
List of Figures ... iii
List of Tables ... v Disclaimer ... vii Summary ... ix 1. Introduction... 1 1.1 Background ... 1 1.2 Objectives ... 2
2. Technical review of documentation & inspection of wall panels (Task 1a) ... 3
2.1 Overview of previous condition assessment studies and repairs ... 3
2.2 NRC comments on previous reporting on brick damage inspection ... 6
2.3 Identification of deterioration mechanisms and their impact ... 13
3. Numerical modelling and analysis of bricks and wall panels (Task 1b) ... 17
3.1 Thermal stress analysis of brick unit... 18
3.2 Thermal stress analysis of brick panel ... 21
3.3 Preliminary observations on mechanism and extent of damage from numerical modeling results .. 24
3.4 Future planned numerical simulations ... 24
4. Results of in-laboratory inspection of a wall panel & laboratory testing of wall components (Task 1c) ... 24
4.1 Identification of rebars in concrete and their corrosion condition ... 25
4.2 Brick Testing ... 25
4.3 Basic properties and durability features of concrete panel ... 26
4.4 Wall Specimen ... 26
4.5 Results of on-site inspection of wall panels ... 29
5. Risk management of falling bricks from building facades (Task 2)... 32
5.1 Risk methodology ... 32
5.1.1 Risk identification ... 33
5.1.2 Risk Analysis ... 33
5.1.3 Risk evaluation ... 34
5.2 Proposed risk model ... 35
5.2.1 Assessing the likelihood for bricks to fall from facade panels ... 35
5.3 Recommendations for risk mitigation measures ... 40
6. Proposed alternative facade maintenance-preservation options with related costing (Task 3) ... 42
6.1. Description of envelope preservation options ... 42
Overhead protection ─ Based on the proposed risk model presented in Chapter 5.2, and the mitigation measure suggested in Chapter 5.3, all landing areas (sections) are to be investigated. Results from ranking the respective risks will provide information necessary for: ... 43
6.2 Costing of envelope preservation options ... 43
6.3 Scheduling of envelope preservation options ... 43
7. Summary of findings and recommendations ... 44
7.1 Summary of findings ... 44
7.2 Recommendations ... 45
Appendix A ... 47
Appendix B – List of documents provided by PSPC ... 53
Appendix C – Probability Functions of Distances From Buildings Facades Should Brick Units Fall ... 55
C.1: Modelling the possible landing areas with respect to buildings heights ... 55
C.2: Probability density function... 56
C.3: Consequence to pedestrian rating ... 57
Appendix D – Example of Risk Rating Between Two Iso-risk Sections ... 59
D.1: Introduction ... 59
D.2: Consequence rating ... 60
D.2.1. Section 100E1: Quantitative consequence rating based on frequency & area of exposure: ... 60
D.2.2. Section 200N3: Quantitative consequence rating based on frequency and area of exposure ... 61
D.2.3. Calibration and normalization ... 62
D.3: Likelihood rating ... 63
D.4: Risk Grid and Risk rating ... 64
Appendix E – Further Observations on Pathology of Failure of Brick-faced Concrete Panels... 65
List of Figures
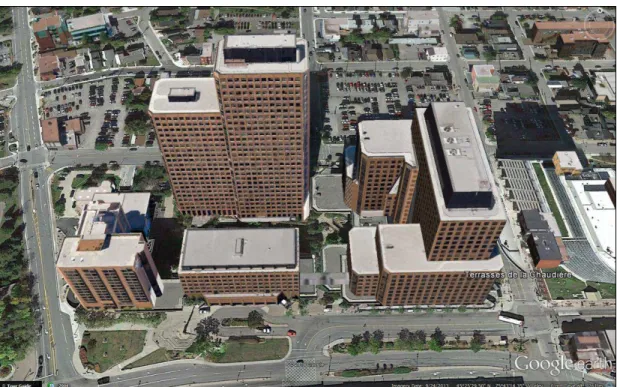
Figure 1 – Les Terrasses de la Chaudière Complex, showing Block 100 (right), Block 200 (centre back), Block 300 (centre front), and the hotel (left, not part of project). (Picture from Google Earth) . 2
Figure 2 – Number of damaged bricks per floor level – Block 100 (as of 2015) ... 10
Figure 3 – Number of damaged bricks per floor level – Block 200 (as of 2015) ... 10
Figure 4 – Number of damaged bricks per floor level – Block 300 (as of 2015) ... 10
Figure 5 – Block 100(as of 2015) Normalised number of damaged bricks/panel at Floor number ... 11
Figure 6 – Block 200 (as of 2015) Normalised number of damaged bricks/panel at Floor number ... 11
Figure 7 – Block 300 (as of 2015) Normalised number of damaged bricks/panel at Floor number ... 11
Figure 8 – Elevation view, and horizontal and vertical sectional views of prefabricated brick masonry single-window wall panel ... 14
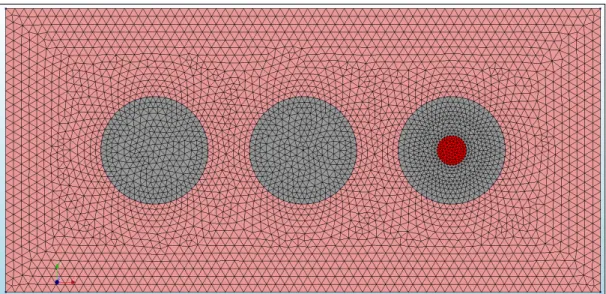
Figure 9 – Horizontal sectional view at joint between adjacent wall panels: (1) Interior finish – 11 mm gypsum panel; (2) 100 mm reinforced concrete panel; (3) Insulation – 50 mm extruded polystyrene; (4) Air space – 12 mm; (5) Exterior cladding – 90 mm reinforced brick masonry . 14 Figure 10 – 2D brick model featuring triangular plane-stress structural elements. Rebar located in circular opening on far right along with mortar; other two openings have only mortar ... 19
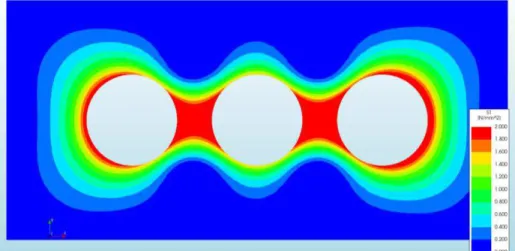
Figure 11 – Principal tensile stresses from a 50°C decrease in temperature (linear elastic analysis) ... 20
Figure 12 – Principal tensile stresses from a 30°C increase in temperature (linear elastic analysis) ... 20
Figure 13 – Brick splitting as observed by JCAL 2010 ... 20
Figure 14 – 2D model configuration of brick masonry wall panel ... 21
Figure 15 – Principal tensile stresses from a 50°C decrease in temperature (linear elastic analysis) ... 22
Figure 16 – Principal tensile stresses from a 30°C increase in temperature (linear elastic analysis) ... 22
Figure 17 – Brick de-bonding and loosening as observed by JCAL (2000) ... 22
Figure 18 – Principal tensile stresses from a 50°C temperature decrease (linear elastic analysis) (assumed conventional construction) ... 23
Figure 19 – Principal tensile stresses from a 30°C temperature increase (linear elastic analysis) (assumed conventional construction) ... 23
Figure 20 – As received LTDLC wall panel on the ground ... 26
Figure 21 – Cross-sectional cut of brick removed from wall panel, displaying fully filled void spaces ... 27
Figure 22 – Sectioned brick from wall specimen showing fully-filled voids and cored mortar samples .... 27
Figure 24 - Examples of pedestrian overhead protection located at the perimeter of TDLC. ... 29
Figure 25 – Examples of repairs to brick units and brick veneer assembly conduced on East (Left) or to be completed on North (Right) façade of TDLC Block 100. ... 29
Figure 26 – Photos of elevations of Block 200 showing East façade of levels 12 to 25 (left) and details (right) of recent repairs along levels 7 to 10 ... 30
Figure 27 Photos of elevation of East façade of Block 200 showing extensive repairs to brick façade at level 8, but particularly at level 9 ... 30
Figure 28 - Photos (Top-left) of elevation of West facing façade of Block 100 showing Roof (level 11) to Level 14; (Top-right) Evidence of brick fracture at panel joints; (Bottom photos) Details of brick spalling on East facing of Block 100; Evidence of spalling of the brick facia, likely due to freeze-thaw action; water run-off from window sill above wet portions of brick beneath sill making these locations more susceptible to freeze-thaw action ... 31
Figure 29 – Evidence of brick failure at a panel joint; failure of half brick unit likely due to dissimilar values of coefficient of thermal expansion between brick and mortar; mortar is seen to be completely intact; no degradation of mortar evident ... 31
Figure 30 – Evidence of bowing of concrete panels; clearly evident only on panels having 2 windows ... 32
Figure 31 – ISO 31000 Risk management framework (3) ... 33
Figure 32 – Example of Iso-risk sections ... 35
Figure 33 – Overlapping landing areas ... 35
Figure 34 – Example of qualitative risk grid ... 41
Figure 35 – Height with respect to possible brick landing distance ... 55
Figure 36 –Brick landing distance considering width of overhead protection ... 56
Figure 37 –Probability density function of landing areas ... 56
Figure 38 - Block 100 Section above the bus station ... 59
Figure 39 - Block 200 section above the loading docks ... 59
Figure 40 - Example of Size and Location of exposed area (section 100E1) ... 61
Figure 41 - Example of Size and Location of exposed area (Section 200N3) ... 62
Figure 42 – Example of brick failure on wall panel ... 65
List of Tables
Table 1 – List of Reports on Condition Assessment of LTDLC brick wall cladding ... 7
Table 2 – Number of damaged bricks reported by building elevations and time ... 8
Table 3 – Number of damaged bricks over time (all buildings together) ... 9
Table 4 – Ratio of damaged bricks per panel by type to total number of bricks, by type, per panel ... 13
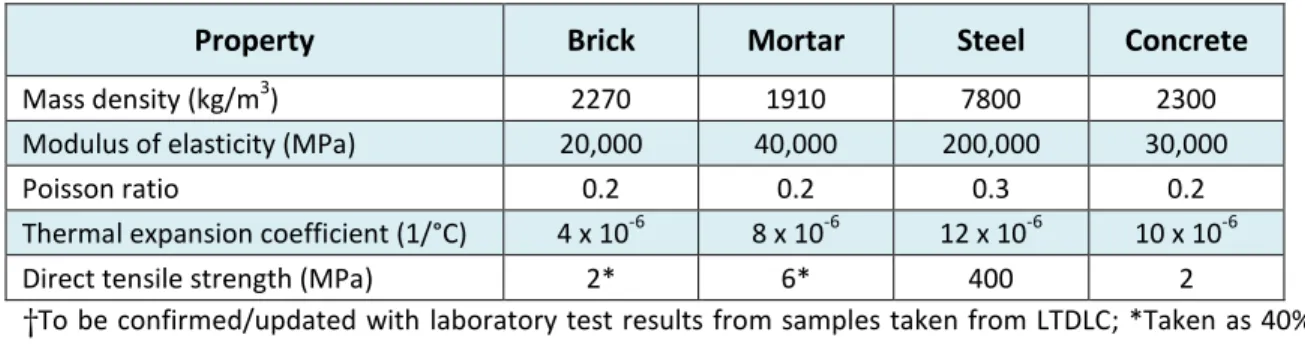
Table 5 – Assumed properties of brick and mortar materials for numerical modelling... 18
Table 6 – Material properties of components of wall panels (as of present date (June 1/2016)* ... 28
Table 7 – Likelihood assessment process ... 36
Table 8 – Assessment of consequence arising from occurrence of a harmful event ... 40
Table 9 – Information required for defining ratings for each factor ... 60
Table 10 – Scale for consequence rating ... 63
Disclaimer
NRC will rely in good faith on the information provided by PSPC and their consultants and does not accept responsibility for any deficiencies or inaccuracies from the proposed work as a result of omissions or misinterpretations of others. NRC offers no warranty, expressed or implied, that the proposed work will uncover all potential deficiencies and risks of liabilities associated with the subject property. The recommendations that may be put forward in the final report will not constitute technical specifications for purposes of construction. They are intended to guide PSPC as to possible risk management strategies for the maintenance and preservation of the brick-faced wall panels.
Summary
Les Terrasses de la Chaudière (LTDLC) – Preliminary Risk Assessment of Existing Brick Walls
Les Terrasses de la Chaudière (LTDLC) complex was designed by Arcop Associates and built by the Campeau Corporation between 1976 and 1978. The complex is composed of four towers (3 government offices and one hotel) located in downtown Gatineau, between Promenade du Portage, Eddy, Wellington and Montcalm streets. The three government office towers are 7, 19 and 28 stories high and are linked at their first and second levels by a retail concourse and the basement levels by a tunnel system. It is the single largest federal office complex in Canada with a total rentable floor area of 142,353 m2, and accommodates over
6,000 people. The complex contains the administrative headquarters of Environment and Climate Change Canada, Aboriginal Affairs and Northern Development Canada, Canadian Heritage, the Canadian Radio and Telecommunications Commission, and the Canadian Transportation Agency.
The three government office towers (Blocks 100, 200 and 300) are reinforced concrete structures, covered with prefabricated, brick-faced panels that form most of the building envelope. Above the second floor, the exterior walls consist of brick-veneer over a concrete back-up wall with aluminum-framed windows and doors. The exterior wall was designed as a drained system, using the airspace between the brick and insulated back-up wall as the drainage cavity. The exterior envelope of the lower two building levels forming the pedestrian concourse is of conventional masonry, rather than prefabricated systems.
Since the construction of the complex, the exterior brick-cladding has undergone advanced deterioration, presently creating potentially serious safety issues. In the late 1990’s, the brick cladding of the LTDLC towers was a concern because of premature deterioration and serious safety issues related to the risk of falling bricks. Upon the first report of brick falling in 1997, there have been numerous studies of the brick cladding and the extent of deterioration of the walls. These studies have resulted in recommendations for a program to manage the risks with regular inspection and repair, and use of overhead protection measures around the site.
Current status
A permanent solution to address the above health and safety risks for Blocks 100, 200 and 300 is currently being developed through the design of a new building envelope, with construction expected to start in 2018 and end in 2023. It is anticipated that the exterior building envelope will be implemented in at least two phases, such that the envelopes of the exterior towers will first be rehabilitated and thereafter, the lower two levels which use a different cladding type. Public Services and Procurement Canada (PSPC) is engaging a consultant to develop schematic designs and construction implementation strategies to rehabilitate the LTDLC complex building envelope that will address these health and safety issues. Whereas in the short to medium term, the existing wall panels are experiencing accelerated deterioration with a growing risk of brick falling onto public areas at the base of the towers, consideration ought to be given to ensuring that as broad an area at the base and perimeter of the buildings of the LTDLC complex be fully protected by the installed overhead protection measures.
The National Research Council Canada (NRC) has been retained by PSPC to conduct a preliminary risk assessment study of the existing brick wall panels. The objectives are to review the existing inspection reports, to provide risk assessment of observed deterioration of the brick walls, and to make
recommendations on alternative facade maintenance options with related costing. NRC has been asked to provide technical support to PSPC on the following tasks:
1. Technical review of prior reports and data sets provided by PSPC related to the condition of the brick-faced wall panels.
2. Overall risk assessment of observed deterioration of brick wall panels.
3. Provide alternative facade maintenance-preservation options with related costing.
Key considerations
Despite the detailed observations of brick failures in previous inspections, the underlying causes of the premature deterioration of the brick walls had not been investigated. This step is required for a clear understanding of the pathology in order to make a sound assessment of the deterioration rates and risks, and to propose cost-effective facade maintenance solutions to PSPC.
Several potential causes of deterioration have been and will continue to be investigated by NRC; they include: (i) differences in thermal expansion rates between bricks, epoxy mortar and steel bars creating stresses and cracking of the bricks and joints due to annual and daily temperature variations; (ii) corrosion of steel bars creating internal pressure and cracking of the surrounding bricks; (iii) moisture absorption and freeze-thaw resistance of bricks resulting in cracking; (iv) stiffness of bricks and mortar which makes them brittle and subject to movement-induced cracking; and, (v) bowing of concrete panels due to differential drying shrinkage of the concrete.
Preliminary results suggest that the primary cause of failure is the differences in thermal expansion rates amongst brick units, epoxy mortar and the steel reinforcing bars. The selection of a high-strength self-leveling mortar to provide for a reinforced brick fascia affixed to the concrete panel has caused wide-spread failure of brick units, the failure being evident from observations described in the several of the reports and from on-site inspection. As such, is this façade system nonetheless serviceable?
The brick veneer wall panel system will require continuous monitoring and perhaps repair for the remainder of its service life; it may indeed have already reached its end of life. As such it will continue to be a burden on PSPC resources whilst not providing the level of performance as was originally intended in its design. The courtyard will not yet be accessible, the overhead protection will still be required and risks to injury will nonetheless be present until such time as the brick panel wall assembly is replaced.
Recommendations
The recommendations provided below are based on an initial assessment of the bricked-faced wall panels as described in the report; these are to be updated in the subsequent and Final report to PSPC:
• Undertaking inspections of brick wall panels at least on an annual basis; • Estimating, on the basis of inspection results (currently being collected):
o Rate of deterioration & remaining life of brick façade
o Risks and change in risk associated with changes in rate of deterioration o Cost of repair or other interventions
• Determining the extent of repair, or other interventions, required to maintain reliability (level of acceptable risk) of the brick façade.
• Repairing the envelope air barrier if found defective
High Performance Roofing and Walls Technologies
Les Terrasses de la Chaudière
—
Preliminary Risk Assessment of Existing Brick-faced Wall Panels
Authored by:
C. Banister, S. M. Cornick. D. Cusson, Michael A. Lacasse, B. Saassouh, K. Trischuk and J. Zhiang
A Report for
Public Services and Procurement Canada
Major Crown Projects / Real Property Branch
Promenade du portage, Basement, Room 8
J8X 2K1, Gatineau, QC
ATT: Mr. James Bruce, P.Eng, LEED AP
Mr. François Nadeau
Project Managers - Les Terrasses de la Chaudière
National Research Council Canada Ottawa ON K1A 0R6 Canada
19 July, 2016
This report may not be reproduced in whole or in part without the written consent of both the client and the National Research Council of Canada
Les Terrasses de la Chaudière
—
Preliminary Risk Assessment of Existing Brick-faced Wall Panels
C. Banister, D. Cusson, M. A. Lacasse, A. Laouadi B. Saassouh, K. Trischuk and J. Zhang
1. Introduction
1.1 Background
Les Terrasses de la Chaudière (LTDLC) complex was designed by Arcop Associates and built by the Campeau Corporation between 1976 and 1978. The complex is composed of four towers (3 government offices and one hotel) located in downtown Gatineau, between Promenade du Portage, Eddy, Wellington and Montcalm streets (see Figure 1). On the West side, the complex is bordered by Delta Hotel, but the hotel and its parking garage are excluded from this project. The three government office towers are 7, 19 and 28 stories high and are linked at their first and second levels by a retail concourse and the basement levels by a tunnel system. The total rentable floor area is 142,353 m2, accommodating over 6,000 people, as well as retail
and storage space. It is the single largest federal office complex in Canada, containing the administrative headquarters of Environment and Climate Change Canada, Aboriginal Affairs and Northern Development Canada, Canadian Heritage, the Canadian Radio and Telecommunications Commission, and the Canadian Transportation Agency.
The three government office towers are reinforced concrete structures, covered with prefabricated, brick-faced panels that form most of the building envelope. Above the second floor level, the exterior walls consist of brick-veneer over a concrete back-up wall with aluminum-framed windows and doors. The corner (bay) sections are comprised of a curtain-wall assembly, with insulated clad spandrel panels. The exterior wall was designed as a drained system, using the airspace between the brick and insulated back-up wall as the drainage cavity. The exterior envelope of the lower two levels forming the pedestrian concourse is of conventional masonry, rather than prefabricated systems.
Over the years of service, deterioration of the exterior brick-cladding has steadily progressed, attaining by the late 1990s, a more advanced stage of deterioration and since that time, creating potentially serious public safety issues that Public Services and Procurement Canada (PSPC) have been actively attempting to manage over these years.
A brick inspection and repair program is underway to maintain safety standards, but a permanent solution is also envisaged whereby the entire building envelope system, including windows, curtain wall, the mechanical and electrical interface, and interior finishes is to be rehabilitated. It is anticipated that the replacement of the exterior building envelope will be implemented in at least two phases, so that the tower exterior envelopes will first be rehabilitated, followed by rehabilitation of the lower two levels forming the podium and the ground level circulation systems.
Figure 1: Les Terrasses de la Chaudière Complex, showing Block 100 (right), Block 200 (centre back), Block 300 (centre front), and the hotel (left, not part of project). (Picture from Google Earth)
PSPC is engaging a consultant to develop schematic designs (incl. seismic upgrades) and construction implementation strategies to rehabilitate the LTDLC complex building envelope to address safety issues, as described in the Building Envelope Retrofit Feasibility Study (Smith Carter 2013).
The work of the consultant will entail a detailed review of all available documentation and reports; analysis of the as-built conditions; review of the options for the exterior building envelope and seismic resistance; development of four design options as well as a recommended option; construction implementation strategy, and presentations to authorities with jurisdiction.
1.2 Objectives
The National Research Council Canada (NRC) has been retained by PSPC to conduct a preliminary risk assessment study of the existing brick wall panels. The objectives are to review the existing inspection reports, to provide risk assessment of observed deterioration of the brick walls, and to make recommendations on alternative facade maintenance options with related costing. NRC has been asked to provide technical support to PSPC on the following tasks (focusing on Blocks 100, 200 and 300):
(1) Technical review of reports and data sets provided by PSPC related to the condition of the brick-faced wall panels.
(2) Overall risk assessment of observed deterioration of brick wall panels.
(3) Provide alternative facade maintenance-preservation options with related costing.
Accordingly, each of these tasks forms the basis for the work plan and each is dealt with in turn, the results of which have been provided in their respective sections.
2. Technical review of documentation & inspection of wall panels
(Task 1a
1)
The intent of the technical review of documentation and available data sets was to:
(1) Collect all pertinent documentation and data that were made available to NRC, to permit
commentary of the pathology of deterioration and from which to inform the risk assessment of the different LTDLC buildings and facades that is described in Task 2 (Chapter 5);
(2) Identify areas where missing data and clarifications are required from PSPC or their consultant and that could further inform on the expected life of the brick masonry facades;
(3) Inform at what locations on a building should inspections should be conducted, and as well, which buildings should be inspected to gain further knowledge and understanding of the pathology of deterioration of the brick masonry wall panels;
(4) Provide a basis for proposing brick inspection and repair options as may be described in Task 3 (Chapter 6).
A review of proposed options for brick inspection and repair of the brick masonry panels is provided in Task 3 whereas results of on-site and in-situ inspection of wall panels are not yet available as inspections have not yet taken place. The results of in-laboratory inspection of a wall panel specimen and results of laboratory testing of wall components are provided in Chapter 4.
2.1 Overview of previous condition assessment studies and repairs
The first sign of a potential issue with the brick cladding on the LTDLC buildings arose in December 1995 at which time a complaint was made regarding pieces of bricks that landed into the outdoor play area of the daycare facility located at the base of Block 200 at the South elevation. Two other observations of fallen bricks into the playground area were also reported in March 1996 and September 1997. Following the first observation, several investigations and remedial work have since been conducted and are summarized below: • March 1997 – CABA (Consultants André Beaulieu & Associés) completed a study of the exterior walls of
Block 300, including thermographic analysis, visual inspection, and structural analysis of wall panels. They observed bowing and cracks in some wall panels, a few damaged bricks (splitting), and heat loss problems between the wall panels. They concluded that panel anchors were sound, cracks in brick cladding were the result of freeze/thaw cycles, but that overall, the building was in “excellent condition”.
• December 1997 – Larivière Construction completed an emergency inspection and replacement of loose bricks on Blocks 100, 200 and 300. (Report missing)2
• March 1998 – CABA and AAR (Adjeleian Allen Rubeli) jointly conducted a building envelope and structural evaluation of Blocks 100, 200 and 300. (Report missing)
• October 1999 – JCAL (John Cooke & Associates Ltd) performed a free fall brick trajectory testing at Blocks 100 and 200, and indicated that the impact of falling bricks can cause serious injury as bricks can break into numerous small projectiles on impact with a hard surface. They concluded however that the risk of falling bricks drifting beyond 1200 mm from the face of the building was very unlikely.
1
Relates to tasks described in the Project Proposal; Proposal provided in Appendix A
2
Report missing – this description indicates that reference to this report have been made in one of the reports received from PSPC but it was not part of the set of reports that were provided to NRC.
• October 1999 – CABA completed study and repair of South and partial West wall of Block 200, including structural and thermal study of building, inspection of brick walls with sounding, replacement of loose bricks, and repair of cracks, joints, ventilation and drainage. CABA concluded that the observed deterioration was related to exterior elements and that poor drainage and ventilation of the cavity behind the bricks were the primary causes of brick damage3. Furthermore, CABA concluded that inaction will
result in continued and increased brick deterioration.
• December 1999 – CABA conducted a water infiltration study on Blocks 100, 200 & 300. (Report missing)
• September 2000 – JCAL performed an inspection of all brick panels on Blocks 100 and 200, plus part of Block 300, and observed 1214 cracked bricks generally located at the edge of panels and at window edges. JCAL judged that the deterioration was likely related to reinforcing bars present at the same locations and that most of the defects encountered can be considered normal defects expected in the life of a building. They also concluded that corroding of the reinforcing bars was caused by, and not causing, cracks in brick. Cracks in bricks were deemed to result from thermal expansion and contraction of the bricks. JCAL recommended considerable repair work and regular brick inspections (every 3 to 5 years) to ensure bricks will not deteriorate to a point that pieces would fall off the building. The identified damaged bricks were actually repaired in 2001 and 2002.
• April 2001 – Morrison Hershfield conducted a second opinion review of previous CABA investigations. They concluded from CABA observations that the isolated cracking of bricks was due to corrosion of the reinforcing bars. They recommended wall repair and maintenance, but not a complete rebuild unless deterioration increased substantially. Morrison Hershfield also concluded that precipitation was the probable source of water to saturate the bricks on the buildings.
• September 2003 – JCAL completed an inspection of all brick walls on Blocks 100, 200 and 300 and observed 1672 cracked brick generally at the edge of panels or at window edges, noting for the first time that pieces would have fallen by themselves within the next two years. JCAL indicated that East elevations exhibit most deterioration and judged that it was indicative of extreme temperature changes causing greater amount of cracking due to differential thermal expansion of brick and reinforcing bars. JCAL recommended essential repair work and periodic inspection (every 3 years) to ensure that broken bricks are identified and replaced. Partial repair of the 1672 damaged bricks was conducted between 2003 and 2006 (some elevations of Block 200 were excluded).
• March 2005 – According to PTVD 2015 (Patenaude Trempe Van Dalen), PSPC performed a thermographic study of the complex and concluded that there were no significant air leakage anomalies.
(Report missing)
• November 2009 – JCAL completed an inspection of all brick walls on Blocks 100, 200 and 300 and observed 7883 cracked bricks generally at panel edges or at window edges (89% of total cracked bricks), noting for the first time pieces that would have been at risk of falling within one year. JCAL noted that the count included bricks first identified in their 2003 inspection that were still not replaced. JCAL indicated that East and South elevations exhibited the most deterioration. They also commented that the South elevation of Block 200 exhibited surprisingly little deterioration where flashings had been installed in the vertical panel joints (as directed by CABA in 1997), which prevented water from getting to the sides of the brick panels. • JCAL also observed a brick dropping during their work on Block 200, deflecting off a window sill and
landing approximately 30 meters from the building, and concluded that the risk of falling bricks causing injury is high and danger around the base of the building is large. JCAL noted that the life expectancy of their recommended brick repair is 10 years. Furthermore, JCAL concluded for the first time that steel
reinforcing corrosion was causing bricks to crack. The repair of all 7883 identified damaged bricks was done in 2011 and 2012.
• November 2010 – JCAL and RMA (Robertson Martin Architects) jointly conducted a visual inspection of some panel anchors at Blocks 100 and 200. They concluded that the gravity and lateral connections of the typical single-window and double-single-window panels were adequate for the gravity and seismic forces of the National Building Code (NBC 2005), with reserve capacities of 13% and 21% for each type of panel, respectively. They also indicated that, in a potential future re-cladding project, the option of adding a new veneer on top of the existing bricks is not recommended due to the limited reserve capacity of the existing anchors.
• September 2012 – JCAL conducted an inspection at Block 200 and observed cracking parallel to brick face, which could permit large sections of brick faces to fall altogether. Similar observations had been made on lower levels and the conditions had been attributed to uncontrolled air leakage through holes left in precast panels for access equipment anchors used for the 1997/1998 repairs. 2012 observations included saturated bricks, but the source of moisture was not investigated. In addition, the air space in the wall assembly was found to be filled with saturated, expanded polystyrene insulation where split bricks were removed and replaced. The extent of this condition is not known. JCAL stressed that cracking in bricks parallel to brick face creates different and higher risk than fragments resulting from cracking perpendicular to brick face. JCAL pointed out a new risk that multiple brick faces would fracture into multiple smaller fragments on impact with overhead protection, with fragments following unpredictable trajectory that could extend beyond overhead projection. JCAL also warned that brick fragments, or groups of brick faces, hitting window sills will likely be deflected and could hit pedestrians or vehicles beyond the overhead protection.
• September 2014 – Adjeleian Allen Rubeli (AAR) completed an impact study for overhead protection around the base of the buildings. AAR repeated the risk of individual or small groups of brick faces dislodging completely and falling without warning, resulting in significant hazard to pedestrians in the vicinity of the building. AAR provided their caution of the risk of fragments of brick bouncing off the overhead protection. • September 2014 – JCAL completed an inspection of all brick walls on Blocks 100, 200 and 300 and
observed 3223 cracked brick generally at panel edges and at window edges (87% of total cracked bricks), noting pieces that would have been at risk of falling within one year. JCAL indicated that East and South elevations continue to exhibit the most deterioration and again commented that the South elevation of Block 200 exhibited less deterioration where flashing was installed within the panel joints, preventing water from getting to the sides of the brick panels. JCAL repeated their previous comment that falling bricks could deflect off window sills and land in the order of 30 meters from the building, reiterating that the risk of falling bricks causing injury is high and danger around the building is large. JCAL noted that the life expectancy of their recommended brick repair is 5 years.
• January 2015 – Patenaude Trempe Van Dalen (PTVD) completed a review of the previous brick wall panel investigations from 1997 to 2014. The following is an excerpt from PTVD’s report summarizing their review “When deterioration of the brick was first investigated, CABA provided the opinion that a comprehensive and costly repair program was required, although the root cause of the deterioration had not actually been identified. When JCAL first investigated the condition of the brick cladding, they provided an opinion that a much less extensive program of repair would be effective in maintaining the brick cladding and PWGSC opted to adopt the JCAL approach. JCAL did not undertake a detailed study of the cause of the deterioration and described it as expected in the life of a building. As the result of four complete surveys and other detailed investigations of specific areas of concern over fourteen years, JCAL assessed that there is an on-going, rapid deterioration of the brick that warrants regular inspection and repair to remove the hazard of brick falling from the walls, as well as permanent overhead protection around the base of the buildings. More importantly, JCAL have determined that the type of deterioration and risk has evolved and now includes the risk of larger groups of brick falling. They have concluded that this inspection and repair program can only extend the service life of the brick for another 5 years, but have cautioned that even through that timeframe there are risks that are not appropriately handled by the installed protection.
Upon review of the documentation provided, PTVD concurs with the risk assessments of JCAL and AAR, although we are not in full agreement with JCAL on the rate of deterioration. Nonetheless, there is a clear need for an on-going risk management program and we have identified some shortcomings of the current program. Specifically, we note that the inspection and repair program has been strictly reactive to-date, and the repairs have lagged too far behind the inspection. Furthermore, we note that the installed protection does not extend into areas that are highly likely to be landing locations for falling brick that deflects off the building wall or rebounds off the overhead protection. We have suggested that the risk management program could be adapted to expedite the repairs following an inspection, to include proactive measures to slow the deterioration and to provide superior protection to pedestrians and vehicles at the base of the faces along the streets on the outer perimeter of the site. We believe that the adapted program would minimize risks to building occupants and the public around the site, while affording PWGSC more time to plan the inevitable replacement of exterior cladding on the buildings.”
2.2 NRC comments on previous reporting on brick damage inspection
Upon the first report of brick falling in 1997, there have been numerous studies of the brick cladding and the extent of deterioration, as summarized above. These studies have resulted in recommendations for a program to manage the risks with regular inspection and repair, and use of overhead protection measures around the site. Table 1 presents a listing of the condition assessment studies and repair work related to the brick wall deterioration issue (structural evaluations of buildings not included).
Despite the many inspections that have been conducted between 1997 and 2015, little gain has been made in the understanding of the underlying causes of the observed deterioration and the determination of the deterioration rate. The following discussion will focus on the brick damage aspect of these studies and the gaps noted.
From Table 1,Error! Reference source not found. the following issues can be identified: Some inspection reports (or part of) were not available for review
No studies have focused on identifying the root causes of the observed deterioration
Inspections have been conducted at varying time intervals (may be related to contracting issues) Inspections have been done by different contractors (CABA at first, then JCAL later on), thus using
different approaches
Some repairs have been completed several years after the inspection (may be related to contracting and budget issues)
Different levels of scrutiny were used between contractors (e.g. qualitative vs. quantitative observations)
Different levels of scrutiny were used between inspections of same contractor (e.g. hairline cracks reported (JCAL 2010) vs. not reported (JCAL 2015)
Different ways of reporting observed damage from same contractor (e.g. total number of cracks for all buildings together, vs. % panels with damaged bricks per elevation with no indication of number of bricks per panel, vs. detailed numbering of bricks per elevation)
Of all sets of data collected from the studies listed in Table 1Error! Reference source not found., two rovide detailed information on the number of damaged bricks per building elevation. They are identified in Table 2Error! Reference source not found. for each elevation of each building, as reported by JCAL (2015-1). As observed by JCAL, the number of damaged bricks was higher on East and South building facades compared to the West and North facades, indicating that some of the inherent damage mechanisms depend on the extent of daily temperature changes being the largest, in general,
Table 1 – List of Reports on Condition Assessment of LTDLC brick wall cladding
Work Date
(yyyy-mm)
Report Author & Date
Building
Elevation Scope of work Data status
Brick damage data type
1997-03 CABA (1997-04) Block 300
-Thermographic analysis -Visual inspection -Structural and wall panel analysis
Received4
Qualitative observations of panel cracks and brick splitting
(no numbers given)
1997-12 Larivière Construction All blocks -Emergency inspection
-Replacement of loose bricks missing report 1998-03 CABA & AAR All blocks -Building envelope and structural evaluation missing report 1999-10 JCAL/JWE (1999-10) Blocks 100/200 -Free-fall brick trajectory testing Received
1999-10 CABA (1999-11) Block 200, South
-Structural and thermal study -Inspection of brick walls with sounding
-Replacement of loose bricks -Repair of cracks, joints, ventilation, drainage
missing Appendix 4
1999-12 CABA All blocks -Water infiltration study missing report
2000-03 / 2000-09 JCAL (2000-12) All blocks -Inspection of brick walls -Removal of loose bricks
Incomplete - missing Appendix C
-Total number of damaged bricks -% of panels with damaged bricks
reported for each elevation
2001-04 Morrison Hershfield
(2001-04) Blocks 100/200
-Review of previous work
(excluding JCAL 2000-12 report) No new data
2003-06 / 2003-09 JCAL (2004-03) All blocks -Inspection of brick walls and joints -Removal of loose bricks
Incomplete - Elevation drawings
-Total number of damaged bricks -Qualitative observations of damaged bricks (no numbers given)
2004, spring-fall JCAL (2005-06) Block 200, East -Inspection of brick walls Received
Qualitative observations of panel cracks and brick splitting
(no numbers given)
2005-03 PSPC All blocks -Thermographic study missing report
2009-04 / 2009-11 JCAL (2010-02) All blocks
-Inspection of brick walls -Removal of loose bricks -Recommendations for immediate repairs
incomplete -missing Elevation drawings
Number of damaged bricks reported for each elevation
2010-11 RMA/JCAL (2011-02) Blocks 100/200 -Visual inspection of panel anchors (partial) Received 2012-09 JCAL (2012-10) Block 200 -Review of dismantled panel (NE corner, F21) Received 2013-11 / 2014-09 JCAL (2015-01) All blocks -Inspection of brick walls
-Removal of loose bricks Received
Number of damaged bricks reported for each elevation
2014-09 AAR (2014-09) All blocks -Impact study Received
2015-01 PTVD (2015-01) All blocks -Review of previous work
-Re ie of P“PC’s risk a age e t progra No new data
4 Re ei ed refers to reports o tai ed fro P“PC; issi g reports requested but not received, or portions of report missing; i o plete reports: received but so e i for atio issi g; No new data reports: received and provides a review of previous work
Table 2 – Number of damaged bricks reported by building elevations and time
Building
elevation JCAL (2010-02) JCAL (2015-01)
Block 100 - East 1076 598 Block 100 - South 1548 457 Block 100 - West 654 420 Block 100 - North 530 384 Block 100 - Total 3808 1859 Block 200 - East 1268 281 Block 200 - South 917 326 Block 200 - West 728 271 Block 200 - North 746 249 Block 200 - Total 3659 1127 Block 300 - East 170 28 Block 300 - South 280 112 Block 300 - West 56 29 Block 300 - North 45 68 Block 300 - Total 551 237
All blocks - East 2514 907
All blocks - South 2745 895
All blocks - West 1438 720
All blocks - North 1321 701
All blocks - Total 8018 3223
on the East and South facades. One interesting observation that has not been reported earlier is the clear reduction of this adverse effect from 2010 to 2015. For example, the ratio of damaged bricks between East/South and West/North facades is 1.9 in 2010 and only 1.3 in 2015. This may indicate that the earlier mechanisms of deterioration were more affected by temperature changes compared to the current (perhaps transformed) mechanisms. However, from these limited data (i.e. 2 points in time, and not being sure of the underlying mechanisms), it is rather difficult to determine the rate of brick deterioration or whether it is increasing linearly or exponentially.
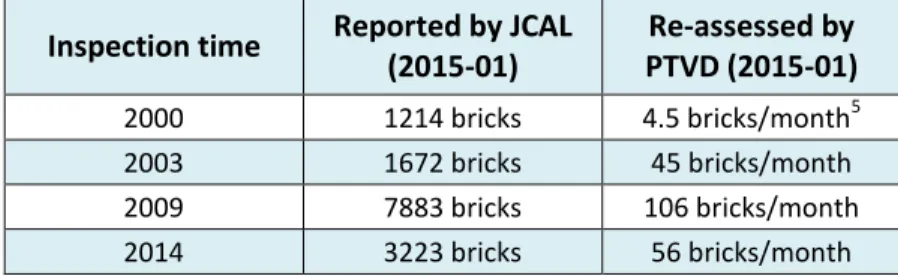
An attempt, however, has been made by PTVD (2015) to assess the rate of brick deterioration by looking at the overall number of damage bricks (all buildings together) from 4 different inspections conducted by JCAL in 2000, 2003, 2009 and 2014. The rates are expressed in terms of number of bricks per month, as the time elapsed during two consecutive inspections (Table 3). As commented by PTVD (2015), the rate of
deterioration from 2000 to 2015 is certainly not exponential but rather increasing at least linearly given the variation in the data that can be expected for this type of work; this review did not consider any repairs that may have been previously made. Nonetheless, the sudden reduction in the rate of brick deterioration from 2010 to 2015 is left somewhat unexplained.
Interestingly, if one averages the rate of damage to bricks over the first 20 years from when the complex was constructed, it appears that the rate is at least an order of magnitude less than the damage rate from 2000 onwards. This suggests that from the onset of observable damage just prior to 2000, the useful life of the façade may indeed have been attained.
Table 3 – Number of damaged bricks over time (all buildings together)
Inspection time Reported by JCAL (2015-01) Re-assessed by PTVD (2015-01) 2000 1214 bricks 4.5 bricks/month5 2003 1672 bricks 45 bricks/month 2009 7883 bricks 106 bricks/month 2014 3223 bricks 56 bricks/month
As concluded by PTVD (2015), it is found that the available data remain insufficient to make a proper determination of the rate of brick deterioration (even when data are grouped from all buildings together). This is partly explained by the following reasons:
Too few data points available over time (even fewer when considering building elevations); Inconsistencies in counting methodology
o Counting errors (i.e. unrepaired bricks observed in 2003 identified as new damage in 2009); o Repaired bricks not included in the observations;
o Inspection periods spanning many months; Changes made to the building envelope
o Replacement of some wall panels on Block 200 (South elevation), thus having a new service life; o Reduced scope of repair work (e.g. damaged bricks repaired or replaced in the early years vs. loose
bricks removed in the later years);
o Application of moisture control strategies to some wall panels (e.g. vertical flashing installed on the South elevation of Block 200).
Analysis of damaged brick units by Block, floor level and façade direction — Since it is possible that
brick damage be related to the height or the floor level of the buildings (e.g. higher wind, stronger driving rain, more sun exposure), the data provided by JCAL during their last 2015 inspection were re-analysed with the number of damaged bricks counted for each floor of each building elevation. Also, the type of damaged bricks was also considered in the analysis (e.g. Type X being a normal brick, Type Y being a row lock brick, and Type Z being a soldier brick).
Figure 2 to Figure 4 represent the number of damaged bricks for each elevation of Blocks 100, 200, and 300, respectively (all brick types together). It is noted that damage to the conventional masonry walls below the 2nd
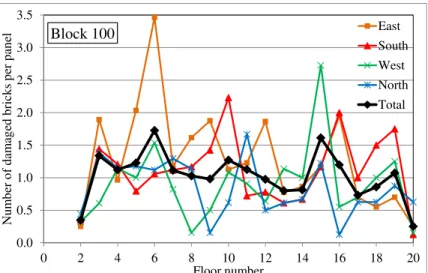
floor level was ignored, since it is outside the scope of this project. It is also noted that the data for the uppermost level of each building represent the damage of the parapet sections only, which is different from a conventional brick wall panel with window opening(s). Before commenting on the rate of observed damage, the data still need to be normalized by the number of single panels (or equivalent) at each floor level, since the lower storeys of Blocks 100 and 200 have a larger number of panels as compared to the fewer panels at higher floor levels. Figure 5 to Figure 7 illustrate the number of damaged bricks per single panel or equivalent (e.g. double panels at Block 200 counted as two single panels) for each elevation of Blocks 100, 200, and 300, respectively.
With reference to Block 100, the total number of damaged bricks per floor level appears to be relatively independent of building height from Floor 3 to Floor 19. Despite some local high peaks (e.g. Floor 6 East,
5
Figure 2 – Number of damaged bricks per floor level – Block 100 (as of 2015)
Figure 3 – Number of damaged bricks per floor level – Block 200 (as of 2015)
Figure 4 – Number of damaged bricks per floor level – Block 300 (as of 2015)
0 25 50 75 100 125 150 175 200 225 0 2 4 6 8 10 12 14 16 18 20 N u m b er of dam ag ed b ri ck s Floor number Block 100 East South West North Total 0 25 50 75 0 2 4 6 8 10 12 14 16 18 20 22 24 26 28 30 N u m b er of dam ag ed b ri ck s Floor number Block 200 East South West North Total 0 25 50 75 0 1 2 3 4 5 6 7 8 N u m b er of dam ag ed b ri ck s Floor number Block 300 East South West North Total
Figure 5 – Block 100(as of 2015) Normalised number of damaged bricks/panel at Floor number
Figure 6 – Block 200 (as of 2015) Normalised number of damaged bricks/panel at Floor number
Figure 7 – Block 300 (as of 2015) Normalised number of damaged bricks/panel at Floor number
0.0 0.5 1.0 1.5 2.0 2.5 3.0 3.5 0 2 4 6 8 10 12 14 16 18 20 Nu m b er o f d am ag ed b ri ck s p er p an el Floor number Block 100 East South West North Total 0.0 0.5 1.0 1.5 2.0 2.5 3.0 3.5 0 2 4 6 8 10 12 14 16 18 20 22 24 26 28 30 Nu m b er o f d am ag ed b ri ck s p er p an el Floor number Block 200 East South West North Total 0.0 0.5 1.0 1.5 2.0 2.5 3.0 3.5 0 1 2 3 4 5 6 7 8 Nu m b er o f d am ag ed b ri ck s p er p an el Floor number Block 300 East South West North Total
Floor 15 West), the rate of damage seems to be slightly higher on the East and South elevations than on the West and North elevation, as reported earlier. With a total number of 1860 single panels, Block 100 has an average number of 1.0 damaged brick per panel.
Regarding Block 200, the total number of bricks per floor level increases steadily from Floor 3 up to Floor 23 and then sharply decreases from Floor 23 to Floor 29. It is noted that Floor 23 corresponds to the level separating the lowest towers from the highest tower, which may indicate that the top portion of the higher tower is in relatively better shape than the lowest portions of Block 200. At the lower floors (up to Level 15), the East and West elevations seem to have higher rate of damage, while at the higher floors (Level 16 and up), only the North elevation remains with a relatively low rate of damaged bricks. With a total number of 1980 single panels (or equivalent), Block 200 has an average number of 0.6 damaged brick per panel. As regards Block 300, the total number of bricks per floor level appears to be relatively independent of the floor level. In the lower floors (up to Level 4), the South elevation has the highest rate of brick damage, whereas the trend reverses for the upper floors (Level 5 and up) where the North elevation clearly has the highest rate of damage. This observation is not typical and may indicate that the damage on the North elevation of Block 300 may be caused by a damage mechanism that is somewhat less dependent on daily temperature differences. On the other hand the total number of damaged bricks on the West side of Block 300 is quite small – 30 bricks for all floor levels (7 levels), which in fact is a small number compared to the other buildings of the complex. Hence for Block 300, it only requires a few additional or fewer damaged bricks of a given type to affect changes to the normalised values at a given floor level; as the absolute number of bricks damaged remains small. With a total number of 329 single panels, Block 300 has an average number of 0.7 damaged brick per panel. This in fact confirms that the extent of damage for Block 300 is quite comparable to panels of the other blocks when normalizing the number of damaged bricks by the number of panels.
Analysis of damage by type of brick unit — The type of damaged bricks was also investigated, since
certain damage mechanisms may affect one type of brick more than others. For example, Types Y and Z bricks, being rowlock and soldier bricks respectively, all have steel reinforcing bars going through their core openings, whereas only a small fraction of Type X bricks have embedded steel bars. It was thought that if the fraction of Type Y or Type Z bricks that were damaged was greater than the fraction of damaged Type X bricks, rebar corrosion might be the prime cause of deterioration for these brick types.
The results shown in Table 4 are the proportion, per panel, of damaged brick of a given type to that of all damaged bricks of the same type. The ratios are arranged in columns by building block (i.e. Blocks 100, 200, 300) and for each block by façade direction (E, S, W, N). The average number of damaged bricks of a given type per panel is also provided as a measure against which to compare the respective values of the proportion of damaged brick units according to Block and façade. As such, comparisons can readily be made to
determine whether, on the basis of the results at hand, there is, e.g., a smaller or a greater proportion of damage that occurs to for type X as compared to either Y or Z type bricks, whether, damage is more prominent or East versus other façade directions, or whether any given Block is itself more prone to having damaged brick units.
It is apparent from the results provided in Table 4 that Type X bricks are consistently failing in proportion to their numbers, suggesting that the mechanism of failure is systematic throughout the respective blocks and different directions. As well, on average, Type Y brick units are failing less than either the Type X or Z bricks. Thus the results do not support the notion that a greater proportion of Type Y or Type Z bricks are damaged as compared to Type X bricks; however, it is shown that the overall proportion of damaged Type Z brick is
Table 4 – Ratio of damaged bricks per panel by type to total number of bricks, by type, per panel (2015 results)
Type of brick Damage proportions for Block 100 Damage proportions for Block 200 Damage proportions for Block 300 Average value E S W N E S W N E S W N Overall Type X (main) 1.00 1.04 0.99 1.08 0.99 0.97 1.04 1.04 1.12 1.15 0.81 1.1` 1.03. Type Y (rowlock) 1.22 0.89 1.00 0.56 0.56 1.00 0.89 0.78 0.00 0.11 0.00 0.22 0.61 Type Z (soldier) 0.60 0.60 1.20 0.40 2.00 1.60 0.60 0.80 0.80 0.00 6.00 0.60 1.27 greater than either the Type X and Y bricks. This is primarily due to the much heightened proportion of damaged bricks on the West elevation of Block 300 (6X that of all Type Z) as well as the amplified
proportion of damaged brick on the East and South facades of Block 200, and to a lesser extent that of the West facade of Block 100; each of these values have been highlighted in the table.
With the exception of Type Z bricks for which a much greater proportion of bricks were found to be damaged (and perhaps corrosion is acting), it may be concluded, in general, that rebar corrosion is not be the prime contributor to the brick damage observed at the LTDLC complex (based on 2015 inspection results).
2.3 Identification of deterioration mechanisms and their impact
Despite the observations of brick failures in previous inspections, the underlying causes of the premature deterioration of the brick walls have not been previously investigated. This step is required for a clear understanding of the deterioration mechanisms in order to make a sound assessment of the deterioration rates and risks, and to propose cost-effective facade maintenance solutions to PSPC.
The wall panels incorporated prefabricated reinforced brick masonry panels, a type of construction that perhaps was not overly common for high-rise building structures built in the mid 70’s. For instance, as shown in force the brick to split and fall off the wall, as observed and reported on several occasions by JCAL. With either a significant increase or decrease in temperature, the different rates of expansion or contraction between the brick and the mortar surrounding the brick may also cause shear stresses in the joints, creating cracks between the bricks. Should cracks form on the four sides of the brick, it will become unstable and loose, and may be at risk of failing. The rebar may not restrain any failed bricks given that the rebar is in the same plane as failed bricks.
The rate of this type of deterioration, if acting alone, is expected to be linearly proportional to temperature changes. When considering daily temperature changes (from direct sunlight to cooler night temperatures), the extent of this type of deterioration is expected to be larger on facades facing South than on those facing North. When considering annual temperature changes (from hot summer to cold winter temperatures), the extent of thermal movement deterioration may be large for all facade orientations. Numerical modelling undertaken at NRC-Construction is to provide more evidence, the results of which for a preliminary modelling study are described in Chapter 3.
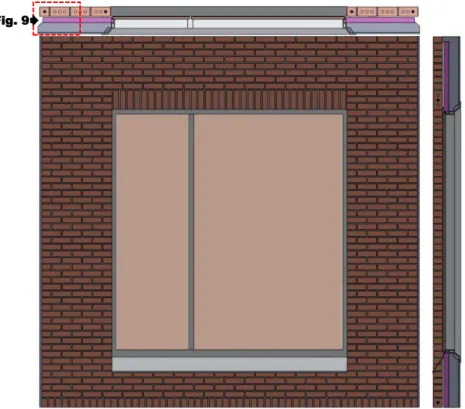
and Figure 9, the wall panel assembly consists of a set of “layers” that include (from interior to exterior): (i) Interior grade gypsum panel directly affixed to; (ii) Reinforced concrete panel; (iii) Extruded polystyrene insulation; (iv) nominal (12 mm) air space, and; (v) prefabricated brick masonry cladding with embedded steel
reinforcing bars located at the edges of window openings and panels. The prefabricated brick masonry cladding is affixed to the concrete panel with a series of shear connectors evenly spaced throughout the concrete panel.
It is supposed that the brick masonry clad pre-fabricated wall panels were cast on a level horizontally surface with the exterior brick facing downwards. The casting method of fabrication would have involved the combining of masonry units, mortar and grout into the prefabricated wall panel6. In general, such a casting
method requires a form or an alignment device, some method of placing units and reinforcement, and a method for introducing mortar or grout. The usual practice is to place the units, either by hand or machine, and fill the form with a grout at atmospheric pressure or under moderate pressure. Jigs and forms provide for the alignment of the brick and the spacing for the joints.
Figure 8 – Elevation view, and horizontal and vertical sectional views of prefabricated brick masonry single-window wall panel
Figure 9 – Horizontal sectional view at joint between adjacent wall panels: (1) Interior finish – 11 mm gypsum panel; (2) 100 mm reinforced concrete panel; (3) Insulation – 50 mm extruded polystyrene; (4) Air space –
12 mm; (5) Exterior cladding – 90 mm reinforced brick masonry
6Brick Industry Association, The (2001), Technical Notes 40 - Prefabricated Brick Masonry – Introduction; Reston, VA, USA, 11 pgs. Fig. 9
Several possible causes of deterioration are being investigated on the basis of materials taken from an actual wall panel specimen that had been extracted from the West face of Block 200. They include: (i) differences in rates of thermal expansion amongst brick units, epoxy mortar (grout) and steel bars; such differences can give rise to stresses and eventual cracking of the brick units and joints due to annual and daily temperature variations; (ii) corrosion of steel bars creating internal pressure and cracking of the surrounding bricks; (iii) moisture absorption and subsequent freeze-thaw action on brick units resulting in cracking; and (iv) stiffness of bricks and mortar which makes them brittle and subject to movement-induced cracking; (v) bowing of wall panels resulting in vertical cracks at the joints between bricks. Each of these causes of deterioration is further explained in the following sections.
Thermal expansion of bricks, mortar and steel — When two bonded materials have dissimilar rates of
expansion, one material will evidently expand, or contract at a different rate than the other when subjected to temperature changes, eventually creating a plane of micro-cracks caused by tensile stresses in one material and compressive stresses in the other leading to failure along the interface between mortar and brick units. Laboratory testing undertaken at NRC-Construction has shown that the brick units have a coefficient of linear thermal expansion that is 2 times lower than that of the mortar, and 3 times lower than that of steel. In this case, with an increase in temperature, the mortar and the reinforcing bar in the brick openings will expand to a greater extent than the surrounding brick. With 3 circular openings well aligned in the brick, a failure plane may also develop through the three holes and parallel to the face of the brick, and force the brick to split and fall off the wall, as observed and reported on several occasions by JCAL. With either a significant increase or decrease in temperature, the different rates of expansion or contraction between the brick and the mortar surrounding the brick may also cause shear stresses in the joints, creating cracks between the bricks. Should cracks form on the four sides of the brick, it will become unstable and loose, and may be at risk of failing. The rebar may not restrain any failed bricks given that the rebar is in the same plane as failed bricks. The rate of this type of deterioration, if acting alone, is expected to be linearly proportional to temperature changes. When considering daily temperature changes (from direct sunlight to cooler night temperatures), the extent of this type of deterioration is expected to be larger on facades facing South than on those facing North. When considering annual temperature changes (from hot summer to cold winter temperatures), the extent of thermal movement deterioration may be large for all facade orientations. Numerical modelling undertaken at NRC-Construction is to provide more evidence, the results of which for a preliminary modelling study are described in Chapter 3.
(i) Corrosion of steel reinforcement — When steel reinforcement is exposed to moisture and oxygen, a
protective corrosion layer will form on the surface of the bar and a passive corrosion rate will develop. When this passive protection layer is destroyed by exposure to aggressive ions such as chlorides or by concrete carbonation, an active and more aggressive corrosion rate will ensue. As a result, the rust accumulating around the reinforcing bar will occupy a larger volume than the volume of steel it replaces, thus increasing radial tensile stresses in the surrounding material mortar or concrete that eventually leads to cracking. Corrosion of steel reinforcement also weakens the bar due to a reduced cross-section.
The results from laboratory testing completed at NRC-Construction will permit determining the rate of corrosion of steel bar samples taken from the wall panel specimen; these will be provided in a final report. In the case where a rebar is embedded in the mortar inside a brick opening, the corrosion product forming around the rebar over time will create pressure in the brick, and may result in cracking of the embedded mortar and surrounding brick. The cracking will most likely be parallel to the rebar, i.e. vertical in normal horizontal bricks, and horizontal in the vertical rowlock and soldier bricks.
The rate of this type of deterioration, if acting alone, is expected to depend on the availability of moisture and the ambient temperature, since corrosion is activated by moisture and its rate increases under higher temperatures. When considering the building facade orientation, higher corrosion rates of the steel reinforcement may be higher on East and South facades, since East facades are more exposed to driving rain and South facades are more exposed to elevated temperatures from direct sunlight. This type of deterioration has been observed to be more frequent on East and South facades. Numerical modelling from which the effects of corrosion products on the adjacent mortar and brick elements can be discerned will provide more evidence and from which conclusions could be drawn as to the significance of this deterioration mechanism to that of the brick masonry panels.
(ii) Moisture absorption and freeze-thaw resistance of bricks — Porous materials when saturated and
subjected to cycles of freezing and thawing may deteriorate as water expands to form ice inside the pores and creates internal pressures, should the water not be capable of readily escaping from the pores; this process may result in crack formation as the number of freeze-thaw cycles increases. It is generally understood that porous materials with well-connected pores may have increased resistance to freeze-thaw cycles since freezing water can expand without being constrained in isolated pores.
The results from laboratory testing completed at NRC-Construction are intended to demonstrate the resistance of the bricks to freeze-thaw action and from this infer as to whether the pore structure is, or is not, a well-connected network of pores on the basis of their freeze-thaw performance (poor performance indicative of a poorly connected network and good performance a well-connected pore structure). However it is not yet evident how many cycles these bricks can withstand under conditions that have prevailed at LTDLC over the years. The number and severity of the freeze-thaw cycles over the life of the LTDLC complex will be estimated to better understand the relative importance and the impact of this type of deterioration on the overall deterioration of the brick masonry wall panels.
The rate of this type of deterioration is expected to depend on the number of freeze-thaw cycles and the availability of moisture. Considering the building facade orientation, more severe deterioration due to freeze-thaw cycles may be found on East and South facades, since it is known that East facades of the complex are more exposed to driving rain than others, as this is the predominant wind-driven rain direction. Whereas, South facades are subjected to higher surface temperatures thus resulting in greater surface temperature differences over a daily cycle as compared to, for example, North facades. A large specimen assembly of several brick units and incorporating steel reinforcing bar will be tested at NRC-Construction under freeze-thaw cycles to provide more evidence of the response of brick assembly to freeze-freeze-thaw action and from which conclusions can ultimately be drawn.
(iv) Stiffness of bricks and mortar — A material with a high modulus of elasticity can carry high loads with
only a small deformation. A side effect is that such type of material is typically brittle and may easily crack when deformations become too large, beyond their capability to accommodate strain.
Results from laboratory testing (Table 6) have shown that both the brick and mortar used have high values of modulus of rupture (Brick: 4.7 MPa) or tensile splitting strength (Mortar/Grout: 14.8 MPa). These materials may display very brittle behaviour, thus being prone to cracking when high forces and/or significant deformations are imposed on them. As a result, a small deformation (caused by thermal dilatation) may induce a flexural crack in the brick or a shear crack in the mortar joint between two adjacent bricks. Given that the mortar itself is stiff, it is also possible that loads and movement on one brick are directly transferred to an adjacent brick as opposed to being accommodated at the joint where the jointing material is less stiff,