Publisher’s version / Version de l'éditeur:
Langmuir, 32, 24, pp. 6105-6114, 2016-05-26
READ THESE TERMS AND CONDITIONS CAREFULLY BEFORE USING THIS WEBSITE. https://nrc-publications.canada.ca/eng/copyright
Vous avez des questions? Nous pouvons vous aider. Pour communiquer directement avec un auteur, consultez la
première page de la revue dans laquelle son article a été publié afin de trouver ses coordonnées. Si vous n’arrivez pas à les repérer, communiquez avec nous à [email protected].
Questions? Contact the NRC Publications Archive team at
[email protected]. If you wish to email the authors directly, please see the first page of the publication for their contact information.
NRC Publications Archive
Archives des publications du CNRC
This publication could be one of several versions: author’s original, accepted manuscript or the publisher’s version. / La version de cette publication peut être l’une des suivantes : la version prépublication de l’auteur, la version acceptée du manuscrit ou la version de l’éditeur.
For the publisher’s version, please access the DOI link below./ Pour consulter la version de l’éditeur, utilisez le lien DOI ci-dessous.
https://doi.org/10.1021/acs.langmuir.6b01376
Access and use of this website and the material on it are subject to the Terms and Conditions set forth at
Correlating cellulose nanocrystal particle size and surface area
Brinkmann, Andreas; Chen, Maohui; Couillard, Martin; Jakubek, Zygmunt J.;
Leng, Tianyang; Johnston, Linda J.
https://publications-cnrc.canada.ca/fra/droits
L’accès à ce site Web et l’utilisation de son contenu sont assujettis aux conditions présentées dans le site LISEZ CES CONDITIONS ATTENTIVEMENT AVANT D’UTILISER CE SITE WEB.
NRC Publications Record / Notice d'Archives des publications de CNRC:
https://nrc-publications.canada.ca/eng/view/object/?id=df1fceea-c08d-4b99-8897-d9370e2db3c7 https://publications-cnrc.canada.ca/fra/voir/objet/?id=df1fceea-c08d-4b99-8897-d9370e2db3c7Correlating Cellulose Nanocrystal Particle Size and Surface Area
Andreas Brinkmann,
*
,†Maohui Chen,
†Martin Couillard,
‡Zygmunt J. Jakubek,
†Tianyang Leng,
†,§and Linda J. Johnston
*
,†,§†
Measurement Science and Standards and‡
Energy, Mining and Environment, National Research Council Canada, Ottawa, ON K1A 0R6, Canada
§
Department of Chemistry, University of Ottawa, Ottawa, ON K1N 6N5, Canada
*
S Supporting InformationABSTRACT: Cellulose nanocrystals (CNCs) are negatively charged nanorods that present challenges for characterization of particle size distribution and surface areatwo of the common parameters for characterizing nanomaterials. CNC size distributions have been measured by two microscopy methods: atomic force microscopy (AFM) and transmission electron microscopy (TEM). The agreement between the two methods is good for length measurements, after taking into consideration tip-convolution effects for AFM. However, TEM widths are almost twice as large as AFM heightsan effect that we hypothesize is due to counting of a larger fraction of laterally associated CNCs in the TEM images. Overall, the
difficulty of selecting individual particles for analysis and possible bias due to selection of a specific particle size during sample deposition are the main limitations associated with the microscopy measurements. The microscopy results were compared to Z-average data from dynamic light scattering, which is a useful method for routine analysis and for examining trends in size as a function of sample treatment. Measurements as a function of sonication energy were used to provide information on the presence of aggregates in the sample. Magic-angle-spinning solid-state NMR was employed to estimate the surface area of CNCs based on the ratio of integrated spectral intensities of resonances stemming from C4 sites at the crystallite surfaces and from all C4 sites. Our approach was adapted from the application of solid-state NMR to characterize larger cellulose microfibers and appears to provide a useful estimate that overcomes the limitations of using the BET method for measuring surface areas of highly aggregated nanomaterials. The solid-state NMR results show that the lateral dimension of the CNCs is consistent with that of elementary cellulose crystallites.
■
INTRODUCTIONCellulose nanocrystals (CNCs) can be prepared from many types of cellulose biomass, including trees, annual plants, bacteria, algae, and tunicates, as described in several recent reviews.1−5 Wood-based CNCs are produced by an initial mechanical process that breaks down the plant cell wall followed by either an acid hydrolysis or oxidation step that selectively degrades amorphous cellulose and liberates the crystalline regions. Variations in the CNC extraction process lead to different CNC properties.6,7 Most commonly used preparation methods introduce surface functional groups such as sulfate half-esters or carboxylates that give the particles a negative surface charge and lead to formation of stable colloidal suspensions.2−4,8,9 CNCs are rod-shaped particles with a high aspect ratio (typically 20−50, based on lengths of 100−200 nm and widths of 3−5 nm for wood pulp CNCs), high surface area, and high mechanical strength. These characteristics, as well as their ease of surface functionalization and ability to self-assemble to give chiral nematic liquid crystals and solid films, make them attractive for a wide range of applications, including nanocomposites, biomedical products, rheological modifiers,
paints, and thin films.2,10,11 Furthermore, since they are generated from an abundant biopolymer, they are renewable as well as biodegradable and have so far shown limited environmental health and safety issues.12−14
CNCs and other cellulose nanomaterials have attracted a lot of interest and have the potential to provide new high-value products from the forestry industry. Realizing their potential applications will require the development of relatively inexpensive and rapid characterization methods that can be used for routine quality control during production as well as methods for more detailed metrological characterization. Particle size distributions and surface area measurements are identified as key challenges along with methods for analyzing CNC surface chemistry and for detecting and characterizing CNCs in complex environments for environmental health and safety monitoring.15 Measurement of CNC particle size distributions has many of the same challenges that are
Received: April 10, 2016
Revised: May 18, 2016
Published: May 26, 2016
Article
pubs.acs.org/Langmuir
Published 2016 by the American Chemical
Society 6105 DOI:10.1021/acs.langmuir.6b01376
encountered for other nanomaterials.16These include the fact that particle size is a method-determined measurand, the relatively broad size distributions for most CNCs, and the tendency of CNCs to form aggregates and agglomerates; in addition, measuring particle size distributions by ensemble methods such as dynamic light scattering is challenging for high aspect ratio CNCs. The tendency of dry CNCs to form large and tightly packed aggregates has so far limited estimates of their surface area to calculations based on average particle size.17
Here we report a detailed study of particle size distributions for CNC suspensions by atomic force microscopy (AFM), transmission electron microscopy (TEM), and dynamic light scattering (DLS), examining the effect of particle selection and sonication on the results obtained. This study highlights some of the issues that are important both for obtaining reproducible and comparable data from the various methods and for establishing statistical differences between samples. We have also used solid state NMR to assess whether signals assigned to different chemical environments for the C4 carbons can be used to obtain information on the surface area of CNCs for hydrated (20−25 wt % CNC) samples. Although a similar approach has been used to estimate the specific surface area for fibrils and fibril aggregates in various wood pulps, its extension to CNCs is less straightforward, and the limitations of this approach are summarized. The estimates of surface area from the NMR data are compared to the values calculated from the average particle size measured by microscopy and to the (much lower) surfaces areas obtained by BET gas adsorption for dry, highly aggregated CNCs.
■
EXPERIMENTAL SECTIONMaterials. Cellulose nanocrystals were NRC certified reference
materials (http://www.nrc-cnrc.gc.ca/eng/solutions/advisory/crm/
list_product.html#IO-N) and were prepared from bleached softwood kraft pulp by sulfuric acid hydrolysis, followed by sodium exchange. CNCS-1 is a 6.8 wt % suspension in deionized water, and CNC-1 is dry powder prepared by spray drying. The CNC suspension was used for all experiments, except for NMR, for which both dry CNCs and suspensions were used, and for BET, which used dry CNC. For comparison, some data were also obtained for a CNC suspension obtained from a different source (CNC-M, 11.8 wt % CNC prepared from wood pulp by sulfuric acid hydrolysis; purchased from University of Maine and produced by USDA Forest Products Lab). Rehydrated CNC-1 samples for NMR were prepared by adding deionized water to dry CNCs, mixing manually, and letting sit overnight to obtain uniform samples: CNC-1R1, 250 mg CNC/mL water, and CNC-1R2, 350 mg/mL. For NMR experiments, CNCS-1 was centrifuged to isolate CNC as a gel that was transferred to the NMR rotor.
Uranyl acetate was obtained from Electron Microscopy Sciences as
a 2 wt % solution. Poly(L-lysine) (PLL) was obtained from
Sigma-Aldrich. Deionized water (Milli-Q; 18.2 MΩ·cm) was used for dilution of CNC suspensions and for washing samples.
AFM. Samples were deposited on poly(L-lysine)-coated mica
prepared by placing 200 μL of 0.01 wt % PLL on freshly cleaved mica (1 in. × 1 in.), incubating for 30 min in a closed dish, and then rinsing five times with water and drying in a nitrogen stream. The
CNC suspension (either CNCS-1 or CNC-M) was diluted with water (1:10000), and 80 μL was deposited on PLL-coated mica. After 1.5 min incubation, the samples were washed with deionized water and air-dried. Samples were imaged at room temperature (21−23 °C) in air using a PicoSPM atomic force microscope (Molecular Imaging) for which the calibration was verified with standard grids (TDG01 and TGZ1 from NT-MDT for x−y and z, respectively) prior to use. Magnetic-coated silicon tips (MAC Levers Type VII) with nominal spring constants of 0.14 N/m were used. Applied forces were maintained within a range where the measured sample height was independent of applied force, as verified by measuring images at several different set points. Three independently prepared samples were imaged with 10−15 images recorded for each sample for CNCS-1. Images were flattened and analyzed manually using Gwyddion software to obtain the length and height for individual CNCs. This was done by extracting profiles, drawing a line through the long axis of the crystal, and measuring the length as the distance between the intersection of the line profile with the background. The height was measured as the maximum region of the profile ignoring any single point noise spikes and subtracting background where necessary. The
number of individual particles analyzed is listed inTable 1(CNCS-1).
For CNC-M, 12 images were collected with 258 particles analyzed. The distributions were tested using the Kolmogorov−Smirnov test. The width of the size distribution was calculated as the standard deviation of the distribution.
TEM.Carbon film covered copper grids (10 nm film thickness, 200
mesh, Ted Pella 01840-F) were used for imaging CNC samples. The grids were exposed to shielded plasma for 2 min (Fischione Model 1070) to increase their hydrophilicity. One drop of the CNCS-1 suspension diluted 1:50 in deionized water was placed on a grid for 4 min and wicked away with a filter paper. The sample was rinsed twice with deionized water by placing a drop of water on the grid and wicking it away with a filter paper. Finally, the sample was stained by depositing a drop of 2% uranyl acetate solution on the grid for 5 min and wicking the excess solution away with a wet filter paper. The grid was left to air-dry before insertion into the microscope.
Images were recorded with an FEI Titan3 80-300 transmission electron microscope operated at 300 kV and analyzed semiautomati-cally using an ImageJ custom macro requiring operators to indicate particle end points for length and side edges for width measurements. The length was measured using a straight line between the two ends of the crystal. The width was measured at the midpoint unless a particle was asymmetric, in which case the widest point was measured. 100 images were collected, and the number of particles analyzed is noted in
Table 2.
Table 1. AFM Length and Height Measurements for CNCS-1 with Two Independent Analyses of the Same Set of Images (Data Sets 1 and 2)
data set N length meana(nm) width of length distribution a
(nm) height meana(nm) width of height distribution a
(nm)
1 300 91.0 1.9 32.4 1.3 4.19 0.07 1.17 0.05
2 285 87.6 1.7 28.4 1.2 4.35 0.08 1.30 0.06
aEach pair of numbers is the value and the corresponding standard error. Distribution widths are determined as the standard deviation.
Table 2. TEM Length and Width Measurements for CNCS-1 with Two Independent Analyses of the Same Images but Different Selections of Particles
data set N length meana (nm) width of length distributiona (nm) width mean a (nm) width of width distributiona (nm) 1 411 66.5 1.4 26.5 1.0 8.0 0.09 1.8 0.06 2 287 75.2 1.7 26.9 1.2 7.1 0.09 1.5 0.06
aEach pair of numbers is the value and the corresponding standard
DLS. An aliquot of CNC suspension (∼1000 mg; CNCS-1 or CNC-M) was diluted to 2 wt % in a 50 mL centrifuge tube and sonicated using a Cole-Parmer 130 W ultrasonic processor equipped with a 1/4 in. tip with sonication energy input that varied from 0 to 10 000 J/g CNC. The sonicated suspensions were then diluted with water and 50 mM NaCl to give suspensions that were 0.05 wt % in 5 mM NaCl. Samples were filtered through a 0.45 μm PVDF filter prior to DLS measurements using a Malvern Zetasizer Nano ZS. Samples were equilibrated in the instrument for 180 s and measured at 25 °C; each sample was measured three times, with each measurement consisting of 50 10-s-long runs, and the measurements were averaged together. The dispersant refractive index was 1.330, and the viscosity was 0.8872 cP. The data were processed using the cumulants analysis method in the Malvern software.
NMR.Cross-polarization magic-angle-spinning (CP-MAS)18
solid-state NMR experiments were performed at an external field of 11.75 T on a Bruker Avance III spectrometer console. The experiments on dry CNC-1 were performed at a sample spinning frequency of 17 kHz utilizing a Varian 3.2 mm double-resonance probehead, whereas the experiments on the never-dried CNCS-1 and rehydrated CNC-1R1 and CNC-1R2 samples were done at MAS frequency of 4 kHz using a Varian 4 mm double-resonance probehead. Single contact ramped
CP19experiments with a contact time of 0.8 ms were performed using
proton decoupling with the help of the XiX sequence20,21during the
detection of the13C NMR signal. We confirmed that the RAMP-CP
spectra were quantitative by comparing them to multiple contact
RAMP-CP experiments.22 A sample of adamantane was used as
secondary reference for the13C chemical shift scale. The resonance of
the adamantane methylene group is found at 37.77 ppm.23The13C
CP-MAS spectrum of the dry CNC-1 sample was deconvoluted by
fitting in total 13 Pseudo-Voigt line shapes using the Levenberg−
Marquardt algorithm as follows: 3 peaks into the C1 spectral range, 3 peaks into the C4 area, 4 peaks into the C2,3,5 range, and 3 peaks into the C6 region. In the case of the never-dried and rehydrated samples, due to the higher spectral resolution, we solely deconvoluted the C4
spectral area following the approach of Larsson24,25for wood pulp: 3
Lorentzian and one Gaussian line shapes were used to fit the C4 crystallite core region, and 3 Gaussian line shapes were used to fit the C4 crystallite surface region. The fitting employed the Levenberg− Marquardt algorithm. It should be noted that Atalla and VanderHart have cautioned about Larsson ’s deconvolution procedure as the fitting of the C4 spectral region is far from unique and sensitive to the fit’s
starting parameters.26 As a result, the values obtained for the signal
integrals and the derived values for the lateral dimension and specific surface area will be subject to significant errors. Therefore, we generated a large set (400 000) of randomly distributed groups of starting parameters and fitted the resonance lines for each group of parameters. The overall best fit was considered the “global” optimum, and its results are reported here.
BET Specific Surface Area. The specific surface area was determined by the Brunauer−Emmett−Teller (BET) method from nitrogen gas adsorption isotherms at 77 K using an ASAP 2000 surface area and porosity analyzer (Micrometrics, USA). A nominal test mass of 0.5−1.0 g CNC-1 was transferred to a sample cell and exposure of the sample to temperatures significantly above room temperature or to high humidity was avoided throughout the procedure. Following a preliminary evacuation, the sample cell was backfilled with nitrogen (Ultra High Purity, 99.999% purity) and subsequently outgassed at
room temperature for 24 h to less than 10−5Torr to remove adsorbed
impurities acquired during ambient exposure. A nitrogen isotherm at 77 K was measured with an empty sample cell, and the corrected free
space values as well as nitrogen nonideality parameter (5.5 × 10⁻⁵)
were determined. Five isotherms were acquired, all most closely resembling IUPAC type IIa isotherms. Prior to each isotherm acquisition, the sample was thoroughly outgassed at room temper-ature. The instrument operation was validated using a silica−alumina reference sample provided by the instrument manufacturer (P/N: 004-16821-00, Lot: A-501-30). An average adsorbate (nitrogen) area per
molecule of 0.162 nm2 is used for the determination of the CNC
specific surface area.27
■
RESULTS AND DISCUSSIONCNC Morphology.The CNC morphology was assessed by both AFM and TEM of samples prepared by depositing dilute suspensions of CNCS-1 on either polylysine-coated mica (AFM) or carbon-film-coated copper grids (TEM). Figure 1
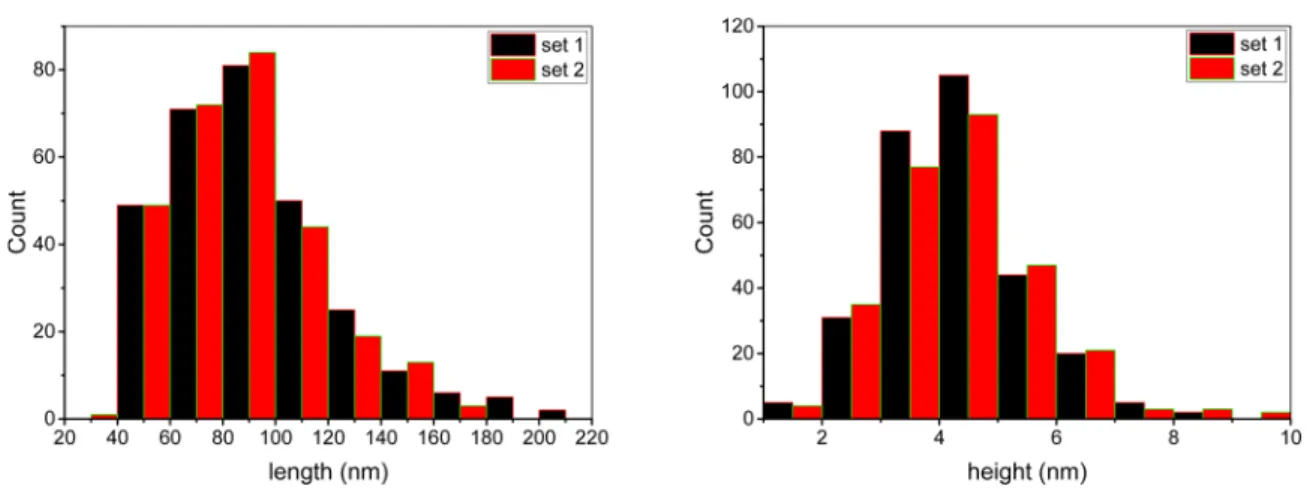
shows representative AFM images which have both individual CNCs and small agglomerates, similar to results obtained in other studies.28,29 The individual CNCs have an irregular surface with tapered ends, with the height varying by as much as 1 nm when measured at different positions along the long axis of the particle (Figure 1).30Data obtained by analysis of multiple images give the histograms for particle length and height shown inFigure 2. Only CNCs that were judged to be single particles were measured and included in the histograms. The selection of single isolated particles is somewhat subjective, as illustrated by the two data sets shown inFigure 2, which were obtained by independent analysis of the same images by two analysts who were instructed to measure all individual (nontouching) particles in each image.
The length and height measurements were analyzed to calculate the mean and width of the size distributions and their associated standard errors which are summarized inTable 1for CNCS-1. The two data sets give mean, distribution width of 91.0, 32.4 and 87.6, 28.4 for length and 4.19, 1.17 and 4.35, 0.08 nm for height. Kolmogorov−Smirnov tests show that the two length and two height distributions are not significantly different at the level 0.05. The p values are 0.30 and 0.06 (data set 1) and 0.37 and 0.37 (set 2) for the length and height distributions, respectively, and both length and height distributions can be considered as log-normal.
Representative TEM images (Figure 3) show both isolated and agglomerated CNCs, similar to the AFM results. Two analysts independently analyzed the same set of images, with instructions to measure only single isolated particles. As for AFM, the fits to a log-normal distribution were assessed; although the length measurements for both data sets were consistent with log-normal distributions, neither log-normal nor normal distributions fit the width data sets at the 0.05 significance level. It was also concluded that the two data sets for both length and width measurements were drawn from
Figure 1.AFM images of CNCS-1 deposited on mica.
Langmuir Article
DOI:10.1021/acs.langmuir.6b01376
Langmuir2016, 32, 6105−6114
different distributions, suggesting an analyst effect for the TEM data analysis.
The means and widths of the length and width distributions determined from the TEM measurements are summarized in
Table 2along with the standard errors. The CNC mean particle lengths for the two data sets were 66.6 and 75.2 nm, indicating slightly shorter particles than measured by AFM. However, the AFM lengths were not corrected for tip-particle convolution which would result in an overestimate of the actual length; for the tips used here the convolution effect could lead to as much as a 10 nm larger size, assuming a spherical profile for the end
of the CNC. Therefore, a substantial cause of the apparent difference in length is likely to be the tip convolution effect. The average length is similar to the smaller values reported in the literature for wood pulp derived CNCs, which vary between 65 and 120 nm.28,31,32 The variations in size may reflect differences between samples, although one cannot rule out a contribution from selection of specific particle sizes either in the sample deposition or during the analysis. The average widths measured by TEM (8.0 and 7.1 nm for the two data sets) are larger than the height measurements from AFM. There are several possible explanations for this difference. First,
Figure 2.Length (left) and height (right) histograms of two independent analyses of the same set of AFM images for CNCS-1.
Figure 3.Representative TEM images of uranyl acetate-stained CNCS-1 on a carbon-film-coated (10 nm) copper grid. Length and width histograms
although CNCs from some cellulose biomass sources have an asymmetric (rectangular) cross section, the model for the terminal enzyme complex in wood predicts a CNC structure with a 6 × 6 array of polysaccharide chains.3This model gives an approximately 4 nm cross section, which is in good agreement with the average height measured by AFM. A previous AFM study found that the average height of wood pulp CNCs was approximately 1.4 nm less than the width after deconvolution using codeposited gold nanoparticles to assess the probe size, providing some evidence for an asymmetric cross section.29 However, the deconvolution process may introduce additional errors, given the irregular shape of the CNC particles and their broad size distribution. As a second possibility, the different contrast mechanisms and the require-ment for staining may lead to different apparent sizes for AFM height and TEM width. Nevertheless, this is unlikely to account for the 3−4 nm differences observed here.
We hypothesize that a third explanation is more likely for the large difference between AFM height and TEM width, namely that a significantly higher number of laterally associated CNC particles are counted in the TEM measurements. This could be caused by problems with distinguishing individual features as one vs two particles due to the relatively low TEM contrast for CNCs (see Figure S1). Alternately, increased agglomeration due to either the sample deposition process or the uranyl acetate staining may lead to a higher fraction of aggregated particles for TEM than for AFM. A recent TEM study of the effects of deposition conditions concluded that higher pH, the use of hydrophobic grids, and staining with uranyl acetate all resulted in increased CNC widths. For example, CNC widths that varied from 5.2 to 19 nm were observed, depending on the sample preparation.33An earlier study found that TEM widths
for cotton CNCs were 3−4 times larger than the height measured by AFM, leading to the conclusion that the measured particles were composed of several laterally associated elementary crystallites that were 3−4 nm in cross section.28
A similar conclusion was reached for wood pulp CNCs, based only on TEM measurements. The authors hypothesized that sample preparation was probably responsible for the lateral aggregation of the crystallites. In the present study, the observations that the TEM width is close to a factor of 2 larger than the AFM height and the width of the TEM distribution is approximately √2 larger than the AFM distribution standard deviation also argue for lateral association
of CNCs, at least in the TEM samples. Note that there are many studies in which either AFM or TEM was used to determine CNC particle size distributions, and there appears to be a trend toward larger widths (TEM) than heights (AFM).28,29,31,34−36 However, it is not possible to draw a definite conclusion from the literature data since different samples and sample preparation methods were used in the various studies. A very recent study has provided evidence from small-angle neutron scattering for lateral aggregation of CNCs in suspension.37
The size distribution of CNCS-1 was also assessed by DLS for 0.05 wt % suspensions in 5 mM NaCl. The measured Z-average (hydrodynamic diameter of a sphere with the same translational diffusion coefficient) and polydispersity index were 81.8 nm and 0.162. The Z-average and polydispersity decreased with sonication energy of the suspension with values of 59.8 and 0.161 being obtained at 10 000 J/g CNC (Figure 3). This result is consistent with earlier studies of the effects of sonication on CNC particle size.38−40Interestingly, the effects
of sonication on the AFM particle size showed the reverse trend with a larger length (distribution mean and width of 107.8 and 35.4 nm) measured after sonication compared to the initial suspension (89.6 and 29.9 nm; separate sample from that inTable 1). The sizes obtained from DLS and AFM cannot be compared directly, since DLS provides an equivalent hydro-dynamic diameter and an intensity weighted distribution whereas microscopy gives a number weighted distribution. However, one expects to see the same trend for changes in size as a function of sonication energy. One possible explanation for the opposite trends from the AFM and DLS size data is that dispersion of agglomerates increases the number of larger individual particles available for AFM analysis. A previous TEM study has concluded that sonication (up to 5000 J/G) disrupts aggregates but does not break individual CNCs.39
Finally for comparison, a CNC suspension from a different source (CNC-M) was analyzed by both AFM and DLS. The Z-average for the unsonicated suspension was 150 nm, larger than the values obtained for CNCS-1. This is consistent with the presence of larger agglomerates in the sample which was diluted from a more concentrated suspension (11.8 wt % vs 6.8 wt % for CNCS-1). However, analysis of AFM results for CNC-M gave average length and height of 89.5 and 4.1 nm, with distribution widths of 38.3 and 1.1 nm, similar to the data for CNCS-1 shown inTable 1. This result can be explained by the
Figure 4. Z-average values (in nm) for CNCS-1 (left) and CNC-M (right) as a function of sonication energy (in J/g of CNC). Each point is an average of three measurements, and the error bars correspond to two standard deviations of the measurements. The red solid line indicates the best
fit to a biexponential decay function.
Langmuir Article
DOI:10.1021/acs.langmuir.6b01376
Langmuir2016, 32, 6105−6114
fact that only individual CNCs are included in the AFM size distribution while any aggregates not removed by a 0.45 μm filter are included in the DLS size determination. Sonication of CNC-M (Figure 4) resulted in a rapid decrease in CNC size with a Z-average of ∼65 nm being obtained at 10 000 J/g, which is larger than the value obtained for CNCS-1. Although the dependence of Z-average on sonication energy could be fit to a biexponential function for both CNCS-1 and CNC-M, the latter sample showed a larger rapid decrease in size at low sonication energies. This is consistent with the presence of a larger number of easily disrupted agglomerates or aggregates for the 11.8 wt % sample.
CNC Surface Area: BET Measurements. The specific surface area was determined by the Brunauer−Emmett−Teller (BET) method from nitrogen gas adsorption isotherms at 77 K using a surface area and porosity analyzer.41The isotherms for dry CNC-1 (Figure S2) resembled those for IUPAC type IIa isotherms and gave a value of 1.29 ± 0.10 m2/g for the specific
surface area. Note that this is more than 2 orders of magnitude lower than values estimated from the average particle size (e.g., 419 m2/g was calculated for CNCs with dimensions of 6 nm ×
6 nm × 180 nm17) and indicates that the large aggregates or agglomerates (dimensions of micrometers or larger) found in dry CNC33,42,43 have a very low accessible surface area. The importance of agglomeration during drying has also been noted in studies of surface areas for other types of cellulose materials.24
NMR Measurements. It has been shown in the literature24−26,35,44−50 that 13C CP-MAS solid-state NMR
spectroscopy is a powerful tool to characterize cellulose fibers and the morphology of their components. Most importantly, Wickholm et al.25showed that the 13C CP-MAS spectrum of
cellulose is quantitative for CP contact times larger than 600 μs.
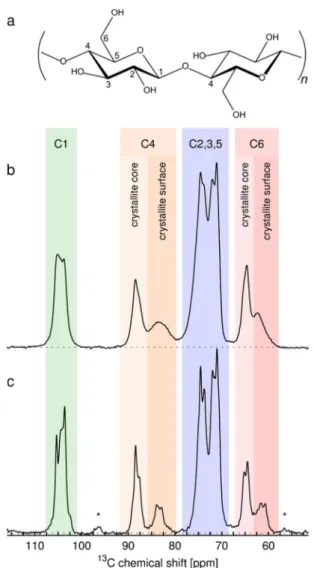
Figure 5 shows typical 13C CP-MAS spectra of dried and
hydrated CNC samples together with the chemical structure of cellulose. The assignment of the different 13C resonances to
cellulose I carbon sites according to the literature45,47 is indicated at the top of the NMR spectra: The resonances arising from the C6 carbon sites are found in the region 58−68 ppm, C2/C3/C5 peaks in the region 69−79 ppm, C4 resonances in the region 80−92 ppm, and C1 peaks in the region 100−110 ppm. The experimental13C solid-state NMR
spectra of CNC consist of sharp resonance lines that resemble the spectrum of a mixture of cellulose crystal polymorphs Iα and Iβ. In Figure 5, it can be observed that the spectrum of never-dried CNC (CNCS-1) shows overall sharper resonance lines compared to the spectrum of dry CNC due to the increased molecular motions in the hydrated samples. The same applies to the 13C spectra of rehydrated CNC samples (CNC-1R1 and CNC-1R2) which are very similar to the CNCS-1 spectrum. Furthermore, next to sharp C4 and C6 resonance lines in the regions 86−92 and 63−68 ppm, broad wings can be observed at smaller chemical shifts, in the case of C4 in the region 80−86 ppm and in the case of C6 in the region 58−63 ppm. The sharp C4 and C6 resonance lines stem from the highly crystalline inner part of the fibrils, whereas the broad wings were attributed to crystallite surfaces and less ordered cellulose by Atalla and VanderHart.49 Subsequent studies by Newman et al. and the group at the former Swedish Pulp and Paper Research Institute (STFI), now Innventia AB, concluded that signals from crystal surfaces both accessible and inaccessible to moisture primarily contribute to the C4 broad wings.25,51,52 Nevertheless, in the literature the ratio of
integrated signal intensity of the C4 wings and the total C4 area has been used to characterize the crystallinity of cellulose samples.53−58 Consequently, the resulting “crystallinity index” value as determined by this solid-state NMR approach is considerably lower than the value determined by X-ray diffraction.
In the case of the dry CNC sample (CNC-1) the broad C4 wing does not show any resolved resonances (compareFigure 5a). We define as q the ratio of the spectral integral of the C4 wings and the total of the C4 resonances (sharp and broad):
= q I I (C4) (C4) TS tot (1)
where the subscript “TS” refers to “total surface”, indicating that the integral ITS(C4) of the complete C4 wing is used in the
calculation, shown in orange inFigure 6a. Itot(C4) denotes the
total integral of all resonances in the C4 region of the spectrum, i.e., sharp and broad resonances. In order to improve the precision of integration of the C4 resonances in dried cellulose, the C4 spectral region may be deconvoluted as shown inFigure 6a, where details may be found in the Experimental Section. With the help of the ratio q the “crystallinity index” can be
Figure 5.(a) Chemical structure of cellulose, where the labeling of the
different carbon sites is indicated. (b)13C CP-MAS spectrum of dry
CNC (CNC-1). (c) 13C CP-MAS spectrum of never-dried CNC
(CNCS-1). The assignment of the13C resonances is depicted on top
defined as CI = 1 − q, which is solely a measure of the inner crystallite volume, as the combination of signals stemming from crystallite surfaces and amorphous cellulose contribute to the integral of the broad C4 wing. Hence, the resulting CI values will be lower than one might expect from the dimensions of the crystallites.
According to Newman and the group from the STFI with the help of the ratio q the average lateral fibril dimension ⟨afibril⟩of
an elementary cellulose crystallite fibril may be calcu-lated.24,25,59
⟨afibril⟩ =2q−1(1 + 1−q)×0.57 nm (2)
where a quadratic cross section of the fibril is assumed and 0.57 nm corresponds to the average distance between the lattice planes perpendicular to the cellulose chain direction.60 The specific surface area of the fibrils σfibrilcan be calculated as
σ ρ = ⟨a ⟩ 4 fibril fibril (3)
where ρ is the density of cellulose I (1500 kg/m3).24,44
In the case of hydrated CNC samples (CNCS-1, CNC-1R1, and CNC-1R2), the broad C4 wings become partially resolved into separate signals due to surface accessible to water, as can be observed inFigure 6b for CNCS-1. Larsson and co-workers
developed a model24,25 that assigns the individual resonance lines of the spectral deconvolution of the C4 region to the different regions in the cellulose fibers in wood pulp. Their model for cellulose microfibers is based on the idea of Frey-Wyssling:61 Elementary crystallite fibrils aggregate to form
microfibers, resulting in fibril surfaces that are inaccessible or accessible to water, depending on whether they are facing the inside or outside of the microfibers, respectively. Larsson and co-workers specifically assigned the sharp resonance in the C4 wings to the outside surfaces that are accessible to water and the broad underlying resonance to inside surfaces that are inaccessible to water. Since the diameter of the cellulose nanocrystals in our study is significantly smaller than cellulose microfibers in wood pulp and reflects the cross section of the elementary fibrils, we assign the broad C4 resonance to less ordered outside surfaces. Although this differs from the initial Larsson assignment, we show below when comparing the results from NMR and AFM, this is the most consistent interpretation. However, we use the deconvolution of the C4 resonances to quantify the signal integrals from the C4 wings as in the case of the dried CNC sample. For all samplesdried, never-dried, and rehydratedwe compare the integration by peak deconvolution to simple summation of the signal intensity over specified spectral regions that are indicated inFigure 6.
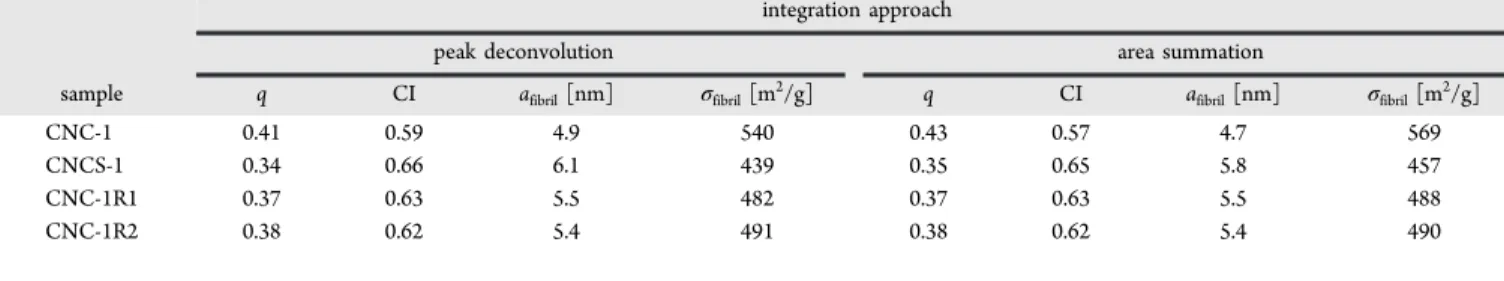
Table 3 summarizes the results we obtained from the deconvolution and area summation procedures for the C4 resonance lines in CP-MAS spectra of a series of CNC samples. We observe that overall the ratios q and hence the crystallinity index CI are similar in all samples and lie around 0.4 and 0.6, respectively. The lateral dimension of individual fibrils afibrilis
about 5.5 nm and consistent with the heights obtained by AFM measurements. This is consistent with all of the signals in the C4 wings originating from outside surfaces; i.e., the elementary crystallites are not assembled into microfibers as for example for cellulose fibers in wood pulp. Hence, for CNC rather than attributing the broad underlying resonance in the C4 wing to “inaccessible” (interior) surfaces, the whole of the C4 wing should be attributed to “accessible” surfaces. The broad part would probably best be understood as stemming from less ordered outside surface areas that are poorly accessible to water due to substantial agglomeration of the elementary crystallites at the relatively low water contents for the hydrated CNC samples used for these experiments. This looser agglomeration is substantially different from the assembly into microfibers in the case of cellulose fibers. It should also be noted that small amounts of amorphous cellulose within the interior of the crystals will be counted within the C4 wing. X-ray diffraction data for CNCS-1 estimate an amorphous content of 10−15% for CNCS-1.
The value of the specific surface area for CNC-1 was determined to be 540 m2/g, whereas the values for the hydrated
samples (CNCS-1, CNC-1R1, and CNC-1R2) were lower with
Figure 6.C4 region of the13C CP-MAS spectrum of samples of dry
(a, CNC-1) and never-dried (b, CNCS-1) CNCs. The deconvolution
of the C4 resonances is based on Larsson and co-workers.24,25 In
addition, the integration borders for the different groups of resonances are indicated by vertical lines.
Table 3. Properties of Different CNC Samples, Calculated from the Deconvolution of the C4 Resonances As Shown inFigure 6
integration approach
peak deconvolution area summation
sample q CI afibril[nm] σfibril[m2/g] q CI afibril[nm] σfibril[m2/g]
CNC-1 0.41 0.59 4.9 540 0.43 0.57 4.7 569 CNCS-1 0.34 0.66 6.1 439 0.35 0.65 5.8 457 CNC-1R1 0.37 0.63 5.5 482 0.37 0.63 5.5 488 CNC-1R2 0.38 0.62 5.4 491 0.38 0.62 5.4 490 Langmuir Article DOI:10.1021/acs.langmuir.6b01376 Langmuir2016, 32, 6105−6114 6111
439, 482, and 491 m2/g. These values lie in the expected range
for CNCs which is between 400 and 500 m2/g for particles with
average lengths and cross sections of 100−200 nm and 4−5 nm, respectively. The data are also consistent with values obtained for interior surface areas measured for CNC aerogels.17The NMR method provides a far superior estimate
than do BET measurements which yield a surface area of ∼1 m2/g for the large, tightly packed dry CNC aggregates. The
lower values for the hydrated sample are unexpected and may stem from reduced spectra intensity of mobile13C sites in the
CP-MAS experiment. Further studies would be required to confirm this possibility and to test the reliability of the NMR method by examining CNCs with significantly different sizes and surface areas.
■
CONCLUSIONSCNC size distributions have been measured using three complementary methods, and the results illustrate some of the challenges associated with size measurements for these nanorods. The approach of using multiple microscopy methods and comparing to an ensemble method such as dynamic light scattering is rare and provides additional insight. Despite the charged surfaces which lead to colloidally stable suspensions, CNCs have a high tendency to agglomerate and aggregate even in suspension and especially when deposited on a surface. This is a significant limitation for microscopy since agglomerated particles must be excluded from the analysis. It is somewhat surprising that CNCs agglomerate on the positively charged PLL-coated mica surfaces used for AFM. It would be of interest to test whether controlling the surface charge by introducing variable numbers of sulfate half esters (or changing the surface functionality) can be used to minimize agglomeration.
The selection of individual CNCs for analysis is not always straightforward, and there is an element of analyst subjectivity as to which particles can be counted. Furthermore, our results indicate that lateral association of particles is more problematic for TEM than for AFM, resulting in differences between AFM heights and TEM widths, although we cannot rule out the possibility that some particles have an asymmetric shape (width ≠ height). At this stage particle selection appears to be the main source of variation between analysts (and presumably also between laboratories). Beyond the issues of particle selection and aggregation, it is important to note that one cannot exclude the possibility that the sample deposition procedure leads to adsorption of specific particle sizes. However, the similarity of the lengths by AFM and TEM (after consideration of tip-feature convolution for AFM) argues for a relatively small effect, especially when one considers that the sample surface and deposition methods are quite different for the two methods. Based on the limitations and advantages of both AFM and TEM, it appears that the CNC cross section is best estimated from AFM height (due to lateral aggregation in TEM images), while the length is more accurately obtained by TEM measurements (which do not require correction for tip broadening effects). Although DLS does not suffer from the sampling issues encountered with microscopy, there are limitations in terms of its applicability to nonspherical particles and in comparing intensity- to number-based distributions. Additionally, the presence of any aggregates or agglomerates smaller than the filter size used for DLS sample preparation will skew the size distribution to larger values. The observation of a higher fraction of longer particles by AFM for sonicated
samples suggests that disrupting agglomerates by sonication changes the fraction of longer particles in the bulk sample.
The fraction of C4 signal intensity associated with the low field wings between 80 and 86 ppm in the ssNMR spectra for never-dried and rehydrated CNC samples provides a useful approximation of the surface area for CNCs. The surface area estimates are similar to expectations based on the area calculated from average particle dimensions. Furthermore, the particle cross sections calculated from this model are in reasonable agreement with the AFM data, providing additional support for the validity of this approach and for our hypothesis that the TEM widths are significantly wider than the AFM heights due to inclusion of laterally associated particles that appear as individual CNCs. Additional experiments using CNCs with different sizes would be needed to further confirm the validity of this approach and to address the reasons for the differences between dry and rehydrated samples. Nevertheless, the NMR approach provides a good first approximation for the CNC specific surface area and overcomes the limitations of BET measurements for highly aggregated samples.
■
ASSOCIATED CONTENT*
S Supporting InformationThe Supporting Information is available free of charge on the
ACS Publications website at DOI: 10.1021/acs.lang-muir.6b01376.
Figures S1 and S2 (PDF)
■
AUTHOR INFORMATIONCorresponding Authors
*E-mail: [email protected](A.B.). *E-mail: [email protected](L.J.J.).
Notes
The authors declare no competing financial interest.
■
ACKNOWLEDGMENTSWe thank Ana Maria Jaimes Costello for preliminary data analysis, Dr. Shan Zou for advice on AFM data acquisition, and Drs. Patricia Grinberg and Ralph Sturgeon for providing CNC samples. Many useful discussions on CNC dispersion and characterization with Drs. S. Beck and J. Bouchard, FPInnovations, are gratefully acknowledged. Partial support from a Natural Sciences and Engineering Research Council Discovery Grant (L.J.J.) is gratefully acknowledged.
■
REFERENCES(1) Eichhorn, S. Cellulose nanowhiskers: Promising materials for advanced applications. Soft Matter 2011, 7, 303−315.
(2) Habibi, Y.; Lucia, L. A.; Rojas, O. J. Cellulose nanocrystals: Chemistry, self-assembly and applications. Chem. Rev. 2010, 110, 3479−3500.
(3) Moon, R. J.; Martini, A.; Nairn, J.; Simonsen, J.; Youngblood, J. Cellulose nanomaterials review: structure, properties and nano-composites. Chem. Soc. Rev. 2011, 40, 3941−3994.
(4) Klemm, D.; Kramer, F.; Moritz, S.; Lindstrom, T.; Ankerfors, M.; Gray, D.; Dorris, A. Nanocelluloses: A new family of nature-based materials. Angew. Chem., Int. Ed. 2011, 50, 5438−5466.
(5) Brinchi, L.; Cotana, F.; Fortunati, E.; Kenny, J. M. Production of nanocrystalline cellulose from lignocellulosic biomass: technology and applications. Carbohydr. Polym. 2013, 94, 154−169.
(6) Chen, L.; Wang, Q.; Hirth, K.; Baez, C.; Agarwal, U. P.; Zhu, J. Y. Tailoring the yield and characteristics of wood cellulose nanocrystals
(CNC) using concentrated acid hydrolysis. Cellulose 2015, 22, 1753− 1762.
(7) Hamad, W. Y.; Hu, T. Q. Structure-property-yield inter-relationships in nanocrystalline cellulose extraction. Can. J. Chem. Eng. 2010, 88, 392−402.
(8) Chen, L.; Zhu, J. Y.; Baez, C.; Kitin, P.; Elder, T. Highly thermal-stable and functional cellulose nanocrystals and nanofibrils produced
using fully recyclable organic acids. Green Chem. 2016,DOI: 10.1039/
C6GC00687F.
(9) Marchessault, R. H.; Morehead, F. F.; Koch, M. J. Some hydrodynamic properties of neutral suspensions of cellulose crystallites as related to size and shape. J. Colloid Sci. 1961, 16, 327−344.
(10) Dufresne, A. Nanocellulose: a new ageless bionanomaterial. Mater. Today 2013, 16, 220−227.
(11) Shatkin, J. A.; Wegner, T. H.; Bilek, E. M.; Cowie, J. Market projections of cellulose nanomaterial-enabled products- Part 1: Applications. TAPPI J. 2014, 13, 9−16.
(12) Dong, S.; Hirani, A.; Colachino, K. R.; Lee, Y. W.; Roman, M. Cytotoxicity and cellular uptake of cellulose nanocrystals. Nano LIFE 2012, 2, 1241006.
(13) Kovacs, T.; Naishi, V.; O’Connor, B.; Blaise, C.; Gagnez, F.; Hall, L.; Trudeau, V.; Martel, P. An ecotoxicological characterization of nanocrystalline cellulose (NCC). Nanotoxicology 2010, 4, 255−270.
(14) Roman, M. Toxicity of cellulose nanocrystals: a review. Ind. Biotechnol. 2015, 11, 25−33.
(15) Davis, C. S.; Moon, R. J.; Ireland, S.; Foster, E. J.; Johnston, L. J.; Shatkin, J. A.; Nelson, K.; Forster, A. M.; Postek, M. T.; Vladar, A. E.; Gilman, J. W. NIST-TAPPI Workshop on Measurement Needs for
Cellulose Nanomaterials 2015,DOI: 10.6028/NIST.SP.1192.
(16) Brown, S. C.; Boyko, V.; Meyers, G.; Voetz, M.; Wohlleben, W. Toward advancing nano-object count metrology: A best practice framework. Environ. Health Perspect. 2013, 1221, 1282−1291.
(17) Heath, L.; Thielemans, W. Cellulose nanowhisker aerogels. Green Chem. 2010, 12, 1448−1453.
(18) Stejskal, E. O.; Schaefer, J.; Waugh, J. S. Magic-angle spinning and polarization transfer in proton-enhanced NMR. J. Magn. Reson. 1977, 28, 105−112.
(19) Metz, G.; Wu, X.; Smith, S. O. Ramped-amplitude cross polarization in magic-angle-spinning NMR. J. Magn. Reson., Ser. A 1994, 110, 219−227.
(20) Tekely, P.; Palmas, P.; Canet, D. Effect of proton spin exchange
on the residual 13C MAS NMR linewidths. Phase-modulated
irradiation for efficient heteronuclear decoupling in rapidly rotating solids. J. Magn. Reson., Ser. A 1994, 107, 129−133.
(21) Detken, A.; Hardy, E. H.; Ernst, M.; Meier, B. H. Simple and efficient decoupling in magic-angle spinning solid-state NMR: the XiX scheme. Chem. Phys. Lett. 2002, 356, 298−304.
(22) Johnson, R. L.; Schmidt-Rohr, K. Quantitative solid-state13C
NMR with signal enhancement by multiple cross polarization. J. Magn. Reson. 2014, 239, 44−49.
(23) Harris, R. K.; Becker, E. D.; Cabral de Menzes, S. M.; Granger, P.; Hoffman, R. E.; Zilm, K. W. Further conventions for NMR shielding and chemical shifts. Pure Appl. Chem. 2008, 80, 59−84.
(24) Larsson, P. T.; Svensson, A.; Wågberg, L. A new, robust method for measuring average fibre wall pore sizes in cellulose I rich plant fibre walls. Cellulose 2013, 20, 623−631.
(25) Wickholm, K.; Larsson, P. T.; Iversen, T. Assignment of
non-crystalline forms in cellulose I by CP/MAS13C NMR spectroscopy.
Carbohydr. Res. 1998, 312, 123−129.
(26) Atalla, R. H.; VanderHart, D. L. The role of solid state13C NMR
spectroscopy in studies of the nature of native celluloses. Solid State Nucl. Magn. Reson. 1999, 15, 1−19.
(27) Brunauer, P. H. E. S. The use of low temperature van der Waals adsorption isotherms in determining the surface area of iron synthetic ammonia catalysts. J. Am. Chem. Soc. 1937, 59, 1553−1564.
(28) Elazzouzi-Hafraoui, S.; Nishiyama, Y.; Putaux, J.-L.; Heux, L.; Dubreuilf, F.; Rochas, C. The shape and size distribution of crystalline nanoparticles prepared by acid hydrolysis of native cellulose. Biomacromolecules 2008, 9, 57−65.
(29) Postek, M. T.; Vladar, A.; Dagata, J.; Farkas, N.; Ming, B.; Wagner, R.; Raman, A.; Moon, R. J.; Sabo, R.; Wegner, T. H.; Beecher, J. Development of the metrology and imaging of cellulose nanocryst-als. Meas. Sci. Technol. 2011, 22, 024005.
(30) Lahiji, R. R.; Xu, X.; Reifenberger, R.; Raman, A.; Rudie, A.; Moon, R. J. Atomic force microscopy characterization of cellulose nanocrystals. Langmuir 2010, 26, 4480−4488.
(31) Beck-Candanedo, S.; Roman, M.; Gray, D. G. Effect of reaction conditions on the properties and behavior of wood cellulose nanocrystal suspensions. Biomacromolecules 2005, 6, 1048−1054.
(32) Kontturi, E.; Vuorinen, T. Indirect evidence of supramolecular changes within cellulose microfibrils of chemical pulp fibers upon drying. Cellulose 2009, 16, 65−74.
(33) Kaushik, M.; Chen, W. C.; van de Ven, T. G. M.; Moore, A. An improved methodology for imaging cellulose nanocrystals by trans-mission electron microscopy. Nord. Pulp Pap. Res. J. 2014, 29, 77−84. (34) Fraschini, C.; Chauve, G.; Le Berre, J.-F.; Ellis, S.; Methot, M.; O’Connor, B.; Bouchard, J. Critical discussion of light scattering and microscopy techniques for CNC particle sizing. Nord. Pulp Pap. Res. J. 2014, 29, 31−40.
(35) Sacui, I. A.; Nieuwendaal, R. C.; Burnett, D. J.; Stranick, S. J.; Jorfi, M.; Weder, C.; Foster, J. E.; Olsson, R. T.; Gilman, J. W. Comparison of the properties of cellulose nanocrystals and cellulose nanofibrils isolated from bacteria, tunicate and wood processed using acid, enzymatic, mechanical and oxidative methods. ACS Appl. Mater. Interfaces 2014, 6, 6127−6138.
(36) Wang, Q. Q.; Zhu, J. Y.; Reiner, R. S.; Verrill, S. P.; Baxa, U.; McNeil, S. E. Approaching zero cellulose loss in cellulose nanocrystal (CNC) production: recovery and characterization of cellulosic solid residues (CSR) and CNC. Cellulose 2012, 19, 2033−2047.
(37) Uhlig, M.; Fall, A.; Wellert, S.; Lehmann, M.; Prévost, S.; Wågberg, L.; von Klitzing, R.; Nyström, G. Two-Dimensional Aggregation and Semidilute Ordering in Cellulose Nanocrystals. Langmuir 2016, 32, 442−450.
(38) Beck, S.; Bouchard, J.; Berry, R. Dispersibility in water of dried nanocrystalline cellulose. Biomacromolecules 2012, 13, 1486−1494.
(39) Shafiei-Sabet, S.; Hamad, W. Y.; Hatzikiriakos, S. G. Rheology of nanocrystalline cellulose aqueous suspensions. Langmuir 2012, 28, 17124−17133.
(40) Shafiei-Sabet, S.; Hamad, W. Y.; Hatzikiriakos, S. G. Ionic strength effects on the microstructure and shear rheology of cellulose nanocrystal suspensions. Cellulose 2014, 21, 3347−3359.
(41) Rouquerol, J.; Avnir, D.; Fairbridge, C. W.; Everett, D. H.; Haynes, J. H.; Pernicone, N.; Ramsay, J. D. F.; Sing, K. S. W.; Unger, K. K. Recommendations for the characterization of porous solids. Pure Appl. Chem. 1994, 66, 1739−1758.
(42) Kvien, I.; Tanem, B. S.; Oksman, K. Characterization of cellulose whiskers and their nanocomposites by atomic force and electron microscopy. Biomacromolecules 2005, 6, 3160−3165.
(43) Peng, Y.; Gardner, D. J.; Han, Y. Drying cellulose nanofibrils: in search of a suitable method. Cellulose 2012, 19, 91−102.
(44) Chunilall, V.; Bush, T.; Larsson, P. T.; Iversen, T.; Kindness, A.
A CP/MAS 13C-NMR study of cellulose fibril aggregation in
eucalyptus dissolving pulps during drying and the correlation between aggregate dimensions and chemical reactivity. Holzforschung 2010, 64, 693−698.
(45) Atalla, R. H.; Gast, J. C.; Sindorf, D. W.; Bartuska, V. J.; Maciel,
G. E.13C NMR spectra of cellulose polymorphs. J. Am. Chem. Soc.
1980, 102, 3249−3251.
(46) Atalla, R. H.; VanderHart, D. L. Native Cellulose: A Composite of Two Distinct Crystalline Forms. Science 1984, 223, 283−285.
(47) Earl, W. L.; VanderHart, D. L. High resolution, magic angle
sampling spinning13C NMR of solid cellulose I. J. Am. Chem. Soc.
1980, 102, 3251−3252.
(48) Larsson, P. T.; Wickholm, K.; Iversen, T. A CP/MAS13C NMR
investigation of molecular ordering in celluloses. Carbohydr. Res. 1997, 302, 19−25.
Langmuir Article
DOI:10.1021/acs.langmuir.6b01376
Langmuir2016, 32, 6105−6114
(49) VanderHart, D. L.; Atalla, R. H. Studies of microstructure in
native celluloses using solid-state13C NMR. Macromolecules 1984, 17,
1465−1472.
(50) Cateto, C. A.; Ragauskas, A. Amino acid modified cellulose whiskers. RSC Adv. 2011, 1, 1695−1697.
(51) Newman, R. H. Evidence for Assignment of 13C Signals to
Cellulose Crystallite Surfaces in Wood, Pulp and Isolated Celluloses. Holzforschung 1998, 52, 157−159.
(52) Newman, R. H.; Hemmingson, J. A. Carbon-13 NMR distinction between categories of molecular order and disorder in cellulose. Cellulose 1995, 2, 95−110.
(53) Pan, J.; Hamad, W.; Straus, S. K. Parameters affecting the chiral nematic phase of nanocrystalline cellulose films. Macromolecules 2010, 43, 3851−3858.
(54) Park, S.; Baker, J. O.; Himmel, M. E.; Parilla, P. A.; Johnson, D. K. Cellulose crystallinity index: measurement techniques and their impact on interpreting cellulase performance. Biotechnol. Biofuels 2010, 3, 10.
(55) Bernardinelli, O. D.; Lima, M. A.; Rezende, C. A.; Polikarpov, I.;
deAzevedo, E. R. Quantitative13C MultiCP solid-state NMR as a tool
for evaluation of cellulose crystallinity index measured directly inside sugarcane biomass. Biotechnol. Biofuels 2015, 8, 110.
(56) Lennholm, H.; Larsson, T.; Iversen, T. Determination of
cellulose Iαand Iβin lignocellulosic materials. Carbohydr. Res. 1994,
261, 119−131.
(57) Wormald, P.; Wickholm, K.; Larsson, P. T.; Iversen, T. Conversions between ordered and disordered cellulose. Effects of mechanical treatment followed by cyclic wetting and drying. Cellulose 1996, 3, 141−152.
(58) Park, S.; Johnson, D. K.; Ishizawa, C. I.; Parilla, P. A.; Davis, M.
F. Measuring the crystallinity index of cellulose by solid state 13C
nuclear magnetic resonance. Cellulose 2009, 16, 641−647.
(59) Newman, R. H. Estimation of the lateral dimensions of cellulose crystallites using NMR signal strengths. Solid State Nucl. Magn. Reson. 1999, 15, 21−29.
(60) Sugiyama, J.; Vuong, R.; Chanzy, H. Electron diffraction study on the two crystalline phases occurring in native cellulose from an algal cell wall. Macromolecules 1991, 24, 4168−4175.
(61) Frey-Wyssling, A. The fine structure of cellulose. Science 1954, 119, 80−82.