Publisher’s version / Version de l'éditeur:
Lab on a Chip, 6, 4, pp. 555-560, 2006-03-03
READ THESE TERMS AND CONDITIONS CAREFULLY BEFORE USING THIS WEBSITE. https://nrc-publications.canada.ca/eng/copyright
Vous avez des questions? Nous pouvons vous aider. Pour communiquer directement avec un auteur, consultez la première page de la revue dans laquelle son article a été publié afin de trouver ses coordonnées. Si vous n’arrivez pas à les repérer, communiquez avec nous à [email protected].
Questions? Contact the NRC Publications Archive team at
[email protected]. If you wish to email the authors directly, please see the first page of the publication for their contact information.
NRC Publications Archive
Archives des publications du CNRC
This publication could be one of several versions: author’s original, accepted manuscript or the publisher’s version. / La version de cette publication peut être l’une des suivantes : la version prépublication de l’auteur, la version acceptée du manuscrit ou la version de l’éditeur.
For the publisher’s version, please access the DOI link below./ Pour consulter la version de l’éditeur, utilisez le lien DOI ci-dessous.
https://doi.org/10.1039/b516031f
Access and use of this website and the material on it are subject to the Terms and Conditions set forth at
Enzymatically-generated fluorescent detection in micro-channels with
internal magnetic mixing for the development of parallel microfluidic
ELISA
Herrmann, M.; Veres, T.; Tabrizian, M.
https://publications-cnrc.canada.ca/fra/droits
L’accès à ce site Web et l’utilisation de son contenu sont assujettis aux conditions présentées dans le site LISEZ CES CONDITIONS ATTENTIVEMENT AVANT D’UTILISER CE SITE WEB.
NRC Publications Record / Notice d'Archives des publications de CNRC:
https://nrc-publications.canada.ca/eng/view/object/?id=98be5491-036b-4afb-bacb-bffd2fb3a7a2
https://publications-cnrc.canada.ca/fra/voir/objet/?id=98be5491-036b-4afb-bacb-bffd2fb3a7a2
Enzymatically-generated fluorescent detection in micro-channels with
internal magnetic mixing for the development of parallel microfluidic
ELISA
M. Herrmann,
aT. Veres
band M. Tabrizian*
aReceived 11th November 2005, Accepted 3rd February 2006 First published as an Advance Article on the web 3rd March 2006 DOI: 10.1039/b516031f
The Enzyme-Linked Immuno-Sorbent Assay, or ELISA, is commonly utilized to quantify small concentrations of specific proteins for a large variety of purposes, ranging from medical diagnosis to environmental analysis and food safety. However, this technique requires large volumes of costly reagents and long incubation periods. The use of microfluidics permits one to specifically address these drawbacks by decreasing both the volume and the distance of diffusion inside the micro-channels. Existing microfluidic systems are limited by the necessary control of extremely low flow rates to provide sufficient time for the molecules to interact with each other by diffusion only. In this paper, we describe a new microfluidic design for the realization of parallel ELISA in stop-flow conditions. Magnetic beads were used both as a solid phase to support the formation of the reactive immune complex and to achieve a magnetic mixing inside the channels. In order to test the detection procedure, the formation of the immune complex was performed off-chip before the reactive beads were injected into the reaction chamber. Anti-streptavidin antibodies were quantified with low picomolar sensitivity (0.1–6.7 pM), a linear range of 2 orders of magnitude and good reproducibility. This work represents the first step toward a new platform for simple, highly effective and parallel microfluidic ELISA.
1.0 Introduction
The sensitive detection of specific proteins is an important analysis for applications in biotechnology, biomedical diag-nosis, food and environmental safety. Label-free methods, such as Surface Plasmon Resonance (SPR) or Quartz Crystal Microbalance (QCM), provide simple and real-time measure-ments, but they are limited by a lack of sensitivity.1
Alternatively, sandwich immunoassays allow the detection of a specific protein with greater sensitivity at the cost of a more complex procedure. In particular, the Enzyme-Linked Immuno-Sorbent Assay (ELISA), in which the enzymatic amplification of the signal greatly lowers the limit of detection, is the current standard for protein quantification. However, this method requires large volumes of reagents as well as long incubation times due to the high volume-to-surface ratio. The use of microfluidics to perform sandwich immunoassays permits one to specifically address these drawbacks. The low scale of these devices reduces the volumes and diffusion distances inside the micro-channels, therefore decreasing the duration of the successive incubation periods.
Many microfluidic platforms have been described using various methods of detection such as indirect fluorescence,2–5 electro-chemistry6–8 or fluorescence generated through an enzymatic reaction.9–12 Fluorescence is a popular technique
as it provides powerful detection tools, increasing sensitivity and gives the possibility of imaging numerous sites on a restricted area.13,14 Interestingly, optical fibers and diodes
(LED) have been successfully incorporated in some micro-fluidic platforms in order to miniaturize and integrate the fluorescent detection device.15,16To date, the highest sensitiv-ity achieved in a microfluidic immunoassay has been reported for the quantification of the cytokine TNFa with a detection limit of 20 pg mL21 (1.14 pM).17 This system is however
restricted by the number of necessary manipulations and the requirement for sophisticated equipment, which increase the complexity and the cost of the assay. Moreover, it has been demonstrated that one of the main challenges to performing highly sensitive microfluidic immunoassays is related to the fine tuning of the flow velocity.18 When the flow velocity is high, the kinetics of the analyte capture is reaction-limited. In this regime, the exploitation of the analyte present in the solution is only about 5%. Conversely, when the flow velocity is extremely slow, or even stopped, the analyte exploitation reaches values up to 90%. The regime is then transport-limited as the incubation time required to attain such high exploitation rates is extended due to the absence of mixing.
Micro-beads have been used for more than a decade in immunoassays as a means of concentrating specific molecules and of increasing the available surface area supporting the formation of the immune complex.19–21 In particular, para-magnetic micro-beads can be easily manipulated by applying variable magnetic fields with permanent magnets or electro-magnets. Magnetic beads are for instance commonly utilized in macroscopic automated systems such as the immunoassay
aBiomedical Engineering Department, McGill University, Montreal, QC,
H3A 2B4, Canada. E-mail: [email protected]; Fax: +1-514-398-7461; Tel: +1-514-398-8129
b
Industrial Materials Institute, National Research Council, Boucherville, QC, J4B 6Y4, Canada
Downloaded on 29 July 2010
analyzer Elecsys.22 In microfluidic systems, they have been employed to capture specific molecules23–29 as well as to produce mixing inside micro-channels or microfluidic chambers.30,31
Based on these observations, we designed a system to perform microfluidic ELISA in stop-flow rather than in continuous-flow conditions. In stop-flow conditions, the channel is first rapidly filled with the desired solution. The flow is then stopped for a defined incubation period. This approach has two major advantages, (i) the volume of solution in the system is precisely defined by the volume of the channel, thus avoiding imprecision due to pipetting and (ii) the assay is not limited by the complex control of extremely low flow rates. The outcome of the assay is hence not dependent on the flow rate but only on the incubation time corresponding to the stop period. The issue of transport limitation is circumvented by using magnetic micro-beads both as a solid phase to support the formation of the immune complex and as a means to create an internal mixing.
An original microfluidic design to perform parallel ELISA in stop-flow conditions is described. The enzymatic amplifica-tion and detecamplifica-tion of the fluorescent signal was tested on-chip following the off-chip formation of the immune complex. Rapid prototyping in PDMS, manipulation of magnetic beads and epifluorescence microscopy have been combined in order to achieve the detection and quantification of anti-streptavidin antibodies.
2.0 Materials and methods
2.1 Fabrication method
Micro-channels were molded in Poly(dimethylsiloxane) (PDMS) (Dow Corning, MI) by the technique of replica molding. A negative photo-resist (SU-8 2035, MicroChem, MA) was spin-coated on to a silicon wafer to achieve a homogenous layer of 50 mm. The patterns were exposed with UV-light (I-liner, 365 nm) through a high-definition transpar-ent mask and then developed to obtain a negative master of the channel network. PDMS was prepared by mixing the elastomer and the curing solutions in a 10 : 1 ratio and baked in an oven at 80 uC for 2 hours or more. The PDMS was then peeled off the wafer and the connection holes were pierced before assembling.
Both the PDMS block and a 5 cm 6 7.5 cm glass slide were cleaned and carefully dried under a nitrogen flow before they were brought into contact to form a tight waterproof reversible bond. The platform was then placed onto the homemade trapping/mixing device. The channels were primed with ethanol to prevent the formation of air bubbles and then connected to a syringe pump (Model 210, Lomir biomedical, NY) via a single outlet. The fluidic tests were carried out with a buffer solution mixed with a red food dye for visualization. 2.2 Bead preparation and formation of the immune-complex Phosphate Buffer Saline (PBS), Trizma Base (TRIS), Tween-20, glycine and Bovine Serum Albumin (BSA) were obtained from Sigma-Aldrich (Oakville, ON). Magnesium chloride was purchased from ACP Chemicals (Montreal, QC).
The desired amount of streptavidin-coated beads (Dynabeads1 MyOne2 Streptavidin, Dynal Biotech, NY) was diluted 10 times in PBS 0.05% Tween-20 (PBS-T). The beads were washed 3 times in PBS-T and separated into different Eppendorf tubes. They were then incubated for 30 min with the anti-streptavidin IgG (Rockland Immunochemicals, PA) diluted at the appropriate concentra-tion in a soluconcentra-tion of PBS 1% BSA, under constant mixing. A volume of 10 mL of the protein solution per microlitre of beads was used (equivalent to 1 assay). Following incubation, the beads were washed 3 times in PBS-T. They were then incubated another 30 minutes in a 1 mg mL21 solution of
anti-rabbit IgG coupled with Alkaline Phosphatase (AP) (Rockland Immunochemicals, PA) diluted in PBS 1% BSA. Finally, the beads were washed 3 times and kept in PBS-T at 4 uC until used.
2.3 Procedure for on-chip signal generation and enzymatic amplification
The channels were rinsed twice with 10 mL of PBS-T. The remaining solutions trapped at the bottom of each inlet were rapidly withdrawn with a pipette between each run to avoid cross-contamination of the sequentially injected solutions inside the inlets. The beads were then injected into the channel and trapped by an external rare earth magnet in the reaction chamber, forming a loose bed that can be moved by displacing the magnet back and forth along the direction of the channel. The beads were washed twice with 10 mL of TRIS buffer pH = 9, 10 mM MgCl2, 10 mM Glycine (TRIS). The solution
containing the enzymatic substrate, namely 20 mM Fluorescein Diphosphate (FDP) (Biotum, CA) in TRIS, was subsequently flown into the channels and incubated for 5 min with 30 s mixing every minute.
2.4 Detection method and data processing
An inverted microscope (TE2000-U, Nikon), a stereoscopic zoom microscope (SMZ1500, Nikon) and a digital camera (DXM1200F, Nikon) operated with ACT-1 software were used to acquire pictures of the channels. For fluorescence imaging, the microscope is equipped with a high pressure mercury lamp (C-SHG1, Nikon) and with the appropriate set of filters for fluorescein (FITC) excitation and emission wavelengths. The intensity of fluorescence in each channel was measured with ImageJ (software for image processing and analysis in Java) over the total section of the captured channel (1006 magnifications). All data were normalized by subtract-ing the intensity obtained in the negative control.
3.0 Results and discussion
3.1 Microfluidic design
Employing the technique of replica molding,32the network of 3 walled micro-channels was fabricated in PDMS. After cleaning and drying, the PDMS block was placed on the surface of a microscope glass slide, closing the channels and creating a reversible watertight seal. The original design of the system enables the simple parallelization of individual ELISA on a single chip. Fig. 1 presents a photograph of the entire
Downloaded on 29 July 2010
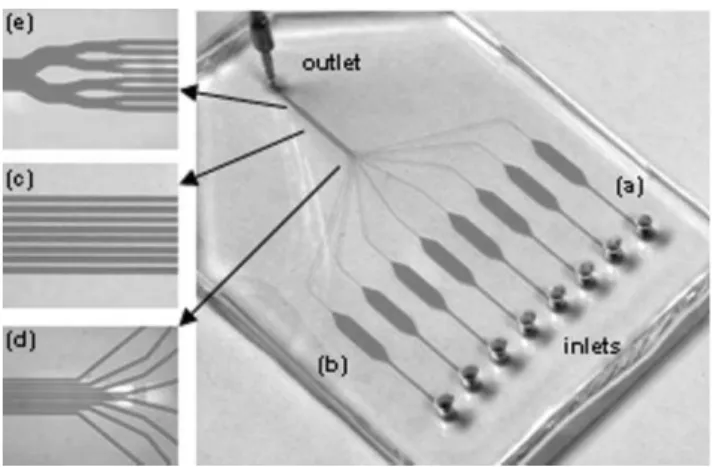
platform, along with close-ups at various strategic locations. The system comprises eight independent micro-channels for the realization of parallel simultaneous measurements with identical experimental conditions. Each channel is composed of three different sections: (a) an independent inlet linked to a wide channel acting as a diffusion barrier, (b) a reaction chamber where the generation of the signal and the magnetic mixing are realized, and (c) a smaller channel where the intensity of the fluorescent signal is measured before the solution is discarded via the single outlet of the system.
Section (a), linking the inlet to the reaction chamber, is formed by a rectangular segment of 200 mm in width and 50 mm in height (Fig. 1a). Its relatively large dimension slows down the diffusion of liquid from the inlet into the rest of the system when the flow is stopped, thus acting as a diffusion barrier between the sequentially injected solutions. In addition, it allows for a better lateral distribution of the beads and the various solutions, which flow through the gradual opening into the wider reaction chamber.
Section (b), or reaction chamber, is 2 mm wide, 6 mm long and 50 mm high (Fig. 1b). These dimensions keep the fluid regime in the laminar domain, where solutions injected sequentially follow each other with only minimal mixing at the interface. The reaction chamber is terminated with two symmetrical cone-shaped ends, opening and closing over a 2 mm long path. The gradual change of width leads the solutions from and to the narrower channels with no apparent dead-volumes or liquid retention in the corners. The reaction chamber defines a volume of 600 nL, which has been demonstrated to be suitable in achieving the highly sensitive detection of TNFa in a dendritic cell culture medium.17The larger dimension of the chamber also contributes to decrease the linear flow velocity, thus reducing the hydrodynamic forces applied on the beads. As a result, the magnetic force necessary to capture and hold the beads at the desired location is also diminished.
However, as the flow is laminar within the entire system, turbulent mixing does not spontaneously occur inside the micro-channels. Additionally, when working in stop-flow conditions, fresh solution is not continuously transported toward the capture area. As a result, it is necessary to actively produce an internal mixing in order to promote binding events of complementary proteins, increase enzymatic substrate availability and homogenize the generated fluorescent signal. For our microfluidic platform, a prototype device was fabricated in order to efficiently trap and manipulate the magnetic beads inside the micro-channels. The microfluidic chip is placed on the top of the device, bringing the external rare earth magnet in close contact with the bottom of the glass slide used to seal the channels. The magnet can be manually displaced from one end of the reaction chamber to the other entraining the beads along in its course. The displacement of the external magnet moves the beads in a synchronized way, causing the fluid to circulate around them and mixing the surrounding solution. With about 106 beads of 1 mm in diameter trapped in the chamber (equivalent of 1 mL of Dynabeads concentrated solution), only a few seconds were necessary to initiate the mixing, and moving the magnet for less than 2 minutes was enough time to ensure the good homogeneity of the solution in the entire reaction chamber (Fig. 2).
Section (c), or detection area, corresponds to the portion of the system where the eight independent 50 mm wide channels gather to form a network with a 100 mm pitch (Fig. 1c and d). The total width of the detection area is about 750 mm, which allows the simultaneous observation and acquisition of the signal from all channels in one single shot. At the end of the detection area, the channels merged into one larger channel
Fig. 1 PDMS chip for the realization of simultaneous microfluidic ELISA: (a) individual channel with a cross-section of 200 6 50 mm acting as a diffusion barrier; (b) reaction chamber with dimensions of 6 mm 6 2 mm 6 50 mm (L 6 W 6 H); (c) network of channels with a cross-section of 50 6 50 mm referred as the detection area; (d) gathering of the independent channels; (e) merging of the channels into a unique outlet channel connected to a syringe pump in withdrawal mode.
Fig. 2 Magnetic mixing inside the reaction chamber: (a) about 106
beads of 1 mm in diameter are injected and trapped by an external permanent magnet. The reaction chamber is half-filled with a solution of red-food dye and left aside for 1 minute to ensure that the solution is not advancing anymore; mixing of the solution after (b) 5 s, (c) 30 s, (d) 60 s, (e) 90 s, (f) 120 s.
Downloaded on 29 July 2010
leading to the single outlet connected to a syringe pump in withdrawal mode (Fig. 1e). This particular design necessitates the utilization of only one source of vacuum, simultaneously driving the solution into multiple channels, thereby facilitating the parallelization and the synchronization of individual reactions.
3.2 Fluorescent signal generation and detection
In order to demonstrate the efficiency of the microfluidic platform for protein quantification, a generic detection scheme has been utilized that can be adapted for potentially any desired application. In addition, the chip does not require that it be pre-coated with either capture proteins or antibodies, thus it can be used for a specific application without the need for any further modifications. The analytical concept of the system is described in Fig. 3. Paramagnetic beads of 1 mm in diameter, coated with a layer of streptavidin, were used as a support for the formation of the immune complex. In that experiment, streptavidin was not used for its affinity for biotynilated molecules, but rather as a target protein to be recognized by anti-streptavidin polyclonal antibodies. The streptavidin-coated beads were first incubated with various concentrations of anti-streptavidin antibody, followed by a solution of secondary antibody coupled with alkaline phosphatase (AP). The enzymatic substrate fluorescein diphosphate (FDP) was subsequently used to generate the fluorescent signal. FDP is a very efficient fluorogenic enzymatic substrate for alkaline phosphatase, which has been previously utilized both for enzymatic assays and ELISA.33,34 The enzymatic reaction generates fluorescein, a strongly green fluorescent molecule, through the hydrolysis of the two phosphate groups of the colorless and non-fluorescent fluorescein diphosphate.
As the beads aggregate to form a loose bed, the reactive surface with the AP-coupled-antibodies becomes extremely concentrated and localized into the reaction chamber (Fig. 4). The reaction then occurs very rapidly around the bead bed but the rest of the enzymatic substrate solution is left unreacted. Moving the beads and mixing the solution thus improve the substrate availability and the resulting signal homogeneity. The transformation of FDP into fluorescein is processed at a steady rate into the reaction chamber, yielding to a final
fluorescent intensity which depends both on the duration of the incubation period and the number of immobilized enzymes. As a result, when the incubation period is fixed, the intensity of the fluorescent signal is only dependent on the number of immobilized enzymes, which itself is directly proportional to the quantity of anti-streptavidin antibodies bound on the surface of the streptavidin-coated beads. After 5 minutes of incubation and alternate mixing, the reacted solution is simply driven away from the magnetic beads, physically stopping all reactions at the same time, and giving a precise control over the duration of the multiple individual enzymatic reactions. The relatively large volume of the reaction chamber permits the downstream detection channel to be entirely filled up without the need for an extremely precise control of the flow.
Fig. 5a shows the fluorescent image obtained for multiple reactions performed in parallel on a single chip. No beads were introduced in the first and last channels. They served as controls to ensure that the solution of FDP did not exhibit auto-fluorescence due to deterioration of the substrate molecule during the storage period. From the top to the bottom, the second channel corresponds to the negative control where beads have been incubated with the secondary AP-antibody only. The weak signal obtained in this channel represents the background signal due to the unspecific binding of AP-coupled antibodies to the streptavidin-coated beads. Channels 3 to 7 correspond to increasing concentrations of anti-streptavidin antibodies, ranging from 12.5 pg mL21
(0.1 pM) to 1 ng mL21 (6.7 pM). The same experiment was
repeated 3 times and a standard curve for the quantification of anti-streptavidin antibodies was plotted in Fig. 5b. The linear range of quantification for this model was approximately 2 orders of magnitude (R2 = 0.987). The low picomolar sensitivity showed promising potential with regards to the performance of the optimized immunoassay for TNFa (1.14 pM).17A 3 to 4 fold increase in sensitivity was observed
with systems using indirect fluorescence (1 nM).4 The sensitivity was also enhanced by at least a factor of 10 when compared to previously described microfluidic ELISA (17 pM to 31 nM).9–11The standard deviations varied from 3% to 15% of the highest fluorescent intensity. The inter-assay coefficient
Fig. 3 Analytical concept for the quantification of anti-streptavidin antibodies: the formation of the immune complex is performed off-chip by incubating the streptavidin-coated micro-beads first with rabbit anti-streptavidin antibodies and then with 1 mg mL21 of
secondary anti-rabbit antibodies coupled with Alkaline Phosphatase. The beads are then injected into the micro-channels and both signal generation and detection are performed on-chip.
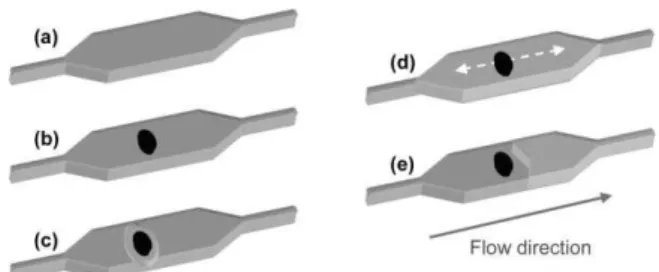
Fig. 4 Schematic presentation of the procedure for the on-chip generation of fluorescein and signal detection in the downstream channels: (a) filling and washing with PBS-T; (b) injection of about 106 beads, trapping in the reaction-chamber and washing with PBS-T and TRIS buffer; (c) introduction of the substrate solution (20 mM FDP in TRIS buffer), 5 minutes incubation with (d) alternate magnetic mixing and (e) detection. The total procedure takes about 10 minutes to complete.
Downloaded on 29 July 2010
of variation, which is defined by the ratio between the standard deviation and the mean fluorescence intensity, was about 15% for concentrations above 500 pg mL21 (3.3 pM). Similarly,
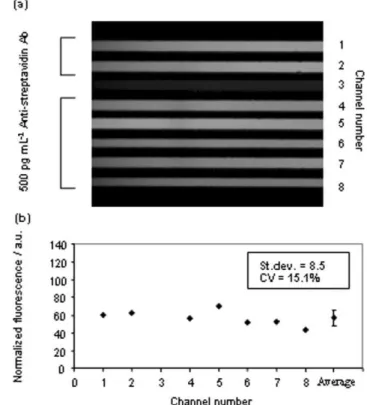
Fig. 6a displays a fluorescent picture where all channels, except for the negative control in channel 3, were filled with beads incubated with a solution of 500 pg mL21of anti-streptavidin
antibodies. The measured intra-assay coefficient of variation was 15.1% (Fig. 6b). Both inter- and intra-assay variability were comparable to those recently obtained by Honda et al. using indirect fluorescence on a compact disk-shaped micro-fluidic device.35 Additionally, the automation of the assay procedure is currently under development, which is expected to further reduce the variability of the system.
Employing streptavidin-coated micro-beads as the solid phase, the formation of the immune complex was realized off-chip. With this method, the issue of non-specific adsorption of proteins on the channel walls has been circumvented, thus largely eliminating the potential background noise for the enzymatic reaction that can cause a damageable loss in sensitivity. However, this approach slightly increases the quantity of reagents used, as sub-microliter volumes are not conveniently manipulated outside the chip. The overall duration of the assay is also augmented. Therefore, current efforts are focused on the realization of the entire assay on-chip, including the formation of the immune complex. This next stage of development has so far been limited by the difficulty of obtaining effectively passivated surfaces to avoid random adsorption of proteins on the channel walls.36,37
4.0 Conclusion
As a first step toward a microfluidic platform for parallel ELISA in stop-flow conditions, we have developed a system featuring micro-channels molded in PDMS, manipulation of paramagnetic micro-beads and fluorescence detection. The original microfluidic design enables one to conveniently work in stop-flow conditions. The magnetic beads are used both as a solid phase to support the formation of the reactive immune complex and as a means to produce an internal mixing of the solution. In order to test the amplification and detection of the signal inside the micro-fluidic system, the formation of the immune complex was performed off-chip before the reactive beads were injected into the reaction chamber. A standard curve for the quantification of anti-streptavidin antibodies was realized, exhibiting low picomolar sensitivity, a dynamic range of quantification of 2 orders of magnitude, and inter- and intra- coefficients of variation of about 15%. Current developments include the optimization of the fluidic network, the automation of the magnetic mixing and the treatment of internal surfaces to proceed to the on-chip formation of the immune complex, as well as the quantifica-tion of biomedically relevant proteins.38 Finally, we believe that the design of the system could allow further integration into a portable biosensor using a miniaturized pump and electromagnets.
Fig. 5 Standard curve for the quantification of anti-streptavidin antibodies: (a) fluorescent imaging of the downstream channels after 5 minutes incubation with concentrations of streptavidin anti-bodies varying from 12.5 pg mL21to 1000 pg mL21(1006); (b) linear
range of quantification for anti-streptavidin antibodies. The averages and error bars were calculated from 3 independent assays.
Fig. 6 Determination of the intra-assay coefficient of variation: all channels were filled with beads previously incubated with a solution of 500 pg mL21anti-streptavidin antibodies and secondary AP-coupled
antibodies, except for channel 3 where the beads were incubated with the secondary antibody only. The average fluorescent intensity after normalization was 56.3 a.u., the associated standard deviation was 8.5 a.u., which represented a coefficient of variation of 15.1%.
Downloaded on 29 July 2010
Acknowledgements
This work is supported by a joint grant from the Canadian Institute for Health Research and the National Research Council, as well as by the Fonds quebecois de la recherche de la nature et des technologies through the Centre for Biorecognition and Biosensors. The authors wish to thank Francois Normandin for technical help in building the mixing device.
References
1 S. D. Carrigan, G. Scott and M. Tabrizian, Langmuir, 2005, 21, 5966–5973.
2 A. Bernard, B. Michel and E. Delamarche, Anal. Chem., 2001, 73, 8–12.
3 M. A. Hayes, T. N. Polson, A. N. Phayre and A. A. Garcia, Anal.
Chem., 2001, 73, 5896–5902.
4 V. Linder, S. K. Sia and G. M. Whitesides, Anal. Chem., 2005, 77, 64–71.
5 J. P. Golden, C. R. Taitt, L. C. Shriver-Lake, Y. S. Shubin and F. S. Ligler, Talanta, 2005, 65, 1078–1085.
6 J. W. Choi, K. W. Oh, J. H. Thomas, W. R. Heineman, H. B. Halsall, J. H. Nevin, A. J. Helmicki, H. T. Henderson and C. H. Ahn, Lab Chip, 2002, 2, 27–30.
7 J. S. Rossier and H. H. Girault, Lab Chip, 2001, 1, 153–157. 8 M. S. Wilson, Anal. Chem., 2005, 77, 1496–1502.
9 E. Eteshola and D. Leckband, Sens. Actuators, B, 2001, 72, 129–133.
10 E. Eteshola and M. Balberg, Biomed. Microdevices, 2004, 6, 7–9. 11 S. Lai, S. Wang, J. Luo, L. J. Lee, S. T. Yang and M. J. Madou,
Anal. Chem., 2004, 76, 1832–1837.
12 J. C. McDonald, S. J. Metallo and G. M. Whitesides, Anal. Chem., 2001, 73, 5645–5650.
13 M. Wolf, D. Juncker, B. Michel, P. Hunziker and E. Delamarche,
Biosens. Bioelectron., 2004, 19, 1193–1202.
14 A. Gulliksen, L. A. Solli, K. S. Drese, O. Sorensen, F. Karlsen, H. Rogne, E. Hovig and R. Sirevag, Lab Chip, 2005, 5, 416–420. 15 M. L. Chabinyc, D. T. Chiu, J. C. McDonald, A. D. Stroock,
J. F. Christian, A. M. Karger and G. M. Whitesides, Anal. Chem., 2001, 73, 4491–4498.
16 K. Miyaki, Y. Guo, T. Shimosaka, T. Nakagama, H. Nakajima and K. Uchiyama, Anal. Bioanal. Chem., 2005, 382, 810–816. 17 S. Cesaro-Tadic, G. Dernick, D. Juncker, G. Buurman,
H. Kropshofer, B. Michel, C. Fattinger and E. Delamarche, Lab
Chip, 2004, 4, 563–569.
18 M. Zimmermann, E. Delamarche, M. Wolf and P. Hunziker,
Biomed. Microdevices, 2005, 7, 99–110.
19 N. B. Liabakk, K. Nustad and T. Espevik, J. Immunol. Methods, 1990, 134, 253–259.
20 K. Sato, M. Tokeshi, T. Odake, H. Kimura, T. Ooi, M. Nakao and T. Kitamori, Anal. Chem., 2000, 72, 1144–1147.
21 Y. Murakami, T. Endo, S. Yamamura, N. Nagatani, Y. Takamura and E. Tamiya, Anal. Biochem., 2004, 334, 111–116.
22 J. C. Forest, J. Masse and A. Lane, Clin. Biochem., 1998, 31, 81–88. 23 M. A. M. Gijs, Microfluidic Nanofluidic, 2004, 22–40.
24 M. A. Hayes, T. N. Polson and A. A. Garcia, Langmuir, 2001, 17, 2866–2871.
25 Tao Deng, Mara Prentiss and Georges M. Whitesides, Appl. Phys.
Lett., 2002, 80, 461–463.
26 Tao Deng, Georges M. Whitesides, Mala Radhakrishnan, Gary Zabow and Mara Prentiss, Appl. Phys. Lett., 2001, 78, 1775–1777.
27 H. Hartshorne, C. J. Backhouse and W. E. Lee, Sens. Actuators, B, 2004, 99, 592–600.
28 K. S. Kim and J. K. Park, Lab Chip, 2005, 5, 657–664.
29 G. Degre, E. Brunet, A. Dodge and P. Tabeling, Lab Chip, 2005, 5, 691–694.
30 A. Rida and M. A. Gijs, Anal. Chem., 2004, 76, 6239–6246. 31 M. Grumann, A. Geipel, L. Riegger, R. Zengerle and J. Ducree,
Lab Chip, 2005, 5, 560–565.
32 D. C. Duffy, J. C. McDonald, O. J. A. Schueller and G. M. Whitesides, Anal. Chem., 1998, 70, 4974–4984.
33 J. Montalibet, K. I. Skorey and B. P. Kennedy, Methods, 2005, 35, 2–8.
34 S. Farrell, H. B. Halsall and W. R. Heineman, Analyst, 2005, 130, 489–497.
35 N. Honda, U. Lindberg, P. Andersson, S. Hoffmann and H. Takei,
Clin. Chem., 2005.
36 A. Papra, A. Bernard, D. Juncker, N. B. Larsen, B. Michel and E. Delamarche, Langmuir, 2001, 17, 4090–4095.
37 H. Makamba, J. H. Kim, K. Lim, N. Park and J. H. Hahn,
Electrophoresis, 2003, 24, 3607–3619.
38 S. D. Carrigan, G. Scott and M. Tabrizian, Clin. Chem., 2004, 50, 1301–1314.
Downloaded on 29 July 2010