Do IFRS provide better information about intangibles in Europe ?
24
0
0
Texte intégral
(2) 1- Introduction This study looks at the transition to IAS/IFRS by European firms and, in particular, the impact of the adoption of IAS 38 and IFRS 3 on the quality of financial information on intangibles. The IAS/IFRS, mandatory for European listed companies since 1st January 2005, aimed to standardize the information provided, making it more relevant and reflecting the situation regarding a firm’s financial assets more clearly than the local standards previously used[1].1This aim was also emphasized by the European Commission[2].2 Based on studies of Swiss, German and Austrian firms which adopted these standards in advance of the new law (Dumontier and Raffournier, 1998; Gray and Street, 2002; Moya and Oliveras, 2006), some researchers have also suggested that they improve the informative content of accounting data (Schipper, 2005; Barth et al., 2006). But recent studies have shown the difficulty of forecasting the impact that changing certain accounting rules will have on the quality of financial data, due to the fact that the latter is influenced by several complex institutional factors (Ball et al., 2003). Accounting regulations exist within a mosaic of other institutional rules. Changing one element of this mosaic is not always the best solution when the other elements remain invariable (Hope et al., 2006; Ding et al., 2008). Until now, studies conducted in Europe to identify the impact of IAS/IFRS have focused on firms that adopted IAS in advance, before it became mandatory in 2005, mainly because this data was already available (Cuijpers and Buijink, 2005). Given their predominance, German firms have been studied most frequently. In effect, they began adopting these standards voluntarily in the 1990s, and by 2001, they represented 64% of firms using them in Europe (Renders and Gaeremynck, 2005, Tarca, 2004). Another interesting factor was that the German GAAP are stakeholder-focused and advocate a more prudent approach to financial reporting, unlike IAS. The differences in the principles between these standards therefore increased the significance of empirical studies. However, the conclusions reached by the different studies are mitigated. In particular, the most recent results by Hung and Subramanyam (2007), contradict those of Bartov et al. (2005). Hung and Subramanyam (2007) who compared the German financial results from GAAP and IAS reports of the same year, indicated that IAS adoption increased the net income and book value of equity, on the one hand, and that book value (net income), has a greater (lesser), valuation role under IAS than under German GAAP, on the other. In particular, asset revaluation and fair value reporting under IAS boost the value of property, inventory, receivables, financial instruments and intangibles. On the other hand, Bartov et al. (2005) found the yield and the result more relevant under IAS. An explanation for this divergence may be due to the samples used. While Hung and Subramanyam (2007) limited the study to the year that the firms changed standards, Bartov et al. (2005) used a larger sample that included all the firms listed on the German market between 1990 and 2000. More recently, Gjerde et al. (2008), found little evidence of increased valuerelevance of accounting figures on the Oslo Stock Exchange in Norway after IAS/IFRS adoption. On the other hand, Horton and Serafeim (2009) report results in the opposite direction in the UK, namely, the value relevance of earnings increases post-IFRS, but they find no evidence that IFRS improves the value relevance of book value of equity. Devalle et al. (2010) examine whether the value relevance of accounting information increased following the introduction of IFRS for listed companies in five EU countries (Germany, Spain, France, the UK and Italy) for the period starting in 2002. For all. 2.
(3) companies in their sample, they report an increase in the value relevance of earnings and a decrease in the value relevance of book value of equity. Thus, many questions remain unanswered about the real impact of IFRS on accounting figures, particularly with respect to intangible assets which determine both the performance and the valuation of companies. Moreover, the small size of the samples investigated in these studies that generally cover one national market[3]3limits the scope of their conclusions. In this study, we first look at the impact of the transition to IFRS on net income, equity capital and different sorts of intangible assets from a sample of 1855 European firms listed, and we then analyze the impact of these standards on the share price and returns of the firms concerned. Accounting data are expressed under Local GAAP from 2002 to 2004 and under IFRS from 2005 to 2007, across the whole of our sample. The impact of IAS 38 on intangibles appears more pronounced on this extended sample, even if there are divergences depending on the country. During the changeover to IFRS, goodwill (GW) and other intangible assets (INT) increased on average by over 21% across the whole European sample. Thus, most of the firms carried out an additional intangible assets readjustment in order to comply with IAS 38 and IFRS 3. Test results suggest that the book value of other intangible assets of the European listed firms is higher under IFRS than Local GAAP and has more informative value in terms of explaining the price of the share and stock market returns. On the other hand, European investors consider the financial information conveyed by capitalized goodwill to be less relevant with IFRS than with Local GAAP. Therefore, identified intangible assets capitalized on European firms’ balance sheets provide more value-relevant information for shareholders than unidentified intangible assets which have been transferred into goodwill, with the exception of Italian and Finnish investors. So, the results show that low national differences persist despite the use of common accounting standards. These findings highlight the fact that most investors have fully understood the advantage of capitalizing intangible assets with IFRS, rather than recording them as expenditures, which is a principle of the US GAAP system. Therefore, American listed firms should not be apprehensive of the reaction of stakeholders regarding the future adoption of IFRS beginning in 2014, in place and stead of US GAAP. The contribution of this study is threefold: • First, it examines the changes in the value of accounting data resulting from mandatory switching to IFRS on a 6 years period, from 2002 to 2007 (20022004 period in Local GAAP and 2005-2007 period in IFRS). • Second, we analyze the changes in the value relevance of goodwill and other intangible assets on a large sample of European listed firms (the 10 major EU member states) with a comparison country by country. • Third, we show that some national differences persist after the adoption of common accounting standards. Legal and regulatory country characteristics as well as market forces could still have a significant impact on the value relevance of accounting data The reminder of the paper is organized as follows. The next section discusses prior research on the information content of intangibles. Our research hypotheses concerning the issues involved when first applying the standards are set out in Section 3. In section 4, we test our empirical models on a sample of 1855 listed European firms. Section 5 concludes with suggestions for further research.. 3.
(4) 2- Information content of intangibles Over the last three decades, researchers have attempted to show that intangible investments contribute to a company’s future performance and that they should therefore be considered as assets, necessitating some information content. Most studies focus either on R&D expenditure or on goodwill. 2.1 Recognition of Intangibles Significant differences between countries were observed in the treatment of intangible assets that could seriously limit the comparability of financial statements before 2005 in an international context. Given the diversity of choices and conditions of financial reporting of intangible investments offered by the different accounting systems, it was unclear as to whether intangibles should be capitalized or expensed. It is therefore interesting to study the points of convergence and divergence between Local GAAP and IFRS. In their study, Stolowy and Casavan-Jeny (2001) show that all the countries and the IASB recognize purchased intangibles. So, when there is a reference to the market, the question of recognition is no longer an issue. However, this is not true for the recognition of internally generated intangibles. In Austria and Germany, a firm cannot recognize them as assets under any circumstances. Neither the Local GAAP of the 17 countries (15 European countries, Switzerland and USA) nor the IFRS recognize internally generated goodwill. 14 of the 17 countries and the IASB allow recognition of other internally generated intangible assets[4]4, borne by the firm. In the international system of reference, intangible assets are governed by IAS 38[5]5 and IFRS 3 in the event of a business combination. The IAS 38 defines an intangible asset as “an identifiable non monetary asset without physical substance. An asset is identifiable as an intangible asset when it is separable[6],6 or if it arises from a contractual or other legal right, regardless of whether these rights are transferable or separable from the entity or from other rights and obligations” (IAS 38, § 12). It imposes the reporting of all intangible expenditure as intangible assets if, and only if, (IAS 38, § 22): (a), it is probable that future economic benefits attributable to the asset will flow to the entity, (b), the cost of this asset can be measured reliably. An intangible expenditure must therefore be either expensed or capitalized. Optional treatments no longer exist. If an intangible expense results from a business combination and cannot be reported as an intangible asset, then it is incorporated into the amount attributed to goodwill on the date of acquisition. Thus, several intangible expenses (such as advertising, research costs, staff training costs, etc.), that provide companies with future economic benefits cannot be activated due to the restrictions on capitalization (characteristics which identify the asset and control procedures…), unless they are acquired as part of a business combination. After initial recognition, IAS 38 specifies that amortizable intangible assets must be depreciated over their useful lifespan with the amortization method reflecting the pattern of consumption of future economic benefits. By comparison, some standard national accounting practices (e.g. UK, Spain, France) do not expand significantly on the criteria for capitalizing intangible items or their accounting treatment after their initial recognition. Generally speaking, they are treated on a case-by-case basis. Their method of reporting varies between expensing, optional capitalization and obligatory capitalization. For amortizable assets, the duration. 4.
(5) and the method of amortization are not strictly defined, and allow for a margin of discretion in how the accounting rules are applied. In the majority of cases, business combinations highlight a difference between the cost of acquisition and the acquirer’s proportionate interest in the fair value[7]7 of identifiable assets and liabilities at the date of taking control (Wong and Wong, 2001). Governed by IFRS 3, the accounting treatment of goodwill is one of the most complex issues in accounting due to the difficulty in knowing how best to identify and measure it. Indeed, goodwill is an asset which, in practice, encompasses factors that do not possess the essential characteristics of an asset (Johnson and Kimberley, 1998), such as overvaluing the company purchased. On the other hand, goodwill generated in-house is not capitalized due to the fact that costs incurred during its creation are not, in practice, identifiable from regular expenses or those which are needed to maintain its value. This creates a distortion in the comparability of companies which have different growth methods. The accounting treatment of goodwill that has been acquired after its initial recognition complicates the situation yet further. The majority of national GAAP systems consider that it should be amortized, whereas IFRS recommends carrying out impairment tests. Amortization allows companies to both apportion the cost of purchasing the goodwill over its useful lifespan (reflecting consumption of future economic benefits), and to make its value progressively disappear from the balance sheet. This results in a value which is identical to that of internally generated goodwill. However, the amortization of goodwill entails, in particular: • A systematic depreciation of goodwill as well as a finite lifespan. • A book value for goodwill which has no relation to the economic value of the company (Jennings et al., 1996), • Goodwill depreciation, which does not really represent the loss of value of the latter (Henning et al., 2000). Non-amortization of goodwill avoids these problems, but impairment testing obliges managers to make choices about numerous parameters that create possible sources of manipulation. Finally, having considered the difficulties encountered when trying to define or assess intangibles, the ability of IAS/IFRS to provide all stakeholders with the most relevant information about intangibles in general, and goodwill in particular, is open to question. 2.2 The impact of the change in standards on goodwill The adoption of IFRS 3 and IAS 36 (for the depreciation tests), impacts on goodwill in two ways: possible re-evaluation, and the institution of depreciation tests instead of systematic amortization. The re-evaluation of goodwill (whether upwards or downwards), should impact on stock exchange profitability depending on its informative value. There are two conflicting positions in this regard. Hirschey, et al. (2002) maintains that the higher the value of goodwill, the lower the firms’ stock market profitability. Jennings et al. (1996) and Vance (2006), however, argue the contrary in the US context. Vance’s (2006) most recent study supports the implicit assumption underlying the FASB 141 standard (published in 2001), according to which goodwill is a rent-generating asset, even though disparities may arise depending on the line of business. Moreover, in 84% of cases, companies with strong goodwill generate higher rent on total assets than companies without goodwill. Finally, the study by CazavanJeny (2004), reached similar conclusions in a French context, identifying a positive. 5.
(6) relationship between goodwill and book-to-market ratio. Thus, the link between goodwill and the stock market valuation of firms reflects the inclusion of this accounting information in stock prices, even if the portrayal of future cash flow is not always perfect. With regard to goodwill depreciation, USA-focused studies dominate as changes to reporting methods far precede those observed in Europe. For many authors, the impairment of goodwill (according to SFAS 142, which are consistent with IFRS 3 and IAS 36 in the IAS/IFRS), should provide better information than systematic amortization as the latter can underestimate loss of goodwill in real value (Vance, 2008). He points out that not all companies that have implemented SFAS 142 depreciated their goodwill. In companies that did record a depreciation of their goodwill, this was higher than the amortization that they had previously used. Recent studies by Henning et al. (2000), Hirschey and Richardson (2002), Duangploy et al. (2005), and Schultze (2005), also show the relevance of impairment tests on capitalized goodwill when it is not amortized. The use of impairment tests enables goodwill paid without consideration to be written off as a loss. Thus, equity capital and the income statement respectively convey better information on the value of the company and its fluctuating value. Similarly, if a company announces the depreciation of its goodwill, this will result in a fall in its trading price as investors interpret it as negative information about the future economic benefits that this asset was supposed to bring. However, the implementation of these impairment tests does have limitations. Indeed, it obliges corporate executives to make discretionary choices such as the rate of discounting, the evaluation of future cash flows, etc. (Massoud and Raiborn, 2003). In particular, it allows ‘revaluation reserves’ to be produced against reporting loss of value to acquired goodwill. These reserves enable the capitalization of internally generated goodwill up to the level of initially recognized goodwill. Inversely, the tests can be used for big bath accounting following a strategic error or a change of management (Sevin and Schroeder, 2005). To summarize, these studies indicate that, overall, IAS 38 and IFRS 3 have increased the information content of intangibles, despite substantial sectorial and geographic differences. It is therefore important to see whether their information content is more value-relevant in the European context given the contrasting results observed for these countries. 3- Hypotheses and data collection 3.1 Hypotheses The conditions for entering intangible items under assets on the balance as defined by the IAS 38 standard are stricter than those under French GAAP, in particular regulation 99-02[8].8 The IAS 38 standard dictates that an intangible asset must be identifiable to clearly distinguish it from goodwill, as well as defining its future economic benefits[9].9 These more restrictive conditions for capitalization as defined by this international standard should, on the one hand, incite companies who adopt them to minimize the intangible assets on the balance sheet and on another hand, generate a shift of unidentifiable intangible items towards goodwill. According to these authors, some intangible assets such as market shares and business assets are listed as goodwill insofar as they do not match the criteria for separate capitalization required by the international frame of reference. Consequently, measuring goodwill from an accounting standpoint would not only reflect standard notions of goodwill, but also a set of heterogeneous elements that cannot be considered separately and are viewed as intangible, such as. 6.
(7) those identified by Cros and Sabah (2008)[10],10 notably synergies, staff, their knowhow and the firm’s ability to pursue a long-term business strategy. These considerations lead us to formulate the following hypotheses: Hypothesis 1a: IAS 38 incites companies to minimize intangible assets, other than goodwill, on their balance sheet. Hypothesis 1b: The transition to IFRS increases goodwill under the combined effect of IFRS 3 and IAS 38. In particular, IAS 38 prompts companies to include unidentifiable intangible elements as goodwill. Hypothesis 1c: The transition to IFRS has not resulted in a significant variation in the overall amount of intangible assets (effect of substitution between goodwill and other intangible assets) [11].11 Moreover, data on intangible assets is often used by investors and financial analysts as forecast indicators of a firm’s value and performance. Therefore, the financial statements under IAS/IFRS present detailed information about all the intangible expenditure capitalized or expensed in the footnotes, unlike those under French GAAP. Moreover, the exclusion of optional treatments and of derogation methods in the IAS/IFRS system of reference should not only reduce the risks of manipulative accounting practices but, by increasing the transparency and comparability of financial data between firms, should make such behavior more easily detectable. This should reduce information asymmetry between corporate executives and investors, consequently relieve the problem of undervaluing R&D-intensive companies, and thus increase the correlation between a company’s accounting and stock market data. Hypothesis 2a: Detailed data on the informational content regarding intangible assets under IFRS is more pertinent than more general information. In other words, dissociating goodwill from other intangible elements will convey more meaningful information under IFRS than an aggregate amount of intangible assets. However, some researchers have suggested that international standards offer a wide margin of discretion which allows corporate executives to appreciate capitalizable intangible expenditure, and define the useful life of intangible assets in order to carry out goodwill impairment tests. This discretion makes it easier for corporate executives to ‘manage’ the profit and loss statement (Stolowy and Breton, 2004; Cazavan-Jeny and Jeanjean, 2006). It should be noted that managerial latitude has not been curtailed, at least for intangibles, under French GAAP. Firstly, optional treatment for several intangible costs offers corporate executives the choice as to whether or not to capitalize the expenditure. Secondly, in choosing capitalization, they can manipulate the amount to capitalize. In particular, the propensity to capitalize R&D expenditure is higher for companies with low profitability. Finally, the amortization expense can also be manipulated by under-estimating or over-estimating the useful life of assets, as French GAAP gives no guidelines for determining the length of amortization of R&D expenditure capitalized. It only stipulates a maximum delay of 5 years. Moreover, the restrictive conditions for capitalization specified under IAS/IFRS create a certain discrepancy in the treatment of some expenses (such as brands, market share and research costs), if they have been acquired or have been produced internally. Thus, companies which are experiencing internal growth must expense these costs, and their accounting data becomes less value-relevant in comparison to companies which are growing through mergers and acquisition operations. This situation does little to improve the transparency and comparability of financial data. Despite these different. 7.
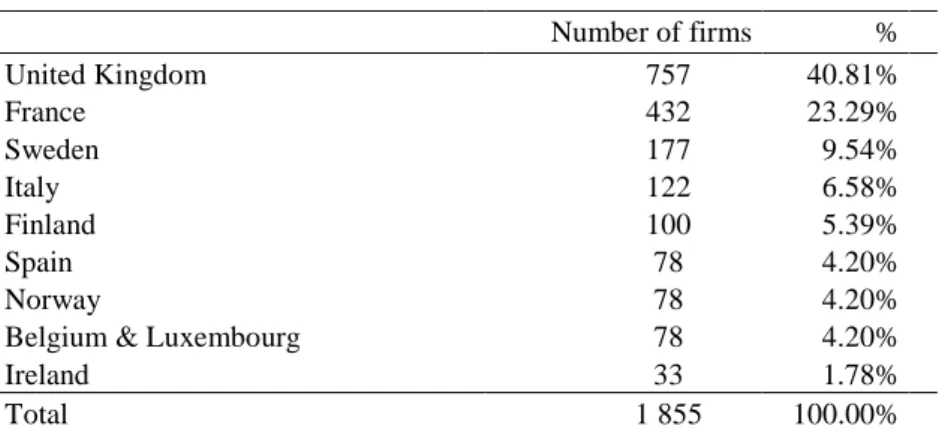
(8) contrary effects, we anticipate that the changes brought about by IAS/IFRS will improve the information content of intangible assets. Hypothesis 2b: Goodwill and other intangible items under IFRS are positively associated with trading prices. Hypothesis 2c: Goodwill and other intangible items under IFRS are positively associated with higher returns. 3.2 Data collection and selection of sample group Our sample consists of publicly traded European firms in a six-year period, from 2002 to 2007. The accounting data in Local GAAP and IFRS as well as the stock market information were extracted from the FACTSET database. As regards the matter of reliability of the information obtained, only the European firms which published their consolidated accounts without interruption from 2002 to 2007 and which were listed on the stock market without interruption during this period were retained in the sample[12].12 Our sample includes ten European countries where early adoption of IFRS was not allowed. For this reason, we do not take countries such as Germany, Switzerland and Austria which already applied IFRS into account. Since 1998, German and Austrian accounting rules have permitted companies listed on the Anglo-Saxon stock markets to apply IAS or US GAAP[13]13only (Bessieux-Ollier, 2006, and Mazars, 2005). This authorization was also extended to Swiss companies in 1994 (Dumontier and Raffournier, 1998). Table I shows the distribution of the sample of 1855 firms, with breakdown by country. Table I : Sample of European listed firms that adopted IFRS, breakdown by country. United Kingdom France Sweden Italy Finland Spain Norway Belgium & Luxembourg Ireland Total. Number of firms 757 432 177 122 100 78 78 78 33 1 855. % 40.81% 23.29% 9.54% 6.58% 5.39% 4.20% 4.20% 4.20% 1.78% 100.00%. Note : We excluded from the final sample the companies that interrupted the publication of their consolidated accounts from 2002 through 2007 for at least a year, or those that were not continuously listed on the stock market during this period.. British firms represent 40.81% of our sample, followed by French (23.29%), Swedish (9.54%), Italian (6.58%), and Finnish (5.39%), firms. Less than 15% of the sample consists of firms from the remaining five countries (Spain, Norway, Belgium, Luxembourg and Ireland).. 8.
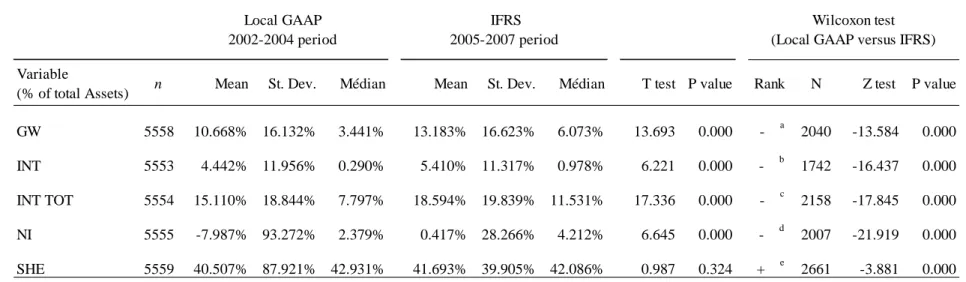
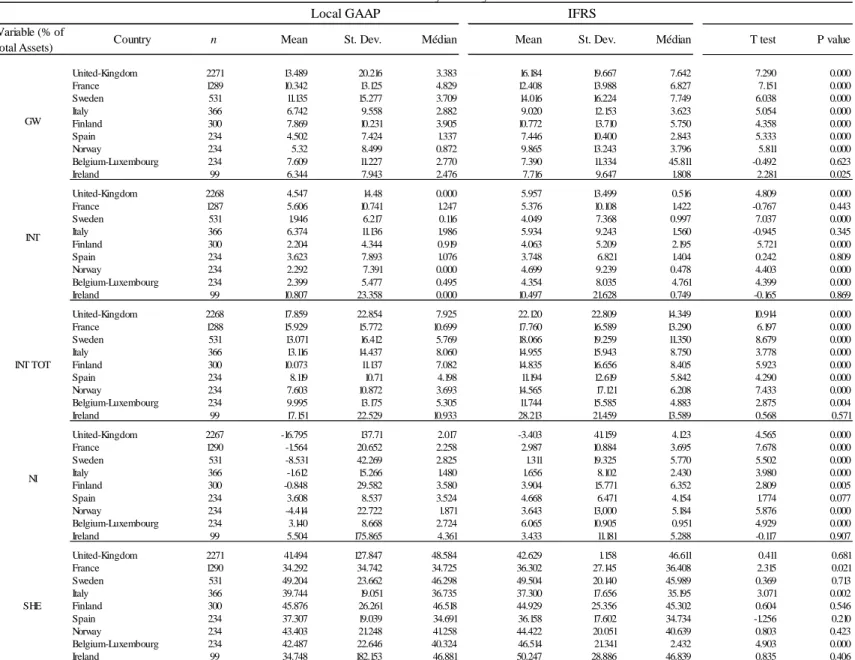
(9) 4. Methodology and results 4.1 Univariate tests Before testing our research hypothesis 2 to determine the degree of relevance of accounting data under IAS/IFRS, it is essential to study eventual changes to the value of this data, expressed under Local GAAP from 2002 to 2004 and under IFRS from 2005 to 2007[14],14across the whole of our sample (hypotheses 1a, b and c). The descriptive analysis and the univariate results for all of the firms included in the study are indicated in table II and table III. The adoption of IAS/IFRS for drawing up financial statements has led to real changes in the value of accounting data. Over the whole sample, the net income (NI), has increased on average by -7.98% of total assets using Local GAAP[15]15and 0.417% of total assets using IFRS (the median rising from 2.38% to 4.21%). This 9.5% rise is statistically significant. The breakdown of the data by country, presented in table III, highlights the rise of over 79% in Net Income for the UK and Belgium, and over 100% for France, Sweden, Italy, Finland and Norway. The impact of IAS 38 on intangibles appears more pronounced in the overall sample, even though divergences may be observed between countries. In fact, total intangible assets[16]16(INTTOT), increased by an average of almost 23% during the transition to the new accounting standards. More specifically[17],17goodwill (GW), increased from 10.67% to 13.18% of total assets (the median increased from 3.44% to 6.07%), in other words a difference of 23.6%, which is statistically significant. As indicated in table III, the difference is over 25% for Sweden, Italy and Finland, over 65% for Spain and Norway, but less than 20% for France and the UK. At the same time, the average of other intangible assets (INT) rose from 4.44% to 5.41% of total assets (the median from 0.29% to 0.98%). This 21.79% increase for the sample overall is also statistically significant. The data breakdown by country indicates that the increase in other intangible assets is 31.01% for the UK, 84.35% for Finland, and over 100% for Sweden and Norway. On the other hand, these other intangible assets decrease for France, Italy, Spain and Ireland, but this difference is not statistically significant. According to the Wilcoxon test[18],18over 63.3% of the firms in our sample (3518 firms out of 5558), saw an increase in the value of goodwill with the changeover to IFRS (2005-2007 period), and more than 68.63% of them (3811 firms out of 5553), also increased the book value of other intangible assets. The Wilcoxon test has a significance threshold of 1%. These modifications in the value of accounting data are statistically significant even if, in 2005, the majority of European companies opted not to apply IFRS 3 and IAS 38, as permitted by IFRS 1[19].19. 9.
(10) Table II : Descriptive statistics and univariate analysis of impact of IFRS adoption of European listed firms Local GAAP 2002-2004 period Variable (% of total Assets). n. Mean. IFRS 2005-2007 period. St. Dev.. Médian. Mean. Wilcoxon test (Local GAAP versus IFRS). St. Dev.. Médian. T test P value. Rank. GW. 5558. 10.668% 16.132%. 3.441%. 13.183% 16.623%. 6.073%. 13.693. 0.000. -. INT. 5553. 4.442% 11.956%. 0.290%. 5.410% 11.317%. 0.978%. 6.221. 0.000. -. INT TOT. 5554. 15.110% 18.844%. 7.797%. 18.594% 19.839% 11.531%. 17.336. 0.000. -. NI. 5555. -7.987% 93.272%. 2.379%. 4.212%. 6.645. 0.000. -. SHE. 5559. 40.507% 87.921% 42.931%. 41.693% 39.905% 42.086%. 0.987. 0.324. +. 0.417% 28.266%. a. b. c. d. e. N. Z test. P value. 2040. -13.584. 0.000. 1742. -16.437. 0.000. 2158. -17.845. 0.000. 2007. -21.919. 0.000. 2661. -3.881. 0.000. Notes : Variable definitions (data source) : Sample consists of listed European firms that adopted Local GAAP in the 2002-2004 period and IFRS in the 2005-2007 period. GW is goodwill, INT are other intangible assets, INT TOT are total intangible assets, NI est net income and SHE is shareholders Equity. All data were collected from the FACTSET database. a. GW IFRS < GW Local GAAP, b. INT IFRS < INT Local GAAP, c. INT TOT IFRS < INT TOT Local GAAP, d. NI IFRS < NI Local GAAP, e. SHE IFRS > SHE Local GAAP. 10.
(11) Table III : Descriptive statistics and univariate analysis of impact of IFRS adoption of European listed firms, breakdown by country Local GAAP Variable (% of total Assets). GW. INT. INT TOT. NI. SHE. Country. IFRS. n. Mean. St. Dev.. Médian. Mean. St. Dev.. Médian. T test. P value. United-Kingdom France Sweden Italy Finland Spain Norway Belgium-Luxembourg Ireland. 2271 1289 531 366 300 234 234 234 99. 13.489 10.342 11.135 6.742 7.869 4.502 5.32 7.609 6.344. 20.216 13.125 15.277 9.558 10.231 7.424 8.499 11.227 7.943. 3.383 4.829 3.709 2.882 3.905 1.337 0.872 2.770 2.476. 16.184 12.408 14.016 9.020 10.772 7.446 9.865 7.390 7.716. 19.667 13.988 16.224 12.153 13.710 10.400 13.243 11.334 9.647. 7.642 6.827 7.749 3.623 5.750 2.843 3.796 45.811 1.808. 7.290 7.151 6.038 5.054 4.358 5.333 5.811 -0.492 2.281. 0.000 0.000 0.000 0.000 0.000 0.000 0.000 0.623 0.025. United-Kingdom France Sweden Italy Finland Spain Norway Belgium-Luxembourg Ireland. 2268 1287 531 366 300 234 234 234 99. 4.547 5.606 1.946 6.374 2.204 3.623 2.292 2.399 10.807. 14.48 10.741 6.217 11.136 4.344 7.893 7.391 5.477 23.358. 0.000 1.247 0.116 1.986 0.919 1.076 0.000 0.495 0.000. 5.957 5.376 4.049 5.934 4.063 3.748 4.699 4.354 10.497. 13.499 10.108 7.368 9.243 5.209 6.821 9.239 8.035 21.628. 0.516 1.422 0.997 1.560 2.195 1.404 0.478 4.761 0.749. 4.809 -0.767 7.037 -0.945 5.721 0.242 4.403 4.399 -0.165. 0.000 0.443 0.000 0.345 0.000 0.809 0.000 0.000 0.869. United-Kingdom France Sweden Italy Finland Spain Norway Belgium-Luxembourg Ireland. 2268 1288 531 366 300 234 234 234 99. 17.859 15.929 13.071 13.116 10.073 8.119 7.603 9.995 17.151. 22.854 15.772 16.412 14.437 11.137 10.71 10.872 13.175 22.529. 7.925 10.699 5.769 8.060 7.082 4.198 3.693 5.305 10.933. 22.120 17.760 18.066 14.955 14.835 11.194 14.565 11.744 28.213. 22.809 16.589 19.259 15.943 16.656 12.619 17.121 15.585 21.459. 14.349 13.290 11.350 8.750 8.405 5.842 6.208 4.883 13.589. 10.914 6.197 8.679 3.778 5.923 4.290 7.433 2.875 0.568. 0.000 0.000 0.000 0.000 0.000 0.000 0.000 0.004 0.571. United-Kingdom France Sweden Italy Finland Spain Norway Belgium-Luxembourg Ireland. 2267 1290 531 366 300 234 234 234 99. -16.795 -1.564 -8.531 -1.612 -0.848 3.608 -4.414 3.140 5.504. 137.71 20.652 42.269 15.266 29.582 8.537 22.722 8.668 175.865. 2.017 2.258 2.825 1.480 3.580 3.524 1.871 2.724 4.361. -3.403 2.987 1.311 1.656 3.904 4.668 3.643 6.065 3.433. 41.159 10.884 19.325 8.102 15.771 6.471 13,000 10.905 11.181. 4.123 3.695 5.770 2.430 6.352 4.154 5.184 0.951 5.288. 4.565 7.678 5.502 3.980 2.809 1.774 5.876 4.929 -0.117. 0.000 0.000 0.000 0.000 0.005 0.077 0.000 0.000 0.907. United-Kingdom France Sweden Italy Finland Spain Norway Belgium-Luxembourg Ireland. 2271 1290 531 366 300 234 234 234 99. 41.494 34.292 49.204 39.744 45.876 37.307 43.403 42.487 34.748. 127.847 34.742 23.662 19.051 26.261 19.039 21.248 22.646 182.153. 48.584 34.725 46.298 36.735 46.518 34.691 41.258 40.324 46.881. 42.629 36.302 49.504 37.300 44.929 36.158 44.422 46.514 50.247. 1.158 27.145 20.140 17.656 25.356 17.602 20.051 21.341 28.886. 46.611 36.408 45.989 35.195 45.302 34.734 40.639 2.432 46.839. 0.411 2.315 0.369 3.071 0.604 -1.256 0.803 4.903 0.835. 0.681 0.021 0.713 0.002 0.546 0.210 0.423 0.000 0.406. 11.
(12) An initial interpretation of these results suggests that companies transferred nonseparable intangible assets towards goodwill, particularly in 2005, and also that there was an additional revaluation of goodwill and other intangible assets, in accordance with IFRS 3 and IAS 38. Under the more restrictive IFRS reporting conditions, intangible assets should no longer include unidentifiable intangibles. Only separable assets can be qualified as intangible items. Thus, in this initial analysis of the results, the book values of intangible assets which are not individualized appear to have been integrated into goodwill. We specify that when applying the revised IRFS 3 and IAS 38 standards, goodwill and intangible assets with an indefinite useful life also undergo a supplementary revaluation because of the suppression of obligatory amortization which applied to them. This supplementary revaluation of goodwill and other intangible assets justifies an average rise of 23% in total intangible assets (INTTOT), in our sample and confirms our hypotheses 1b and 1c, but disproves hypothesis 1a. In addition to noting the revaluation of intangible assets and goodwill, it is important to understand how investors perceive this practice: what impact does such a revalorization have on the firm’s share price and returns? Under international standards, the accounting measurement of goodwill reflects not only the value of first consolidation spread, but also the value of unidentified intangible assets in a more consistent way. Do investors see it as providing them with more value-relevant information? A multivariate analysis can be used to test hypothesis 2 and put forward some answers. 4.2 Multivariate tests 4.2.1 Association between intangibles and share prices To establish the relevance of accounting information on intangibles by examining their impact on the financial market, we adopted a first model, frequently used in empirical research, which studies the relationship between the price of securities (P), and the book value of equity capital per ordinary share and the net income per share (NIPS)[20].20 The book value of equity capital is broken down into book value per adjusted share of capitalized intangible assets (SHEAJPS), and into book value per action of total intangible assets (INTTOTPS). Moreover, to isolate the relevance of the book value of goodwill and other intangibles, the book value per share of total intangible assets (INTTOTPS), is broken down into book value per goodwill share (GWPS), and into book value per share of other intangibles (INTPS). Firms whose total intangible assets is higher than the average of the sample[21]21are regarded as having a high density of total intangible assets (HDTI). Models (1), and (2), are as follows: P i , t = β 0 + β 1 NIPS P i , t = β 0 + β 1 NIPS. P. i,t. NIPS i ,t SHEAJPS INTTOT. GWPS INTPS. i,t. i ,t. i,t. i, t. i ,t i ,t. + β 2 SHEAJPS + β 2 SHEAJPS. i ,t i ,t. + β 3 INTTOTPS i , t + β 4 HDTI i , t + ε i , t + β 3 GWPS i , t + β 4 INTPS i , t + β 5 HDTI. (1) i ,t. + ε i ,t ( 2 ). = the share price for firm i 4 months after fiscal year-end t. = the net income per share for firm i at time t. = the book value of shareholders’ equity per share, adjusted for total intangible assets, for firm i at time t. = the book value of total intangible assets per share for firm i at time t. = the book value of goodwill per share for firm i at time t. = the book value of other intangible assets per share for firm i at time t.. 12.
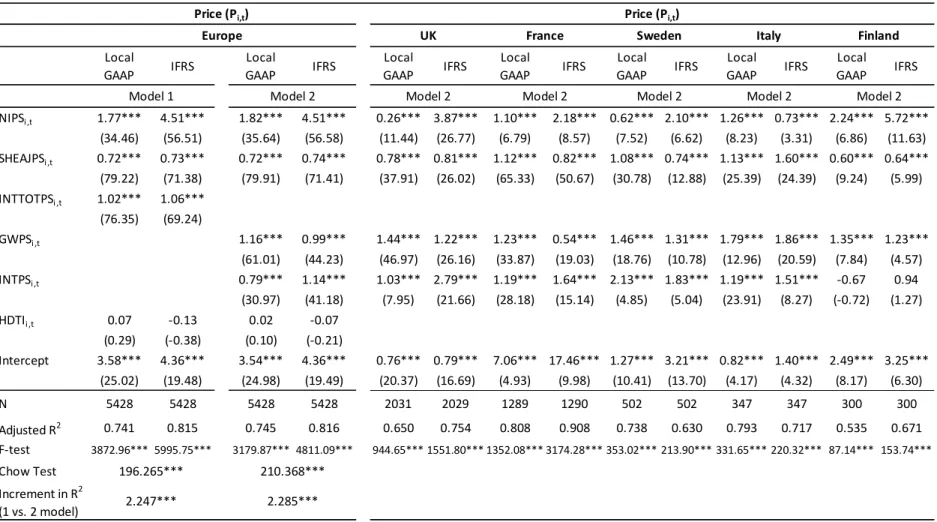
(13) HDTI. i ,t. = high density of total intangible assets for firm i at time t : dummy variable equal to 1 if firm i has total intangible assets above the average of the sample (average = 15.11% in Local GAAP and 18.59% in IFRS across the whole European sample as shown in Table II), and 0 otherwise.. Information on the book value of goodwill and other intangibles is available only when the financial statements have been published, in other words three months after the end date of the fiscal period. Like Aboody and Lev (1998), we consider that the dependant variable will be the share price three months after the end date of the fiscal period. For our multivariate analysis, the data has to be available for period t of the three last financial statements under Local GAAP (years 2002-2003-2004), as well as the three last financial statements under IFRS (2005-2006-2007). In addition, the share price has to be available four months after each fiscal year-end. In order to obtain data that complies with the model in question, a preliminary study of standardized residual[22]22 enabled us to extirpate 137 observations for which the residual more than tripled the estimated standard deviation for the random variable in absolute value. These constraints reduce the number of observations to 5428 in Model (1) and Model (2) under Local GAAP (2002-2004 period), and to 5428 in Model (1) and Model (2) under IFRS (2005-2007 period). This assessment model has the advantage of using the accounting data as an approximation of the discounted future cash flow hoped for by investors and of the firm’s market value. Models (1) and (2) will be subjected to two regressions: firstly with the accounting data using Local GAAP from 2002 to 2004, and secondly with the accounting data using IFRS from 2005 to 2007. According to hypothesis 2b, valuing goodwill and other intangibles under the new accounting standards should facilitate the forecasting of the price of securities. If the overall quality of the model with accounting data using IFRS, measured by the R², is better than the same model with accounting data using Local GAAP, hypothesis 2b will be validated. The coefficient associated with INTPS should be positive if the amount of intangible items capitalized using IFRS has a higher predictive value for investors. The coefficient associated with GWPS would also be positive if investors perceive that, under IFRS, goodwill can integrate unidentifiable intangibles which have future economic benefits[23].23On the contrary, it would not be significant if they perceive these unidentifiable intangible items as a source of information which has little relevance. 4.2.2 Results of models (1) and (2) The statistical results of the linear regressions of models (1) and (2) are presented in table IV for the sample of all the European organizations and by country (Great Britain, France, Sweden, Italy and Finland). The quality of the adjustment and the overall significance of the model using IFRS are higher than that of the model using Local GAAP (adjusted R2 is 74.5% in Local GAAP and 81.6% in IFRS). Thus, a F-test of the difference in R2 between the first and second models is statistically significant, so the model using IFRS is more explanatory than the model using Local GAAP. Moreover, across all models the statistical significance of the Chow test indicates that changing accounting standards significantly affects the value relevance of accounting values[24].24. 13.
(14) Table IV : Multivariate analysis of impact of IFRS adoption of European listed firms (Price Pi,t) in Local GAAP (2002-2004 period) and in IFRS (2005-2007 period) Price (Pi,t). Price (Pi,t). Europe Local GAAP. IFRS. Model 1 NIPSi ,t. IFRS. Model 2. Local GAAP. IFRS. Model 2. Local GAAP. IFRS. Model 2. Local GAAP. Finland IFRS. Model 2. Local GAAP. IFRS. Model 2. 1.10*** (6.79) 1.12*** (65.33). 2.18*** 0.62*** 2.10*** 1.26*** 0.73*** 2.24*** 5.72*** (8.57) (7.52) (6.62) (8.23) (3.31) (6.86) (11.63) 0.82*** 1.08*** 0.74*** 1.13*** 1.60*** 0.60*** 0.64*** (50.67) (30.78) (12.88) (25.39) (24.39) (9.24) (5.99). GWPSi ,t. 1.16***. 0.99***. 1.44*** 1.22***. 1.23***. 0.54*** 1.46*** 1.31*** 1.79*** 1.86*** 1.35*** 1.23***. INTPSi,t. (61.01) 0.79*** (30.97). (44.23) 1.14*** (41.18). (46.97) (26.16) 1.03*** 2.79*** (7.95) (21.66). (33.87) 1.19*** (28.18). (19.03) (18.76) (10.78) (12.96) (20.59) 1.64*** 2.13*** 1.83*** 1.19*** 1.51*** (15.14) (4.85) (5.04) (23.91) (8.27). 0.76*** 0.79*** (20.37) (16.69). 7.06*** 17.46*** 1.27*** 3.21*** 0.82*** 1.40*** 2.49*** 3.25*** (4.93) (9.98) (10.41) (13.70) (4.17) (4.32) (8.17) (6.30). Intercept N Adjusted R F-test. 2. Chow Test. 1.06*** (69.24). Model 2. Local GAAP. Italy. 0.26*** 3.87*** (11.44) (26.77) 0.78*** 0.81*** (37.91) (26.02). HDTIi ,t. 1.02*** (76.35). IFRS. Sweden. 4.51*** (56.58) 0.74*** (71.41). INTTOTPSi ,t. 4.51*** (56.51) 0.73*** (71.38). Local GAAP. France. 1.82*** (35.64) 0.72*** (79.91). SHEAJPSi ,t. 1.77*** (34.46) 0.72*** (79.22). UK. 0.07 (0.29) 3.58*** (25.02). -0.13 (-0.38) 4.36*** (19.48). 0.02 (0.10) 3.54*** (24.98). -0.07 (-0.21) 4.36*** (19.49). 5428. 5428. 5428. 5428. 0.741. 0.815. 0.745. 0.816. 3872.96*** 5995.75***. 3179.87*** 4811.09***. 196.265***. 210.368***. 2.247***. 2.285***. (7.84) -0.67 (-0.72). (4.57) 0.94 (1.27). 2031. 2029. 1289. 1290. 502. 502. 347. 347. 300. 300. 0.650. 0.754. 0.808. 0.908. 0.738. 0.630. 0.793. 0.717. 0.535. 0.671. 944.65*** 1551.80*** 1352.08*** 3174.28*** 353.02*** 213.90*** 331.65*** 220.32*** 87.14*** 153.74***. 2. Increment in R (1 vs. 2 model). Notes: *, ** and *** represent significance at 10%, 5% and 1% levels respectively. All data were collected from the FACTSET database. Two regression models with Pi,t as the dependent variable. Pi,t is the share price for firm i, 4 months after fiscal year-end t. The sample consists of listed European firms that adopted Local GAAP in the 2002-2004 period and IFRS in the 2005-2007 period. NIPSi,t is the net income per share for firm i at time t. SHEAJPSi,t is the shareholders equity per share, adjusted of total intangible assets, for firm i at time t. INTTOTPSi,t are total intangible assets per share for firm i at time t. GWPSi,t is the goodwill per share for firm i at time t. INTPSi,t are other intangible assets per share for firm i at time t. HDTIi,t is the high density in total intangible assets for firm i at time t. N is number of firm-years.. 14.
(15) The results of the model show the existence of a positive and significant relationship at the threshold of 1% between goodwill per share and the price of the share, both in Local GAAP and IFRS. Thus, the financial information conveyed by capitalized goodwill appears to be as relevant using IFRS as with Local GAAP. Indeed, the coefficient associated with GWPS is positive and statistically significant under both accounting standards, although the value of the coefficient is lower for IFRS. Even if unidentifiable intangible items are lost within the heterogeneous whole which makes up goodwill, the accounting measurement of the latter under international standards is no longer a relevant source of information for investors. When valued according to international standards, other intangible assets provide investors with more valuerelevant information. The coefficient associated with INTPS is positive and significant but the value of that same coefficient is greater for IFRS (1.140), than with the national accounting norms (0.795). We find a statistical difference (at the 0.01 level), between the two coefficients[25].25Therefore, identified intangible assets capitalized on the European firms’ balance sheets provide more value-relevant information for shareholders than unidentified intangible assets that have been transferred into goodwill. These results confirm hypothesis 2b. We should also point out that European shareholders consider the informational content of total intangible assets (INTTOTPS), as being valuerelevant, without making a distinction between goodwill and other intangible items. The coefficient associated with INTTOTPS is positive and significant (p>0.01), regardless of the primary accounting basis. Hypothesis 2a is disproved as the explanatory power of the models (1) and (2) is the same when intangible assets are dissociated and when the total amount of intangibles is considered. According to d’Arcy (2001), the distance of local GAAPs to IFRS varies significantly across European countries. The distance between local GAAP and IFRS is smaller for some countries and larger for others. For this reason, we repeat the analysis by estimating the model per country which presents more than 300 observations: Great Britain, France, Sweden, Italy and Finland. However, since the variable HDTI is not statistically significant on the whole European sample, it will not be taken into account in the analysis country by country. Consistent with prior studies (Basu and Waymire, 2008; Stark, 2008; Wyatt, 2008 and Oswald, and Zarowin, 2007), British and French investors consider the financial information conveyed by the capitalized goodwill less relevant with IFRS than with Local GAAP. With IFRS, the coefficient of goodwill is both positive and significant (1.224 and 0.539 for the UK and France, respectively), but is substantially lower for other intangible assets (2.790 and 1.636 for the UK and France, respectively),. In Sweden, regardless of the primary basis of accounting, intangible assets other than goodwill are considered to be a more reliable information source. Conversely, Italian investors are of the opinion that goodwill conveys more pertinent information than other intangibles. Lourenço and Curto (2008) report similar results. Unexpectedly, the informational value of goodwill is markedly elevated for Finnish investors, but the latter do not regard identifiable intangibles as drivers of value for the company (low coefficients), either with IFRS or Local GAAP. To conclude, the adoption of IAS 38 in Sweden, Italy and Finland failed to have an impact on the way investors view the information provided by goodwill and other intangible assets. The results show that small country differences persist despite the use of common accounting standards and confirm the pessimism of authors about the possibility that a common set of accounting. 15.
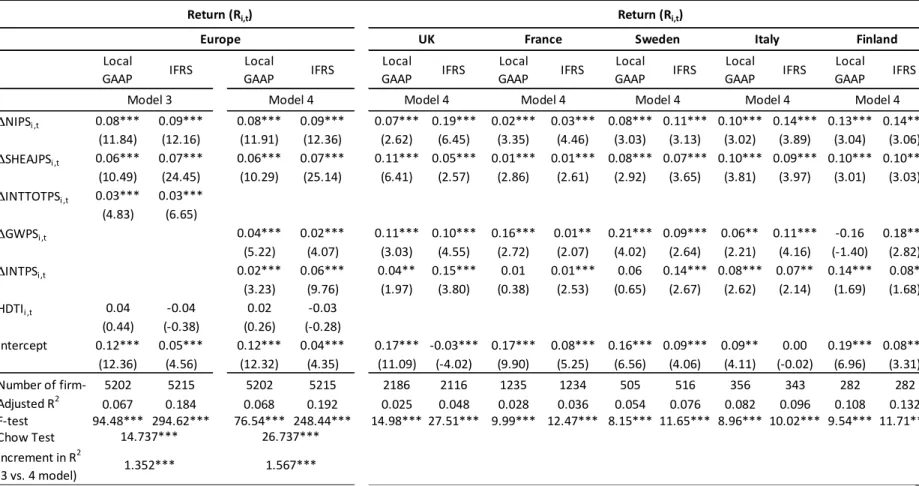
(16) standards can lead to similar effects in all countries that apply them (Ball et al.,2003; Soderstrom and Sun, 2007; Bradshaw and Miller, 2008). Legal and regulatory country characteristics as well as market forces could still have a significant impact on the value relevance of accounting data (Ball, 2006; Holthausen, 2009). 4.2.3 Association between intangibles and stock returns In the continuity of this research and to confirm the robustness of our results, as Easton (1999), suggests, we tested a second model which linked the stock returns (R), to the variations of book value of unidentifiable intangibles by share (∆INTPS), and of goodwill by share (∆GWPS), in addition to those of Net Income per share (∆NIPS), and adjusted equity capital per share (∆SHEAJPS). Firms whose total intangible assets is higher than the average of the sample[26]26are regarded as having a high density of total intangible assets (HDTI). Models (3), and (4), are as follows: (3) R i ,t = β 0 + β 1 ∆NIPS i ,t + β 2 ∆SHEAJPS i ,t + β 3 ∆INTTOTPS i ,t + β 4 HDTI i ,t + ε i ,t R i ,t = β 0 + β 1 ∆NIPS i ,t + β 2 ∆SHEAJPS i ,t + β 3 ∆GWPS i ,t + β 4 ∆INTPS i ,t + β 5 HDTI i ,t + ε i ,t ( 4) R i, t. = the rent for firm i 4 months after fiscal year-end t. = [( + )/ ] − where Pi,t is the share price for firm i 4 months R i ,t. ∆NIPS i , t ∆ SHEAJPS i , t. ∆ INTTOT i, t. ∆ GWPS i, t ∆ INTPSi, t. HDTI. i ,t. P i ,t. Dividend. i ,t. P i , t −1. 1. after fiscal year-end t. = the variation of the net income per share for firm i at time t. = the variation of the book value of shareholders’ equity per share, adjusted for total intangible assets, for firm i at time t. = the variation of the book value of total intangible assets per share for firm i at time t. = the variation of the book value of goodwill per share for firm i at time t. = the variation of the book value of other intangible assets per share for firm i at time t. = high density of total intangible assets for firm i at time t : dummy variable equal to 1 if firm i has total intangible assets above the average of the sample (average = 15.11% in Local GAAP and 18.59% in IFRS across the whole European sample as shown in Table II), and 0 otherwise.. In order to obtain data which complies with the model to be evaluated, a preliminary analysis of the residuals[27]27enabled us to delete 363 observations for the 2002-2004 period and 350 observations for the 2005-2007 period, whose residuals exceeded two and a half times the standard deviation estimated for the unknown factor as an absolute value. These constraints reduce the number of observations to 5202 in Model (3) and Model (4) under Local GAAP (2002-2004 period), and to 5215 in Model (3) and Model (4) respectively under IFRS (2005-2007 period).. 4.2.4 Results of models (3) and (4) The results of models (3) and (4) set out on table V, enabled us to corroborate hypothesis 2c.. 16.
(17) Table V : Multivariate analysis of impact of IFRS adoption of European listed firms (Return Ri,t) in Local GAAP (2002-2004 period) and in IFRS (2005-2007 period) Return (Ri,t). Return (Ri,t). Europe Local GAAP. IFRS. Model 3 ∆NIPSi ,t ∆SHEAJPSi ,t ∆INTTOTPSi ,t. 0.08*** (11.84) 0.06*** (10.49) 0.03*** (4.83). 0.09*** (12.16) 0.07*** (24.45) 0.03*** (6.65). ∆GWPSi ,t ∆INTPSi,t HDTIi ,t Intercept. 0.04 (0.44) 0.12*** (12.36). -0.04 (-0.38) 0.05*** (4.56). Number of firm-years 5202 5215 Adjusted R2 0.067 0.184 F-test 94.48*** 294.62*** 14.737*** Chow Test 2 Increment in R 1.352*** (3 vs. 4 model). UK Local GAAP. IFRS. Model 4. Local GAAP. France IFRS. Model 4. Local GAAP. IFRS. Model 4. Sweden Local GAAP. IFRS. Model 4. Italy Local GAAP. Finland IFRS. Model 4. Local GAAP. IFRS. Model 4. 0.08*** (11.91) 0.06*** (10.29). 0.09*** (12.36) 0.07*** (25.14). 0.07*** 0.19*** (2.62) (6.45) 0.11*** 0.05*** (6.41) (2.57). 0.02*** (3.35) 0.01*** (2.86). 0.03*** 0.08*** 0.11*** 0.10*** 0.14*** 0.13*** 0.14*** (4.46) (3.03) (3.13) (3.02) (3.89) (3.04) (3.06) 0.01*** 0.08*** 0.07*** 0.10*** 0.09*** 0.10*** 0.10*** (2.61) (2.92) (3.65) (3.81) (3.97) (3.01) (3.03). 0.04*** (5.22) 0.02*** (3.23) 0.02 (0.26) 0.12*** (12.32). 0.02*** (4.07) 0.06*** (9.76) -0.03 (-0.28) 0.04*** (4.35). 0.11*** 0.10*** (3.03) (4.55) 0.04** 0.15*** (1.97) (3.80). 0.16*** (2.72) 0.01 (0.38). 0.01** 0.21*** 0.09*** 0.06** 0.11*** -0.16 0.18*** (2.07) (4.02) (2.64) (2.21) (4.16) (-1.40) (2.82) 0.01*** 0.06 0.14*** 0.08*** 0.07** 0.14*** 0.08* (2.53) (0.65) (2.67) (2.62) (2.14) (1.69) (1.68). 5202 5215 0.068 0.192 76.54*** 248.44*** 26.737***. 0.17*** -0.03*** 0.17*** (11.09) (-4.02) (9.90). 0.08*** 0.16*** 0.09*** (5.25) (6.56) (4.06). 0.09** (4.11). 0.00 (-0.02). 0.19*** 0.08*** (6.96) (3.31). 2186 2116 1235 1234 505 516 356 343 282 282 0.025 0.048 0.028 0.036 0.054 0.076 0.082 0.096 0.108 0.132 14.98*** 27.51*** 9.99*** 12.47*** 8.15*** 11.65*** 8.96*** 10.02*** 9.54*** 11.71***. 1.567***. Notes: *, ** and *** represent significance at 10%, 5% and 1% levels respectively. All data were collected from the FACTSET database. Two regression models with Ri,t as the dependent variable. Ri,t is return for firm i, 4 months after fiscal year-end t. The sample consists of listed European firms that adopted Local GAAP in the 2002-2004 period and IFRS in the 2005-2007 period. ∆NIPSi,t is the variation of the net income per share for firm i at time t. ∆SHEAJPSi,t is the variation of the shareholders equity per share, adjusted of total intangible assets, for firm i at time t. ∆INTTOTPSi,t are the variation of total intangible assets per share for firm i at time t. ∆GWPSi,t is the variation of the goodwill per share for firm i at time t. ∆INTPSi,t is the variation of other intangible assets per share for firm i at time t. HDTIi,t is the high density in total intangible assets for firm i at time t. N is number of firm-years.. 17.
(18) The improvement in the book value of other intangible assets under international standards has informative value for explaining stock market returns. European investors thus perceive identifiable intangibles as a source of value for the firm. The coefficient associated with ∆INTPS is positive and significant (p<0.01), but the value of that same coefficient is greater for IFRS (0.065), than with the national accounting standard (0.026). We find a statistical difference (at the 0.05 level), between the two coefficients[28]. On the other hand, these same investors consider the financial information conveyed by capitalized goodwill to be less relevant with IFRS than with Local GAAP. The overall quality of the model using IFRS is greater than that of the model using Local GAAP (the adjusted R-squared increases from 6.8% to 19.2%) for all European companies and the statistical significance of the Chow test indicates that changing accounting standards significantly affects the value relevance of accounting values. Considering the results of table V, the low inflation factors of the variance (VIF<2.5), associated with low standard deviations from estimates of parameters indicates an absence of problems of colinearity[29].28 For each European country, the accuracy of the model under IFRS is greater than that of Local GAAP. With respect to the way British, Swedish and French investors are concerned by the adoption of IAS 38 and IFRS 3, the results obtained using models (3) and (4) confirm that the information conveyed by other intangible assets is more relevant than goodwill when using international accounting standards. However, these investors don’t share the same view as Italian and Finish investors concerning the reliability of accounting data on intangibles. So, the ability of IAS 38, IFRS3 and IAS 36 to impose a uniform quality of accounting information in a geographical area composed of countries with different legal and economic environments is not fully confirmed. 5- Conclusion The purpose of this study was to analyze the degree of relevance of the accounting data conveyed by intangibles during the changeover to international standards, in particular that of goodwill and other intangible assets. The results suggest that the adoption of IAS/IFRS standards has indeed generated modifications in the value of accounting data for the 1855 European companies that make up our sample. Specifically, this paper find that : - Numerous companies have reclassified as goodwill their intangible assets which no longer fit in with the definition given by IAS 38, but have also conducted an additional revaluation of intangible assets in order to comply with IAS 38 and IFRS 3. Empirical tests demonstrate the paramount reliability of the information conveyed by the accounting data of intangible assets when measured with IFRS for the majority of European investors in our sample, with the exception of Italian and Finnish investors, - Under IFRS, intangibles are more telling on stock exchange prices and yield than goodwill, owing to the tougher criteria for registering assets under the category of intangible assets (IAS 38). Consequently, investors appear to pay less attention to goodwill than to other intangible assets, which are perceived as rent-generating assets, except Italian and Finnish investors, - Low country differences persist despite the use of common accounting standards and Legal and regulatory country characteristics as well as market forces could still have a significant impact on the value relevance of accounting data.. 18.
(19) We can consider that the standard-setters seem to have achieved their aims with the application of IAS 38, giving more importance to the reliability of information by banning the capitalization of several unidentifiable intangible items. It is widely acknowledged that IFRS are heavily influenced by US GAAP in the area of intangible assets. American listed companies should not be apprehensive of the reaction of stakeholders regarding the future adoption of IFRS in 2014, in place and instead of US GAAP. In fact, the Securities and Exchange Commission (SEC) has announced that the United States is considering adopting IFRS as of 2014, a move that would entail abandoning the currently applicable US GAAP. A natural extension of this paper is to explore whether international accounting standards have changed how European investors perceive the risk in accounting information conveyed not only by expected future abnormal earnings but also by earnings volatility and goodwill volatility.. 19.
(20) 1. Preliminary Views on an improved Conceptual Framework for Financial Reporting: The Objective of Financial Reporting and Qualitative Characteristics of Decision-useful Financial Reporting Information, July 2006. http://www.iasb.org/NR/rdonlyres/4651ADFC-AB83-4619-A75A-4F279C175006/0/DP_ConceptualFramework.pdf (consulted 23.05.2011) 2. “The new organizational structure should be operational next year, and is driven by a strong desire to turn the IAS into a comprehensive set of accounting norms of the highest quality, to be implemented in the capital markets across the globe.” Source: Communication from the Commission to the Council and European Parliament, The EU Strategy on financial information: The procedure to follow, final document dated 13.6.2000, COM (2000), 359. 3 expect Devalle et al. (2010), 4 subject to certain conditions 5 This standard was approved in July 1998 and revised in March 2004. It prescribes the accounting treatment of intangible assets which are not specifically treated by other standards, and applies to expenditure on R&D, advertising, training, etc. 6 An asset could be sold without giving up other company assets. 7 Fair value is the amount for which the asset could be exchanged, or a liability extinguished, between well-informed consenting parties within the frame of normal competitive conditions (NC 38, § 8),. 8 Regulation concerning accounting regulations and methods applicable to consolidated accounts. 9 This excludes fundamental research costs, training and advertising as well as brands. 10 Cros and Sabah (2008) accurately identified these heterogeneous elements in their study of 2007 financial statements of CAC 40-listed companies. These authors belong to the Evaluation & Strategy Department at PricewaterhouseCoopers. 11 In the rest of the article, ‘other intangible assets’ will be defined as total intangible assets less goodwill. 12 We excluded all financial firms (banks, insurance, trust investment, etc.), 13 This last point was confirmed in the study conducted by Bessieux-Ollier (2006), and also in the IFRS European survey published by Mazars in April 2005. Furthermore, according to this survey, German companies listed in the Prime Standard, that is less than half of the companies listed, have been legally bound to publish their accounts in IFRS or US GAAP since 2003. 14 Some companies continued to use Local GAAP in 2005, following the end of the fiscal year, which could introduce a slight bias in our results. 15 The net income was negative on average by -7.98% of total assets because of financial crisis of this period (2002-2004), during which European firms have experienced a collapse results. 16 Once again, total intangible assets are made up of goodwill and other intangibles. 17 The interpretation of this analysis is identical if the accounting data is shown per share and not as a percentage of total assets. 18 When the rank-sum of positive differences is higher than the rank-sum of negative differences, the values of financial data such as net income, total intangible assets and goodwill, expressed as the percentage of total assets and valued according to international standards, are higher than those evaluated using French standards. 19 In order to ease the transition to the application of the new international standards, the IASB published the IFRS 1 “First-time Adoption of International Financial Reporting Standards”, which simplifies certain retroactive restatements of accounting data. IFRS 1 offers the possibility to benefit from certain exemptions with respect to other standards in the frame of reference. Concerning the possible exemption to applying IFRS 3, “a first-time adopter can elect not to apply IFRS 3 Business Combinations retrospectively” (IFRS 1, §15 and B1). As for the exemption to IAS 38, “an entity can choose to value an intangible asset at the time of transition to IFRS at its fair value and refer to said value as estimated cost” (IFRS 1, § 16 to 19). Given the complexity of evaluating intangible assets, the IASB did not encourage their revaluation according to IAS 38. 20 This model was inspired by theoretical work on evaluation models (Ohlson, 2001),. 21 The total intangible assets, as a percentage of total assets, are on average 15.11 % in Local GAAP (2002-2004 period), and 18.59 % in IFRS (2005-2007 period), for all European firms of the sample (Table II). 22 This process which diagnoses observations to identify atypical points was complemented by the study of diagrams of standardized residual. 23 Unidentifiable intangibles such as brands, market share, etc.. 20.
(21) 24. Chow test confirms the explanatory power of the model 2 when the regression is performed on two sub-periods (2002-2004 et 2005-2007), rather than on a single period (2002-2007). 25 To verify that the difference in coefficients of Local GAAP and IFRS is statistically significant, a test was performed on the effects of interaction between a dummy variable for the period 2002-2007 and the set of explanatory variables. This variable = 0 for the period 2002-2004 and 1 for the period 2005-2007. For example, NIPSi,tDUMMY corresponds to NIPSi,t*DUMMY or GWPSi,tDUMMY corresponds to GWPSi,t*DUMMY. The results of this test confirm that the difference in coefficients associated with variables GWPS and INTPS in Local GAAP and IFRS, is statistically significant at the threshold of 1%. This test is to conduct multiple regression equations [1’] et [2’] below : P. i ,t. = β. 0. + β. ' 1 NIPS. P. = β. i ,t. + β. ' 1. 0. NIPS. + β. 1. NIPS. DUMMY i,t. + β. 1. NIPS. DUMMY i,t. i ,t. + β. + β i ,t. '. SHEAJPS. SHEAJPS. 2. + β. + β. 2. ' 2. 2. SHEAJPS. SHEAJPS. i ,t. + β. 3. i ,t. INTTOTPS + β. DUMMY i,t. '. + β. 3. i ,t. + β. + β GWPS '. 3. 4. HDTI. 4. INTPS. DUMMY i,t. + β. i ,t. ' 0. D. i ,t. + β HDTI. DUMMY i ,t. INTTOTPS. 3. + β GWPS. DUMMY i,t. i ,t. '. i ,t. + β. + β. ' 4. 5. HDTI. INTPS. ε. DUMMY. 4. i ,t. i ,t. + β. DUMMY i,t. ' 0. D. [1 ' ]. i ,t. i ,t. + β HDTI '. 5. DUMMY i ,t. + ε. i ,t. 26. The total intangible assets, as a percentage of total assets, are on average 15.11 % in Local GAAP (2002-2004 period), and 18.59 % in IFRS (2005-2007 period), for all European firms of the sample (cf Table II). 27 This procedure which diagnoses observations to identify atypical points was complemented by the study of diagrams of standardized residual. 28 The conditioning indexes are all below 5, in other words, well below the critical limit fixed at 30 (Besley, Kuh and Welsch, 1980).. References Aboody, D., and Lev, B. (1998), “The value relevance of intangibles: the case of software capitalization”, Journal of Accounting Research, Vol. 36, pp. 161-191. Ball, R., Robin, A., and Wu, J.S. (2003), “Incentives versus Standards: Properties of Accounting Income in Four East Asian Countries and Implications for Acceptance of IAS”, Journal of Accounting and Economics, Vol. 36 N°1, pp. 235-270. Ball, R. (2006), “International Financial Reporting Standards (IFRS): Pros and cons for investors”, Accounting and Business Research, International Accounting Policy Forum, pp. 5-27. Barth, M., Landsman, W., and Lang, M. (2006), “International accounting standards and accounting quality”, Working Paper (Stanford University and University of North Carolina at Chapel Hill). Bartov, E., Goldberg, S., and Kim, M. (2005), “Comparative value relevance among German, U.S., and International Accounting Standards: a German stock market perspective”, Journal of Accounting, Auditing and Finance, Vol. 20 N°2, pp. 95– 119. Basu, S., and Waymire, G. (2008), “Has the importance of intangibles really grown? And if so, why?”, Accounting and Business Research, Vol. 38 N°3, pp. 171–190. Besley D., Kuh, E., and Welsch, R. (1980), Regression diagnostic: Identifying influential data and sources of collinearity, New York: Wiley. Bessieux-Ollier, C. (2006), “Les pratiques d’évaluation et de publication des entreprises françaises, allemandes et américaines: le cas des éléments incorporels”, Comptabilité-Contrôle-Audit, Vol. 12 N°2, pp 167-189.. 21. [2 '].
(22) Bessieux-Ollier, C., and Walliser, E. (2007), “La transition et le bilan de la première application en France des normes IFRS: le cas des incorporels”, ComptabilitéContrôle-Audit, Vol.13 (special edition), pp 219-246. Bradshaw, M.T., and Miller, G.S. (2008), “Will harmonizing accounting standards really harmonize accounting ? Evidence from non-U.S. firms adopting U.S. GAAP”, Journal of Accounting, Auditing and Finance, Vol. 23 No.2, pp.233-63. Cazavan-Jeny, A. (2004), “Le ratio market-to-book et la reconnaissance des immatériels- une étude du marché français”, Comptabilité-Contrôle-Audit, Vol. 10 N°2, pp 99-24. Cazavan-Jeny, A., and Jeanjean, T. (2006), “The Negative Impact of R&D Capitalisation: A Value Relevance Approch”, European Accounting Review, Vol. 15 N°1, pp. 37-61. Cuijpers, R., and Buijink, W. (2005), “Voluntary Adoption of Non-local GAAP in the European Union: A study of Determinants and Consequences”, European Accounting Review, Vol. 14 N°3, pp.487-524. Cros, I., and Sabah, D. (2008), “Comptabilisation et suivi des acquisitions: la communication financière sur l’application d’IFRS 3 et IAS 36”, in Etudes des états financiers 2007 des sociétés du CAC 40, PricewaterhouseCoopers. D’Arcy, A. (2001), “Accounting classification and the international harmonisation debate – an empirical investigation”, Accounting, Organizations and Society, Vol. 26, pp. 327-349. Devalle, A., Magarini, R., and Onali, E. (2010), “Assessing the value relevance of accounting data after the introduction of IFRS in Europe”, Journal of International Financial Management and Accounting, Vol. 21 N°2, pp. 85-119. Ding, Y., Jeanjean, T., and Stolowy, H. (2008), “The impact of firms’ internationalization on financial statement presentation: Some French evidence”, Advances in International Accounting, Vol. 24 N°1, pp. 145-156. Duangploy, O., Shelton, M., and Omer, K. (2005), “The value relevance of goodwill impairment loss”, Bank Accounting & Finance, 1st August, pp. 23-28. Dumontier, P., and Raffournier, B. (1998), “Why firms Comply Voluntarily with IAS: an Empirical Analysis with Swiss Data”, Journal of International Financial Management and Accounting, Vol.9 N°3, pp. 216-245. Easton, P.D. (1999), “Commentary on security returns and the value relevance of accounting data”, Accounting Horizons, Vol. 13 N°4, pp. 399-412. Gjerde, Ø., Knivsflå, K., and Sættem, F. (2008), “The value-relevance of adopting IFRS: Evidence from 145 NGAAP restatements”, Journal of International Accounting, Auditing & Taxation, Vol. 17 N°2, pp. 92-112. Gray, S.J., and Street, D.L., (2002), “Factors influencing the extent of corporate compliance with international accounting standards: summary of a research monograph”, Journal of International Accounting Auditing and Taxation, Vol. 11 N°1, pp. 51-76 Henning, S.L., Lewis, B.L., and Shaw, W.H. (2000), “Valuation of the components of purchased goodwill”, Journal of Accounting Research, Vol. 38, pp. 375-386. Hirschey, M., and Richardson, V.J. (2002), “Information content of accounting goodwill numbers”, Journal of Accounting and Public Policy, Vol. 21 N°3, pp. 173-191.. 22.
(23) Holthausen, R.W., (2009), “Accounting standards, financial reporting outcomes, and enforcement”, Journal of Accounting Research, Vol. 47, pp. 447-458. Hope, O.K., Jin, J., and Kang, T. (2006), “Empirical evidence on jurisdictions that adopt IFRS”, Journal of International Accounting Research, Vol. 5 N°2, pp. 1-20. Horton, J., and Serafeim, G. (2009), “Market reaction to and valuation of IFRS reconciliation adjustments: first evidence from the UK”, Review of Accounting Studies, Vol. 15 N°4, pp. 725-751. Hung, M., and Subramanyam, K.R. (2007), “Financial statement effects of adopting International Accounting Standards: the case of Germany”, Review of Accounting Studies, Vol. 12 N°4, pp. 623–657. Jennings, R., Robinson J., Thompson, R.B., and Duvall, L. (1996), “The relation between accounting goodwill numbers and equity values”, Journal of Business Finance & Accounting, Vol. 23, June, pp. 513-533. Johnson, L.T, and Kimberley, R.P. (1998), “Is Goodwill an Asset?”, Accounting Horizons, Vol. 12, pp.293-303. Lourenço, I.C., and Curto J.D. (2008), “The level of shareholder protection and the value relevance of accounting numbers: Evidence from the European Union before and after IFRS”, Working paper available at http://papers.ssrn.com/sol3/papers.cfm?abstract_id=1276024 (consulted 23.05.2011) Massoud, M.F. and Raiborn, C.A. (2003), “Accounting for Goodwill: Are We Better Off ?”, Review of Business, Vol. 24 N°2, pp. 26-32. Mazars (2005), “FRS 2005: European Survey”, Mazars, pp. 1-52. Moya, S., and Oliveras, E. (2006), “Voluntary adoption of IFRS in Germany: a regulatory impact study”, Corporate Ownership & Control, Vol. 3 N°3, pp. 138147. Ohlson, J.A. (2001), “Earnings, Book Values, and Dividends in Equity Valuation”, Contemporary Accounting Research, Vol.18 No.1, pp. 107-120. Oswald, D., and Zarowin, P. (2007), “Capitalization of R&D and the Informativeness of Stock Prices”, European Accounting Review, Vol. 16 N°4, pp. 703-726. Renders, A., and Gaeremynck, A. (2005), “The Impact of Legal and Voluntary Investor Protection on the Early Adoption of IFRS”, Available at SSRN: http://papers.ssrn.com/sol3/papers.cfm?abstract_id=744531 (consulted 23.05.2011) Schipper, K. (2005), “The Introduction of International Accounting Standards in Europe: Implications for International Convergence”, European Accounting Review, Vol. 14 N°1, pp. 101-126. Schultze, W. (2005), “The information Content of Goodwill-Impairments under FAS 142: Implications for External Analysis and internal control”, Schmalenbach Business Review, Vol. 57, pp. 276-297. Sevin, S., and Schroeder, R. (2005), “Earning management: evidence from SFAS n°142 reporting”, Management Auditing Journal, Vol. 20 N°1, pp. 47–54. Soderstrom, N.S., and Sun, K.J. (2007), “IFRS adoption and accounting quality: A review”, European Accounting Review, Vol. 16 N°4, pp. 675-702. Stark, A.W. (2008), “Intangibles and research – an overview with a specific focus on the UK”, Accounting and Business Research, Vol. 38 N°3, pp. 171–190.. 23.
(24) Stolowy, H., and Cazavan-Jeny, A., (2001), “International Accounting Disharmony: The Case of Intangibles”, Working Paper, Eighth draft: 06-06, HEC School of Management. Stolowy, H., and Breton, G. (2004), “A framework for the classification of Accounts Manipulation”, Review of Accounting and Finance, Vol. 3 N°1, pp. 5-66. Tarca, A., (2004), “International Convergence of Accounting Practices: Choosing between IAS and US GAAP”, Journal of International Financial Management and Accounting, Vol. 15 N°1, pp.153–174. Vance, D.E. (2006), “Is Goodwill Really an Asset?”, Working Paper Series WCRFS: 06-11, Rutgers Business School. Vance, D.E. (2008), “Evidence that Companies are not Analyzing Goodwill for Impairment as Required by SFAS142”, Working Paper Series WCRFS: 08-08, Rutgers Business School. Wong, J., and Wong, N. (2001), “The Investment Opportunity Set and Acquired Goodwill”, Contemporary Accounting Research, Vol. 18 N°1, pp. 173-196. Wyatt, A. (2008), “What Financial and Non-Financial Information on Intangibles is Value-Relevant? A Review of the Evidence”, Accounting and Business Research, Vol. 38 N°3, pp. 217–256.. 24.
(25)
Figure
+2
Documents relatifs
To mitigate multicollinearity bias amongst accounting stock variables, the procedure described by Hall (2001) is followed. These measures are determined not only for the total
Motivated by the recent works by Lev [2001b ; 2004] and Villalonga [2004], and the current debate surrounding the international financial reporting standard n°38 (i.e. IAS 38)
•* When the rank-sum of positive differences is higher than the rank-sum of negative differences, the values of financial data such as the net income, total intangible assets
Findings - The results suggest that the book value of other intangible assets of European listed firms is higher under IFRS than Local GAAP and has more informative
États de choses (Russel propose de les appeler aussi faits historiques) et faits plus complexes sont encore discutés dans les Investigations philosophiques 17 :
2 Michel Coste and Nestor Djintelbe The purpose of the introduction of a meaningful boundary for the group of rigid motions is to obtain information on the kinematics of the robots
This global trend toward remote sensing was also fueled by an extensive study conducted in Senegal by the International Fund for Agricultural Development (IFAD) to improve satellite
By 1920, the number of automobiles in the United States had passed 10 million besides the trains; both were the dominant mass transportation methods which made the
