HAL Id: hal-01644944
https://hal-amu.archives-ouvertes.fr/hal-01644944
Submitted on 28 Nov 2017
HAL is a multi-disciplinary open access
archive for the deposit and dissemination of sci-entific research documents, whether they are pub-lished or not. The documents may come from teaching and research institutions in France or abroad, or from public or private research centers.
L’archive ouverte pluridisciplinaire HAL, est destinée au dépôt et à la diffusion de documents scientifiques de niveau recherche, publiés ou non, émanant des établissements d’enseignement et de recherche français ou étrangers, des laboratoires publics ou privés.
economy
Caroline Nicol, P V Komi, P Marconnet
To cite this version:
Caroline Nicol, P V Komi, P Marconnet. Effects of marathon fatigue on running kinematics and economy. Scandinavian Journal of Medicine and Science in Sports, Wiley, 1991, 1 (4), pp.195-204. �10.1111/j.1600-0838.1991.tb00296.x�. �hal-01644944�
Effects of marathon fatigue on running
kinematics and economy
Nicol C, Komi PV, Marconnet P. Effects of marathon fatigue on run-
ning kinematics and economy.
Scand J Med Sci Sports 1991: 1: 195-204.
The influence of marathon fatigue on both running kinematics and economy was investigated with 8 subjects. The measurements included a
treadmill test at 3 steady submaximal speeds performed before and after
the marathon. One complete left leg cycle was videotaped at 100 Hz from the left side at each speed. The analysis included contact time (braking and push-off') and flight time as well as displacements and angular velocities of the left hip and knee. This analysis was comple- mented by the measurements of the electromyographic (EMG) activity of the gastrocnemius muscle at each running velocity, and energy expen- diture (E) of the last 30.s at the 2 slowest speeds. The results revealed significant increases of E at these 2 speeds, but the changes were not related to kinematic changes, which were greatly individual. However,
the relative duration of the push-off phase was significantly increased at the 2 slowest speeds, and the gastrocnemius muscle presented higher integrated EMG values in the respective braking (NS) and push-off phases at the 2 fastest speeds. This might indicate a loss of tolerance to
impact during the belt contact. The results failed, however, to demon- strate that running kinematics and running economy are interrelated
when fatigue progresses. It is also possible that observed kinematic changes might reflect some adaptation to fatigue more than real failure
The relationships between distance running pat- tern and running economy have been usually ex- amined in nonfatiguing situations (1-3). These studies revealed great interindividual variability in the examined variables, but the individual running pattern appeared to be rather optimally chosen. Kinematic adaptations of the endurance running pattern with fatigue also appeared to be greatly individual and different among studies (4-8). However, one of these studies (7) has compared the respective changes in running economy and running mechanics during fatigue, and the results have shown very few significant correlations. This is in contrast with the homogeneous loss in effi- ciency of the contractile mechanism, which has been demonstrated to result from the repeated stretching loads imposed to the leg muscles by marathon runs (9-11). This study was designed to investigate further how much this prolonged stretch-shortening cycle (SSC) type of exercise may affect running kinematics and economy. The study combined kinematic, metabolic and electro-
myographic (EMG) measurements from a tread-
mill run performed at 3 submaximal speeds before and after an individual marathon race.
C. Nicol', P. V. Komi', P. Marconnet2 'Department of Biology of Physical Activity, University of Jyviskyli, Finland, ZLaboratory of
Biomechanics and Biology of Exercise, University
of Nice Sophia Antipolis, Nice, France
Key words: stretch-shortening cycle; fatigue; endurance running; kinematics: eiectromyography; economy
Caroline Nicol, Department of Biology of Physical Activity, University of Jyviskyli, PL 35, SF-40351
Jviskylir, Finland
Accepted for publication September 20,1991
Material and methods
Subjects
A group of 8 experienced 20- to 35-year-old (mean
30) endurance runners (1 woman and 7 men) vol-
unteered for the experiment. Their sport was ei- ther marathon or triathlon. The group weight aver- aged 68 (59-93) kg and height 177 (168-190) cm. Experimental design
The experimental design included different tests repeated for each subject on 2 successive sessions, day 1 and day 2, separated by a period of 4 d. The whole protocol has been presented in full detail (10). The present measurements were performed on day 2, which was the actual marathon running and testing day. Because of the complexity of the measurements, the race had to be run individually. A marathon speed was chosen for each runner on the basis of his or her actual training state and last performance in competition. This selected speed was then continuously shown by a cyclist pacing the runner. However, the levels of motivation, performance and consequently fatigue might have been lower than in a real competition situation.
Testing and measurement
Wo-dimensional video measurement took place just before and after the marathon, during a con- tinuous treadmill run including 3 steps at constant speed. Each subject ran successively 3 min at a slow speed (2.75, 3 or 3.5 mes-'), 2 min at a medium speed (3.75,4 or 4.5 mms-'), and 1 min at a faster speed (4.5, 5 or 6 mas-'). These speed levels (called SS, MS and
FS,
respectively) corre- sponded approximately to 75,100 and 125% of the selected marathon velocity. The last 30 s run at each speed was videotaped from the left side usinga 200
Hz
NAC video camera. Since the camera hadto be moved to the track between the 2 treadmill recordings, its position was precisely indicated on
the floor and a reference (0.5 X 0.5 m) mark was
recorded before the 2 run series to calibrate ex- actly the video data.
The EMG activity from the lateral gastrocne-
mius (GA) muscle of the left leg was recorded at
each speed during the 30-s videotape period. Bi- polar Beckman miniature skin electrodes with an inter-electrode distance of 20 mm were used. The longitudinal position of the electrodes on the mus- cle belly was secured by adhesive strips and marked carefully on the skin for the postmarathon test. For this reason the integrated EMG (IEMG) could be compared intraindividually between the pre- and postmarathon tests. The amplifier gain in the recording site of EMG was 500, with high and low cut-off frequencies of 25 and 500
Hz,
respec- tively. The pre-amplified EMG signals were sub- sequently stored onto a magnetic tape (Racal 14), together with the following signals: the heel and ball contacts given by 2 foot switches fixed under the left shoe, and the knee angle displacement recorded by an electrical goniometer (Elgon).During the whole period of the test, the subjects were connected to a Jaeger Eos Sprint comput- erized spiro-ergometric system. Expired air was pumped continuously from a mixing bag at the ambient barometer pressure, passed through a drying tube as did the reference (air) gas, and was analysed for O2 and C 0 2 content using rapid
Jaeger O2 paramagnetic and COz infrared absorp-
tion analysers, respectively. This test was taken not only before and after the marathon, but also after 20 km of the race. Thus, the marathon run was interrupted for this test in the middle of the race for about 10 min. Neither EMG nor kinematic parameters were taken during this half-marathon test. Prior to each test the analysers were cali- brated using primary standard calibration gas, and the pneumotachograph with a 3-litre syringe.
The heart rate was recorded with a Sport-tester every 15 s during each treadmill test and during the
whole marathon run. A trigger signal was put in the memory of the Sport-tester at the end of every
10 km to allow an averaging for every quarter of the marathon race.
Data processing
Video analysis. One complete left leg cycle (from a left foot contact to the next contact of the same foot) was analysed at each speed. The sequence was chosen in the middle part of the 30-s record- ing, during a regular pattern of running (without any noticeable acceleration or deceleration of the runner). A 14-segment model (12) of the runner was used when analysing the video with a NAC high-speed video position analyser on-line to a HP
150 micro-computer. The horizontal and vertical coordinates of the body segments (head and neck, trunk and the left and right sides of the upper arm,
forearm, hand, thigh, lower leg and foot), together with 5 reference marks, were recorded visually from each selected frame. The vertical coordinates
of the neck and hip were adjusted on each frame to the vertical change noticed for the head. This kept the trunk and head segments at the same length throughout the running cycle. As every second frame of video was analysed, the inter-frame time interval was 0.01 s.
A Hewlett-Packard HP lOOOF computer was
used for further analysis. The kinematic variables calculated from the original coordinates included angular displacement and angular velocity at the left hip, knee, and ankle joints. In addition, the respective angles of the left thigh, lower leg, and foot with the vertical were determined at 2 specific moments of the left step: at heel strike and at toe-off. Cyclograms of the thigh-angle against knee-angle were plotted for angle diagrams.
In
addition, Dempster's (12) coefficients were used to ascribe relative masses to the 14 body segments for the determination of the centre of gravity (CG) movement. These values were used to measure the range (H) of vertical oscillation of CG during the respective left and right steps. Referring to Cava- nagh et al. (13), the obtained values (LH and RH)
were used to measure the mean vertical motion of
the CG [MH = (LH
+
RH)/2] as well as an indexof asymmetry [(LH
+
RH)/2 x MH].Step length, support time, and nonsupport time values of the 2 selected steps were also determined from the video. Each of these support periods was divided into braking and push-off phases according to the moment of maximal knee flexion given by the angular video analysis. This indirect method
was also used when the EMG activity of the gas-
trocnemius muscle was referred to the respective braking and push-off phases, which for the EMG
Marathon fatigue effects 0.4 0.3 0.2 0.1 - -
-
)-.BEFORE o---* AFTER CONTACT PUSH-OFFBRAKING
0SLOW MEDIUM FAST
RUNNING
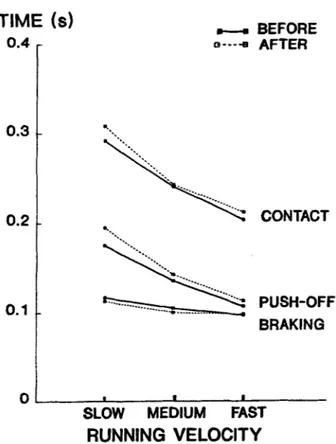
VELOCITYFig. 1. Group average values of the braking, push-off, and total durations of the selected left contact at the 3 treadmill speeds before and after the marathon
analysis were obtained from the Elgon signal. Since the speed of the treadmill was known for each recorded run, the average stride length and stride rate were estimated by calculating from the video the time taken for 20 successive strides (20 left and right steps), including the selected one. EMG analysis. Using a micro-computer system
(Victor-Sirius), the EMG and knee angle signals
were first digitized with a sampling frequency at 1
kHz for each channel. The EMG analogue signal
was full-wave rectified. For each speed recording, heel contact was taken as a trigger signal to sum the EMG signal of 30 left-foot contacts. The ob- tained individual EMG-time curves were not fil- tered. The period of pre-activation was defined as beginning 100 ms before heel contact. The knee goniometer signal (filtered at 30
Hz)
was used to separate the respective periods of knee flexion and knee extension. The GA activation of the knee extension phase was integrated for the exact pe- riod of the GA muscle activation and not for the whole push-off phase. The IEMG was taken for each of these periods and multiplied by an appro- priate factor to get the corresponding IEMG for 1 s duration. It is unfortunate that pre- and postma- rathon EMG signals were both correct for only few subjects.Metabolic data acquisition. Using the system previ-
ously described, both oxygen consumption (VoJ
and respiratory exchange ratio (R) were deter- mined for every 30-s period of the collected gas. The fast speed condition was clearly too short (1 min) to be described as steady-state conditions. From the obtained values at the 2 slowest speeds (SS and
MS),
only the measures of the last 30 swere kept for further analysis. The pre- to postma-
rathon comparison of the VQ and R values could
be performed for 6 subjects. The individual values of Vo2 were then corrected for the corresponding values of R, converted into joules, and expressed per kg of the individual body mass. The energy
expenditure
(e)
measured during the half-mara-thon treadmill test was expressed in absolute val- ues because the weight was not measured in the middle of the race.
Ordinary statistical procedures were used to cal- culate mean, standard deviation, paired two-tailed t-test values and linear correlation coefficient. The level of significance was set at P<0.05.
Results
During the marathon, the runners reduced their speed so that the group average value (for 6 sub- jects) declined 17rt8% (ZWO.01) between the first and the last 10 km of the race. The actual average running speed of each 10-km period of the race was 15.1k1.5 (0-10 km), 14.551.8 (10-20 km), 13.5k1.9 (20-30 km), and 12.5k1.6 kmah-' (30-40 km). The heart rate values stayed the same during the first 3 measure periods (162.5k3.7, 162.5 f5.2, and 160.7k3.9 beats. min-'
,
respec- tively), but it declined sligthly (NS) during the last10 km (151.8rt8.7 beatsmin-I).
-
DELTA CT DELTA FT ( A l l l 8 )SLOW S P E E D MEDIUM S P E E D FAST S P E E D
-80
-601
- 1 0 0 ' 1 I I I : I I ' I I I I I I I " I I I I I 1 I '
1 2 3 4 6 666 1 2 3 4 5 6 6 6 1 2 3 4 SUBJECTS (n')
Fig. 2. Individual pre- to post-marathon changes in the contact and flight times of the selected left step at each treadmill speed. A subject is encircled when he or she presented the same trend of changes at the 3 speeds. Two individual results are missing at fast speed
SLOW SPEED A PUSH-OFF (U) 00 60- I -lo 0 lo PO SO 40 A CONTkct (%I MEDIUM SPEED A PUSH-OFF 0
/
I
FAST SPEED A PUSH-OFF 4%) W-
10 - l o 4 0 6 P S ~ ~ I Y 4 0 A CONTkM (%)Fig. 3. Relationships between the relative changes in the dura-
tion of the push-off phase and total contact at slow, medium
and fast speed, respectively
The kinematic analysis of the pre- and postma-
rathon treadmill tests showed that the marathon run did not affect the running pattern similarly in all individual subjects. This resulted in an absence
of significant group changes in such variables as the respective braking, push-off and total dura- tions of the examined left contacts (Fig. 1). Simi- larly, the mean stride length did not vary signif-
icantly (SS: -0.1+3.6%,
MS:
-1.6+2.7% and FS:0.4+3.4%) because of opposite individual trends in the respective contact and flight time changes (Fig. 2). However, the duration of the push-off phase relative to the total contact increased at SS
(59.8+2.5% vs 63.5+2.54%, PcO.05) and at
MS
(56.7+4.3% vs 60.9+3.4%, PCO.01). The me-
dium
speed condition presented additional signif- icant changes in the contact phase: the knee joint was more flexed at heel strike (150.4k5.7" and 146.6+5.5", before and after the marathon,P<0.05),
the maximal hip extension velocity in-creased (6.6k0.8 and 7.6k0.9 rad-s-', PCO.01)
and the range of hip extension increased after heel strike (56.0k4.1" vs 61.1+5.2", PeO.001).
The relative changes induced by the marathon for the push-off phase duration were positively related at each speed level of the respective chang- es of the contact time (Fig. 3). In addition, the changes in contact time were related at both MS
(n=8) and FS (n=6) to the relative changes in- duced in the respective knee flexion velocity, max- imal knee flexion, and range of knee extension during the contact phase (Table 1). These relation- ships are illustrated in Fig. 4 by 3 examples of
individual knee-thigh angle cyclograms measured
before and after the marathon at
FS.
Each speedlevel also showed a relationship between contact
and flight times (SS: r=-0.87, Pc0.01;
MS:
The pre- to postmarathon comparison of the metabolic data revealed an expected increase (Pe0.05) of the group average value of submaxi-
mal oxygen consumption (Vo, ) at both slow
and medium speed levels (S?? 35.8k2.3 vs
45.2k6.8 ml.kg-'.min-', MS: 47.822.4 vs
54.5k4.1 ml.kg-'.min-'). The respective values of
respiratory exchange ratio (R) decreased signif- icantly (SS: 0.88k0.01 vs 0.76k0.04, PCO.01, and
MS:
0.96k0.01 vs 0.83k0.04, P<0.05), but thegroup average values of remained increased
(SS:
0.73k0.05 vs 0.90k0.13 kJ.kg-'.min-'; MS: 1.00k0.06 vs 1.11kO.07 kJ.kg-'.min-'; PC0.05). However, the comparison of the absolute values of
fi
between the pre- and half-marathon treadmill tests showed no statistically significant changes atSS
(45.9k4.5 and 48.4k4.5 kJ-min-', respectively, before the race and after the first 20 am), andalmost the same values at MS (62.435.6 and
Marathon fatigue effects
Table 1. Relationships between the relative changes (A%) of the left contact time and the changes occurring during the same period in the knee kinematics and push-off phase duration
Speed Contact time Knee flexion (A%) Range of knee Push-off
level (A%) extension (A%) (A%)
velocity max. flexion
-6.5 -0.5 t4.5 -10.8 0.0 -3.6 t1.7 t44.1 -25.1 0.0 S -3.0 t0.4 t23.7 -7.3 0.0 I -3.0 t4.9 t2.8 t28.9 -4.5 0 t3.6 +2.7 -14.8 -15.6 t5.9 W t7.1 -3.2 -20.7 -17.4 t17.6 t30.4 t0.4 t6.4 t8.1 t38.5 t30.8 t5.1 t39.8 t4.1 t53.3 (n = 8) F0.77 PO.19 ~ 0 . 1 4 ~ 0 . 9 7 NS NS NS P<O.OOl (n = 8) -7.1 -4.0 -4.0 0.0 t4.5 t4.3 t8.0 t23.8 4 . 8
-
12.0 -2.5 -2.9 t3.4 t4.0 t4.5 t10.5 ~ 0 . 7 4 R0.05 -18.0 $18.7 -9.8 -0.3 t11.7 t72.1 t57.1 t279.4 ~ 0 . 7 7 Pc0.05 -10.9 -31.3 -29.4 -22.7 t12.9 t 18.4 t10.1 tE4.9 PO.94 P<0.001 -6.3 0.0 t7.1 t6.7 t7.1 t 16.7 t 15.4 t45.5 PO.96 kO.001 F a S t (n = 6) -4.8 -2.5 -4.3 -1.2 0.0 t1.8 0.0 -0.1 tl1.1 t3.0 t25.0 t5.0 ~ 0 . 8 2 R0.05 -28.5 t7.6 -1.5 t12.9 t38.1 t89.6 ~ 0 . 9 2 RO.001 -21.2 -2.2 -9.7 -4.1 -11.7 t 3 . 5 ~ 0 . 9 6 kO.01 -8.3 0.0 -8.3 0.0 t22.2 t36.4 P0.96 P<O.Ol FAST SPEEDA MAX KNEE PLFl(KWI ICI
0
Fig. 4. Relationships between the relative changes in contact time (upper left) and range of knee extension (upper right). The lower part of the figure gives examples (subjects A, B and C)
and in maximal knee flexion KNEE ".
of thigh-knee angle cyclograms 10.
measured before (
- - - -
0 ) and EXT...o - w - 1 o - m a R w - w - w - 4 0 - 1 0 0 lo 4 0 D- w - 4 4 -n 0 lo 10
F L lHl HANQLE EXT. FL. THIQHANQLE EXT. FL. THIQHANQLE EXT.
after (0-0) the marathon at
0.4 0.3 0.2 0.1 C I
-
BEFORE ( TIME Is) *---a AFTER CONTACT PUSH-OFF BRAKINGSLOW MEDIUM FAST
RUNNING VELOCITY c.BEFORE a---- AFTER P I / BRAKINQ /
,
I%IATIONSLOW MEDIUM FAST RUNNING VELOCITY
62.1k6.0 kl-min-l). The corresponding postma-
rathon values were 54.0k5.7 and 62.4k5.6
Hemin-', respectively, at SS and MS. The pre- to
postmarathon increase was significant at
SS
(P<0.05).
There were no consistent correlationsbetween the pre- to postmarathon changes of the measured metabolic and biomechanical variables.
In the EMG analysis, the pre- to postmarathon
comparison could be obtained at the 3 studied speeds for only 3 subjects. Although these subjects did not show any changes in the contact character- istics (Fig. 5, left), they presented an increase (NS)
of the GA activation during both knee flexion and knee extension (Fig. 5, right). The same trends
were seen in 2 other subjects whose IEMG had
been obtained at 2 speeds only. The respective
comparison of the group average values revealed
at both MS (n=5) and FS (n=4) an increase
( R O . 0 5 ) of the G A IEMG of the knee extension
phase (MS: 182.2k35.6 vs 230.7k36.2 pV-s and
FS:
230.9k31.8 vs 296.6rt37.3 ~1V.s). This IEMGincrease resulted from 2 combined trends: a grea-
ter EMG amplitude and a reduced duration of GA
activity. The time reduction was significant at FS
(98k24 vs 73+15 ms,
Pe0.05).
There were no significant relationships at the 2
slowest speeds between the gastrocnemius EMG
changes and the gross metabolic changes. Discussion
A decrease in running velocity and a greater de-
gree of change in the mechanics of the gait have been reported to occur during the last 10 km of a
marathon run (6). In this line, the present results revealed a significant decline of the averaged
run-
ning velocity between the 2nd and 3rd quarters of the marathon. This was reflected also in the clear reduction in maximal sprint velocity demonstrated
Fig. 5. Left. The durations of the contact period and its braking and push-off phases on the treadmill for 3 subjects measured before and after the marathon. Right. The same comparison for the integrated electromyographic
(IEMG) activity of the
gastrocnemius (GA) muscle. This
analysis included also the preactivation phase before the contact on the belt
by these runners at this stage of the race (10).
Similarly, the heart rate values recorded as the marathon progressed revealed a maintained level during the first 30 km, and a subsequent lower rate
(NS)
during the last 10km.
This latter observation might suggest a lesser motivation of the runners during the last part of the race. A loss of running economy at the end of the race was demonstrated by an increase of energy expenditure in the post- marathon treadmill running test, whereas there were no changes after the first 20 km. Interest- ingly, the reduction in running economy remained slight compared with the dramatic loss observed with the same subjects in both maximal force and isometric endurance performances (10, 11). It is thus of particular interest to investigate the effects of this long-term SSC-type fatigue on the running pattern itself, and the possible adaptations of the neuromuscular system.The analysis of the kinematic results revealed few significant effects of the marathon race on the treadmill running pattern of the group as a whole. However, it is important to note that the running style appeared to be greatly individual in both unfatigued and fatigued states as well as how the changes occurred between these 2 situations (Fig.
6). A similar discrepancy between group and indi- vidual changes of the running pattern with fatigue has been emphasized by other biomechanical stud- ies (8, 14). In addition, the study revealed that only 2 subjects (encircled on Fig. 2) presented a
constant trend of changes in contact and flight times at the 3 running speeds. The relative changes in contact time did not affect systematically the duration of the subsequent flight phase. This pres- ence of great inter- and intraindividual variations makes it difficult to examine how fatigue may have influenced running economy. However, to better estimate intra- and interindividual variability, the
Marathon fatigue effects BEFORE
Fig. 6. Individual plots of contact their changes across all measured speeds of the treadmill test
(CT) and flight (FT) times and CT n
(z)
loo AFTER MARATHON CT nu)-
..d
BEFORE-AFTER MARATHON AFT(2
I 1number of steps to be analysed should have been increased considerably. This could not be done for this study and, therefore, the true influence of the intra- and intersubject variability on the results remains speculative.
The literature presents complex and controver- sial relationships between distance-running me- chanics and economy in both fatigued (7) and non- fatigued states (3, 15). According to Williams &
Cavanagh (3), economy would be related to a
weighted sum of the influence of many variables, with no factors being of critical importance. In this line, our results did not reveal any significant rela- tionship between the respective metabolic and kin-
ematic changes induced by the marathon. On the other hand, a number of studies (1,2) have agreed that, in the absence of fatigue, the aerobic demand in running is curvilinearly related to the stride length (SL), with the lowest value being at the self-selected stride. Although the present mara- thon did affect some individual values of SL, no relationships were found with the corresponding alterations in either oxygen consumption or energy expenditure (Fig. 7a). This might be partly ex-
plained by the limited magnitude of the mean SL
changes (3.3 cm). Cavanagh & Williams (1) re- ported a mean increase of only 0.2 ml.kg-'.min-' in oxygen uptake for a mean absolute difference of
A € SLOWSPEED X MEDIUMSPEED
70 (%I
.
10
A l i
.
SLOW SPEED x MEDIUM SPEED70 I (%I I
.
X . X x,"
, 60 4 02ot
I
X xm xt ,
x , , , , 10 o ' l ' i ' - 6 - 4 - 9 - 2 - 1 0 1 2 9 4 5 6 ASTRIDE LENGTH (%)Fig. 7a. Relationships between the relative pre-post marathon Changes in average stride length (SL) and energy expenditure (E) at slow (m) and medium (x) treadmill speeds.
4.2 cm between self-selected and optimal
SL.
In addition, the present data included few individual cases showing minor changes in energy expendi- ture, despite a large increase inSL
or the opposite trend (Fig. 7a). This indicates that theSL
changes alone may not reflect the alterations in running economy in the present fatigue situation.A given change in SL could be seen to result from various time combinations of its different phases. Thus, maintained
SL
would have some- times masked the large and opposite changes of the respective contact time and flight time (Fig. 2). These latter relative changes were not significantly related to the respective changes in energy expen- diture. Nevertheless, the contact time changes re- main informative in this regard because of signif- icant relationships with kinematic alterations of the knee joint during the contact phase (Fig. 3).The group included runners who showed either an increase or a slight decrease of the contact time after the marathon run (Fig. 2). Longer contact times resulted in most cases from an increased maximal knee flexion associated with a subsequent larger knee extension and a longer push-off phase (Table 1). In addition, a greater maximal knee flexion was usually preceded by a faster knee flex- ion velocity (Table 1). These kinematic changes might suggest a deterioration of the muscular tol- erance to impact with a consequent loss in the recoil characteristics of the muscles. This would explain the need for an increased muscular work during the push-off phase to maintain the imposed running velocity. It is interesting that similar find- ings have been reported at constant marathon speed on the track (6).
These observations are also in agreement with the EMG measurements on the track from a previ- ous marathon study (9), which revealed greater
-
-6 0 5 10 16 20
A PUSH-OFF/TOT (%)
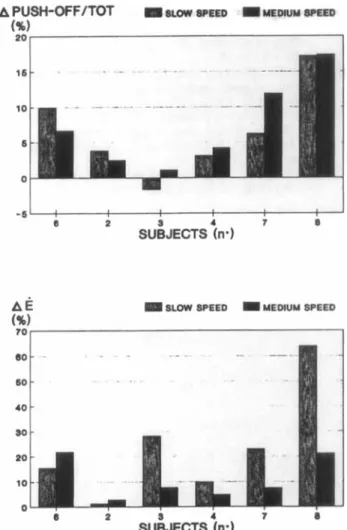
Fig. 7b. Relationships between the relative pre- to postma- rqthon changes in relative duration of the push-off phase com- pared to the total contact time (PUSH-OFF/TOT) and energy expenditure (E) at slow (M) and medium ( X ) treadmill speeds.
EMG activity of the vastus medialis, vastus lat- eralis and gastrocnemius muscles, especially dur- ing the push-off phase of the contacts. In the pre- sent study, the limited analysis of the EMG activity of the gastrocnemius muscle confirmed these ear- lier findings. It is interesting to note that an in- creased EMG activity of this muscle during the push-off phase occurred in few cases despite in- creased activation during the braking phase. Since one function of this muscle is to decelerate the forward motion of the tibia after heel strike (16,
17), this would support the hypothesis of a de- creased tolerance to impact with a subsequent need to compensate for the loss of elastic recoil. In addition, EMG activity of this muscle increased even in the absence of changes in the contact time and flight time (Fig. 5). On the other hand, there was no significant relationship at
SS
and MS be- tween the changes in the EMG activity of the GA muscle and the changes in energy expenditure. Adjustments of the neural activation at submaxi- mal speed of running could possibly attenuate the kinematic alterations of the running pattern. Therefore, it would be interesting to examine again this relationship in thorough EMG analysis involving several muscles.It is questionable, however, that the observed kinematic changes constituted also beneficial ad- aptations to fatigue. From the analysis of the brak- ing phase, it appears that only 2 subjects presented increases in both angular velocity and amplitude of the knee flexion at the 3 speeds. In addition, the braking contact time was mostly decreased. This
was not the case in the maximal runs on the track (10). On the other hand, the significant increases of the relative duration of the push-off phase ob- served at both slow and medium speeds were not related to the respective increases in oxygen con-
Marathon fatigue effects might therefore reflect some adaptations to fatigue more than a real failure to compensate for it.
In conclusion, the marathon fatigue resulted in a large diversity of interindividual changes in run- ning kinematics and economy. The muscular force impairment revealed by the other tests (10, ll) was confirmed by a deterioration in resistance to im- pact and an increase of energy expenditure. This may imply a decrease of running economy in these individuals. However, there were no systematic intraindividual kinematic changes at the 3 speeds, and no specific relationships either between group kinematic and metabolic changes. At the present state of these studies in progress, it is still an unan- swered question how much running kinematics and economy are related during fatigue.
A € m $Low SPEED I MEDIUM SPEED
(%I T O , I 60 40 so 20 10 n
Fig. 8. Above. Relative changes in the ratio of the push-off phase duration to total contact for individual subjects. The subjects are indicated by the same numbers as in Fig. 2.
Below. The same individual comparison for the changes in the energy expenditure (E).
sumption (Fig. 7b). The intraindividual compari- son of these changes at slow and medium speeds would even suggest a better use of this strategy at medium speed (Fig. 8) despite significant increases in both velocity and range of hip extension. A
better adaptation at medium speed may be partly explained by the fact that this speed was individu- ally the closest to the selected marathon velocity. This could also support the greater homogeneity of the group changes at this particular treadmill speed. On the other hand, the observed kinematic changes at the hip joint have been demonstrated to have a beneficial effect on the economy of a tread- mill run in the absence of fatigue (7). This could be partly explained by the differences between runs on the track and on a treadmill. According to Frishberg (18), the moving treadmill belt would reduce the energy requirement of propelling the body by moving the supporting foot and the lower leg backwards. The present kinematic changes
Acknowledgements
The authors wish to acknowledge J. Avela, A. Belli, T. Gelat, C. Chapuis, M. Ruuskanen, P. Puttonen and M. L. Romppa- nen for technical assistance and data analysis. This research was partly supported by grants 8590/78188,88/722/89 and 202 72UW (Komi) and D14/54/90 (Nicol) from the Ministry of Education, Finland, as well as by grant 88/8275 (Marconnet) from the Conseil Rkgional PACA and by I'ANVAR.
References 1. 2. 3. 4. 5 . 6. 7. 8. 9. 10. 11.
Cavanagh PR, Williams KR. The effect of stride length variation on oxygen uptake during distance running. Med Sci Sports Exerc 1982: 14(1): 30-35.
Kaneko M, Matsumoto M, Ito A, Fuchimoto T. Optimum step frequency in constant speed running. In: Jonsson B, ed. Biomechanics X-B. Champaign, IL: Human Kinetics Publishers, 1987: 803-807.
Williams KR and Cavanagh PR. Relationship between distance running mechanics, running economy, and per- formance. J Appl Physiol 1987: 63: 1236-1245.
Elliot BC, Roberts AD. A biomechanical evaluation of the role of fatigue in middle-distance running. Can J Appl Sport Sci 1980: 5(4): 203-207.
Elliot BC, Ackland T. Biomechanical effects of fatigue on
10,OOO meter running technique. Res Q Exerc Sport 1981: 52(2): 160-166,
Buckalew DP, Barlow DA, Fischer JW, Richards JG. Biomechanical profile of elite women marathoners. Int J Sport Biomechanics 1985: 1: 330-347.
Williams KR, Cavanagh PR, Ziff JL. Biomechanical stud- ies of female distance runners. Int J Sports Med 1987: 8
Williams KR, Snow R, Agruss C. Changes in distance running kinematics with fatigue. Int J Sport BiomechaNcs
1991: 7(2): 138-162.
Komi PV, Hyvirinen T, Gollhofer A, Mero A. Man-shoe surface interaction: special problems during marathon running. Acta Univ Oulu [A] 1986: 179: 69-72.
Nicol C, Komi PV, Marconnet P. Fatigue effects of mara- thon running on neuromuscular performance. I. Changes in muscle force and stiffness characteristics. Scand J Med Sci Sports 1991: 1: 10-17.
Nicol C, Komi PV, Marconnet P. Fatigue effects of mara- thon running on neuromuscular performance. 11. Changes (Suppl): 107-118.
in force, intergrated electromyographic activity and endu- rance capacity. S a n d J Med Sci Sports 1991: 1: 18-24. 12. Dempster WT. Space requirements of the seated oper-
ator: geometrical, kinematic, and mechanical aspects of the body with special reference to the limbs. WADC Tech Rep 1955: 55-159.
13. Cavanagh PR, Pollock ML, Landa J. A biomechanid
comparison of elite and good distance runners. In: Milvy P, ed. The marathon: physiological, medical, epidemiolog- ical, and psychological studies. New York: New Academy of Sciences Publishers, 1977,301: 328-345.
14. Chapman AE. Hierarchy of changes induced by fatigue in
sprinting. Can J Appl Sports Sci 1982: 7(2): 116-122.
15. Cavanagh P, Andrew GC, Kram R, Rodgers MM, Sand- e m n DJ, Hennig EM. An approach to biomechanical profiling of elite distance runners. Int J Sport Biomechan- ics 1985: 1: 36-62.
16. Elliot BC, Blanksby BA. The synchronization of muscle
activity and body segment movements during a running cycle. Med Sci Sports 1979: ll(4): 322-327.
17. MacIntyre DL and Robertson DGE. EMG profiles of the knee muscles during treadmill running. In: Jonsson B, ed. Biomechanics X-A. Champaign, IL: Human Kinetics Pub- lishers, 1987: 289-294.
18. Frishberg BA. An analysis of overground and treadmill