HAL Id: hal-01161817
https://hal.inria.fr/hal-01161817
Submitted on 9 Jun 2015
HAL is a multi-disciplinary open access
archive for the deposit and dissemination of
sci-entific research documents, whether they are
pub-lished or not. The documents may come from
teaching and research institutions in France or
abroad, or from public or private research centers.
L’archive ouverte pluridisciplinaire HAL, est
destinée au dépôt et à la diffusion de documents
scientifiques de niveau recherche, publiés ou non,
émanant des établissements d’enseignement et de
recherche français ou étrangers, des laboratoires
publics ou privés.
New cascade model for hierarchical joint classification of
multisensor and multiresolution remote sensing data
Ihsen Hedhli, Gabriele Moser, Sebastiano B. Serpico, Josiane Zerubia
To cite this version:
Ihsen Hedhli, Gabriele Moser, Sebastiano B. Serpico, Josiane Zerubia. New cascade model for
hierar-chical joint classification of multisensor and multiresolution remote sensing data. IEEE International
Geoscience and Remote Sensing Symposium, Jul 2015, Milan, Italy. �hal-01161817�
NEW CASCADE MODEL FOR HIERARCHICAL JOINT CLASSIFICATION OF
MULTISENSOR AND MULTIRESOLUTION REMOTE SENSING DATA
Ihsen Hedhli
*†, Gabriele Moser
†,Sebastiano B. Serpico
†and Josiane Zerubia
**
INRIA, AYIN team, France, [email protected]
†
DITEN, Department of Electrical, Electronic, and Telecommunications Engineering
and Naval Architecture – University of Genoa, Italy, [email protected]
ABSTRACT
This paper addresses the problem of multisensor fusion of COSMO-SkyMed and RADARSAT-2 data together with optical imagery for classification purposes. The proposed method is based on an explicit hierarchical graph-based model that is sufficiently flexible to deal with multisource coregistered images collected at different spatial resolutions by different sensors. An especially novel element of the proposed approach is the use of multiple quad-trees in cascade, each associated with a set of images acquired by different SAR sensors, with the aim to characterize the correlations associated with distinct images from different instruments. Experimental results are shown with COSMO-SkyMed, RADARSAT-2, and Pléiades data1.
Index Terms— Multisensor, multiresolution remote
sensing images, supervised classification, hierarchical Markov random fields.
1. INTRODUCTION
Nowadays, remote sensing images of our planet from satellite systems are acquired continuously; they have become powerful scientific tools to enable better understanding and improved management of the Earth and its environment.
The ability to fly a wide variety of satellites into space brings a different ways of seeing the world that the physical proprieties of satellites leave behind. Current and forthcoming satellite missions for Earth observation (EO; e.g., Sentinel, Pléiades, COSMO-SkyMed (CSK), RADARSAT-2 (RS2), TerraSAR-X) convey a huge potential for such diversity, as they allow a spatially distributed and temporally repetitive view of the monitored area at the desired spatial scales. In particular, the latest French, Italian, and Canadian missions involving multispectral or synthetic aperture radar (SAR) payloads, i.e., Pléiades, CSK, and RS2, are especially relevant, as they
1We would like to thank the French Space Agency (CNES), the Italian
Space Agency (ASI) and the Canadian Space Agency (CSA) for providing respectively Pléiages, COSMO-SkyMed and Radarsat-2 images.
offer multiple spatial resolutions (also including very high resolution, VHR) and frequent temporal coverage, two crucial properties in EO applications especially in risk management (e.g., global detection of urban areas, change detection, infrastructure mapping, land-cover and land-use mapping). However, the use of remote-sensing image analysis has been mostly addressed so far by focusing separately on multispectral or SAR imagery and by working with single-resolution images. This approach bears the obvious advantage of simplicity but may be, in general, severely suboptimal. From a methodological viewpoint, when multisensor (multispectral and SAR) or multiresolution images of a given event are available, using them separately, for instance to map changes, discards the correlation among these multiple data sources and, most importantly, their complementarity. SAR and multispectral images exhibit complementary properties in terms of noisy behavior (often strong in SAR due to speckle, usually less critical in multispectral imagery), feasibility of photo-interpretation (usually easier with optical than with SAR data), sensitivity to atmospheric conditions (strong sensitivity for optical acquisitions, and almost no sensitivity for SAR) and to Sun-illumination (critical sensitivity for multispectral sensors, day-and-night acquisition capability for SAR) [1]. Similarly, the multiple spatial resolutions collectively offered by missions such as CSK, Pléiades, and RS2 offer complementary information in terms of synoptic view and spatial/geometrical detail. Exploiting these complementarities is expected to convey important information for EO applications.
In particular, the opportunity of joint availability of CSK and RS2 imagery offers very high resolution (VHR), all-weather, day/night, short revisit time data, polarimetric, and multifrequency (X- and C-bands for CSK and RS2, respectively) acquisition capabilities. Similarly, the strong differences in terms of wavelength range (microwave vs. visible and near infrared), sensitivity to cloud cover and Sun illumination and noise-like properties make the joint use of CSK and RS2 data together with optical data especially interesting for many applications to environmental monitoring and risk management.
In this framework, accurate and time-efficient classification methods are especially important tools to support rapid and reliable assessment of the ground changes and damages
induced by a disaster, in particular when an extensive area has been affected. Given the huge amount and variety of data available currently from last-generation VHR satellite missions, including the aforementioned CSK and RS2 and multiple missions carrying optical payloads (e.g., Pléiades, WorldView-2 and -3), the main difficulty is to develop a classifier that can take benefit of multiband, multiresolution, and multisensor input imagery.
The proposed method addresses the problem of multisensor fusion of CSK and RS2 data together with optical data for classification purposes, allows input data collected at multiple resolutions and additional multiscale features derived through wavelets to be fused, and supports both single-date and multitemporal image classification.
The proposed approach extends the recent method proposed in [2], which focused on multiresolution and multitemporal optical image classification using hierarchical Markov random fields (MRFs) [3, 4, 5], to a multiscale and multisensor model that fuses the spatial, multiresolution, and also multisensor information conveyed by input images collected by CSK, RS2, and one optical sensor (Pléiades) at multiple spatial resolutions. This model is a hierarchical Markov random field (MRF) integrated with a quad-tree structure. The choice of a quad-tree allows taking benefit from its good analytical properties [6] (e.g., causality) and to apply non-iterative classification algorithms such as the maximization of posterior marginals (MPM) [7], which associates, with each site in the considered data set, the most probable class label given the entire input multisource information.
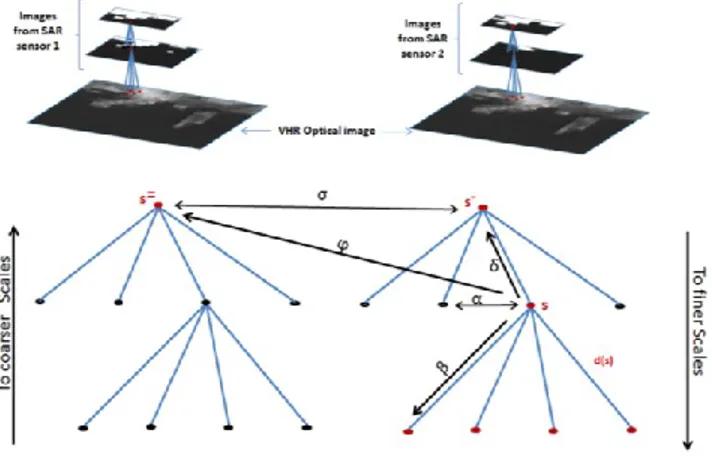
An especially novel element of the proposed approach is the use of multiple quad-trees in cascade (see Figure 1), each associated with the set of images given by each SAR sensor. This approach aims at exploiting the multiscale information that is typically associated with either SAR or optical VHR imagery.
2. MULTISENSOR HIERARCHICAL MODEL
Let us focus, on the case of single-date multisensor data composed of CSK and/or RS2 imagery and of an optical image. For each SAR sensor, the input images are inserted in a separate quad-tree structure on the basis of their resolutions, while missing levels of the quad-tree are filled in using wavelet transforms [8] of the optical images embedded in finest-resolution level (see Figure 1). Then, a novel formulation of MPM is proposed for the resulting multisensor quad-tree.
Specifically, given the whole multisensor data pyramid y, the posterior marginal p(xs |y) of the label xs of each site s in the quad-tree related to one of the two SAR sensors is expressed as a function not only of the posterior marginal of the parent node p(xs− |y) in the same quad-tree but also of
the posterior marginal p(xs= |y) of the parent node in the quad-tree associated with the other sensor, with the aim to
characterize the multisensor correlations associated, at different scales, with distinct images in the input multisource data [2]. To this end, the proposed multisensor MPM algorithm runs in two recursive steps, referred to as “bottom-up” and “top-down” passes. These steps involve various transition probabilities for each site of the quad-tree, which foster that pixels maintain the same class membership across consecutive sensors and scales (see δ, β, α, σ and φ relationships in Figure 1), and the pixelwise class-conditional statistics of the image data at each node of each quad-tree, given the corresponding (satellite or wavelet) features. For more details on this MPM formulation on multiple quad-trees, we refer to [2]. Here, we especially focus on its extension to support multisensor fusion of CSK, RS2, and optical imagery.
Figure 1: Multisensor hierarchical structure
Given a training set for each scale level, for each class m, scale n and sensor, we model the corresponding class-conditional marginal probability density function (PDF) 𝑝(𝑦𝑠|𝑥𝑠= 𝑚) using finite mixture distributions (𝑠 ∈ 𝑆𝑛):
𝑝(𝑦𝑠|𝑥𝑠= 𝑚) = ∑ 𝜋𝑖𝑚𝑛 𝐹𝑖𝑚𝑛(𝑦𝑠|𝜃𝑖𝑚𝑛), 𝐾𝑚𝑛
𝑖=1
(1) where 𝜋𝑖𝑚𝑛 are the mixing proportions, 𝜃𝑖𝑚𝑛 is the set of the
parameters of the ith PDF mixture component of the 𝑚𝑡ℎ class at the 𝑛𝑡ℎ scale level 𝐹
𝑖𝑚𝑛, and 𝑆𝑛 is the 𝑛th level of the quadtree associated with the considered sensor.
Mixture modeling is performed depending on the different types of remote sensing imagery used in this study. Indeed, when the input data at the 𝑛𝑡ℎ scale level is an optical image, class-conditional marginal PDF 𝑝(𝑦𝑠|𝑥𝑠= 𝑚) related to each class 𝑚 can be modeled by a Gaussian mixture [9] with a set of parameters associated with the corresponding mean and variance. On the opposite, SAR acquisitions are known to be affected by speckle [10]. For this reason, we use appropriate SAR-specific models for such images, such as the generalized gamma distribution [11]. The parameters of the mixture model for both SAR and optical images are estimated through the stochastic expectation maximization (SEM) algorithm [12, 13], which is an iterative stochastic parameter estimation algorithm
developed for problems characterized by data incompleteness and approaching, under suitable assumptions, maximum likelihood estimates. For each scale, SEM is applied to the training samples of each class to estimate the related parameters.
4. RESULTS
In this section, we discuss the results of the experimental validation of the developed model on two datasets acquired over Port-au-Prince (Haiti) using:
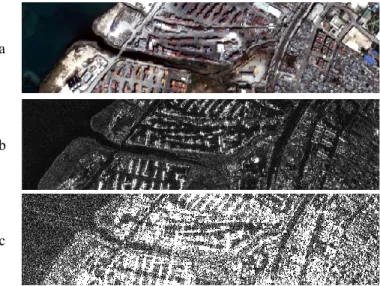
a panchromatic Pléiades acquisition at 0.5m resolution (Pléiades, © CNES distribution Airbus DS, 2011), shown in Figures 2(a) and 3(a).
a CSK image (© ASI, 2011), X band, HH polarization, Spotlight mode (1m pixel spacing), geocoded, single-look, shown in Figures 2(b) and 3(b).
a RS2 image (© CSA, 2011), C band, HH polarization, Ultra-Fine mode (1.56 m pixel spacing), geocoded, single-look, shown in Figures 2(c) and 3(c).
a b c
Figure 2: First site used for experiments: (a) Pleiades, (b) CSK, and (c) RS2 images
a
b
c
Figure 3: Second site used for experiments: (a) Pléiades, (b) CSK, and (c) RS2 images
The RS2 image comes at 1.56 m pixel spacing. To fit with the dyadic decomposition imposed by the quad-tree, we slightly resampled the data to obtain the 0.5 = 2 /4 m resolution. Down sampling from 1.56 to 2 m is expected to
have a minor impact on the classification map, because the resampling ratio is quite close to unity.
Five classes are considered: urban (red), water (blue), low vegetation (green), sand (yellow) and containers (purple). We present the final classification maps in Figures 4 and 5 and the corresponding classification accuracies on the test samples in Table 1.
To the best of our knowledge, none of the previously developed application-specific methods allows a direct integration of both multi-resolution and multi-source optical-SAR data without major pre- or postprocessing. The results obtained by the proposed multisensor hierarchical method, see Figures 4(d) and 5(d), lead to a detailed classification with a remarkable level of classification map regularity. The main source of misclassification is the container area, where containers are partly classified as urban. This is consistent with the fact that no texture features are used as input to the considered hierarchical MRF. In Table 1 we compare numerically the results obtained with the proposed hierarchical method when considering either only Pléiades, or both SAR (CSK or RS2) and optical images. We observe an improvement related to the combination of the two SAR images, in particular in the urban areas for which the joint use of CSK and RS2 acquisition represents a significant source of discriminative information. More specifically, we have observed that the optical image has a relevant effect in the sand and vegetation discrimination, and the SAR acquisitions are jointly very helpful to detect the urban. This confirms the potential of exploiting the synergy of the data provided by the CSK and RS2 missions with respect to each other and to the imagery collected by spaceborne optical HR cameras.
5. CONCLUSIONS
In the proposed method, multisensor and multiresolution fusion is based on explicit statistical modeling. It combines a marginal statistical model of the considered input optical and both CSK and RS2 SAR images, through hierarchical Markov random field modeling based on quadtrees in cascade, leading to a statistical supervised classification approach. We have developed a novel multisource MPM-based hierarchical Markov random field model that takes into account both SAR and optical information and leads to improved robustness of the classifier. When applied to several challenging high-resolution image sets associated with urban and sub-urban test sites, the proposed method gives high overall classification accuracy with a small computation time (a few minutes). A further advantage of the proposed classifier is that it can be generalized to the use of different satellites and/or acquisitions dates by extending the multiple quadtree structure suitably. This research work will be done in the near future. A further interesting extension will be the integration of texture features to better discriminate subclasses of the urban area.
a b
c d
Figure 4: (a) Result using a only optical Pleiades images, (b) Result using both Pleiades and CSK acquisitions, (c) Result using both Pleiades and RS2 acquisitions (d) Result using all sensors.
a
b
c
d
Figure 5: (a) Result using a only optical Pleiades images, (b) Result using both Pleiades and CSK acquisitions, (c) Result using both Pleiades and RS2 acquisitions (d) Result using all sensors.
11. REFERENCES
[1] J.A. Richards, X. Jia, Remote Sensing Digital Image Analysis, 2nd Ed. New York: Springer-Verlag, 2001.
[2] I. Hedhli, G. Moser, J. Zerubia, S.B. Serpico. “New cascade model for hierarchical joint classification of multitemporal, multiresolution and multisensor remote sensing data”, IEEE International Conference on Image Processing, France, 2014. [3] S.Z. Li, Markov random field modeling in image analysis 3rd
edition, Springer, 2009.
[4] G. Winkler, Image Analysis, Random Fields and Markov chain Monte Carlo Methods 2nd edition, Springer, 2003. [5] Z. Kato and J. Zerubia. Markov Random Fields in Image
Segmentation. Boston: NOW publishers, 2012.
[6] M. Basseville, A. Benveniste and A. S. Willsky. “Multiscale autoregressive processes, Part I: Schur-Levinson parametrization.” IEEE Trans. on Signal Processing, vol. 40. no. 8, pp. 1915-1934, 1992.
[7] J.M. Laferté, P. Perez and F. Heitz. “Discrete Markov mod-eling and inference on the quad-tree.” IEEE Trans. Image Processing, pp. 390–404, 2000.
[8] M. Crouse, R. Nowak and R. Baraniuk. “Wavelet-based statistical signal processing using hidden Markov models.” IEEE Trans. Signal Processing, vol. 46, pp. 886–902, 1998. [9] J.A. Richards, Remote Sensing Digital Analysis, Springer,
2013
[10] H.C. Li, W. Hong, Y.R. Wu, and P.-Z. Fan, “On the empirical-statistical modeling of SAR images with general-ized gamma distribution,” IEEE J. Sel. Top. Signal Process, vol. 5, no. 3, pp. 386–397, 2011.
[11] C. Oliver and S. Quegan, Understanding Synthetic Aperture Radar images. SciTech Publishing, 2004.
[12] G. Celeux, D. Chauveau and J. Diebolt. “Stochastic versions of the EM algorithm: an experimental study in the mixture case.” Journal of Statistical Computation and Simulation, vol. 55, no. 4, pp. 287–314, 1996.
[13] V. Krylov, G. Moser, S.B. Serpico, J. Zerubia “Enhanced dictionary-based SAR amplitude distribution estimation and its validation with very high-resolution data”, IEEE Geosci. Remote Sensing Letters, vol. 8, no. 1, pp. 148-152, 2011.
Water Urban Vegetation Bare Soil containers Total
Only Pléiades 100 % 61.66 % 81.69 % 82.82 % 56.72% 76.57%
Pléiades + CSK 100% 44.32% 83.54% 74.75% 49.12% 70.34%
Pléiades + RS2 92.56% 44.85% 79.85% 78.62% 42.15% 67.60
Pléiades +CSK+RS2 90.79% 91,45 % 82,59 % 81.02 % 54.85% 80,14 %