HAL Id: hal-01221726
https://hal.archives-ouvertes.fr/hal-01221726
Submitted on 16 Apr 2021
HAL is a multi-disciplinary open access
archive for the deposit and dissemination of sci-entific research documents, whether they are pub-lished or not. The documents may come from teaching and research institutions in France or abroad, or from public or private research centers.
L’archive ouverte pluridisciplinaire HAL, est destinée au dépôt et à la diffusion de documents scientifiques de niveau recherche, publiés ou non, émanant des établissements d’enseignement et de recherche français ou étrangers, des laboratoires publics ou privés.
Comparison between continuous and localized methods
to evaluate the flow rate through containment concrete
structures
Ludovic Jason, Benoit Masson
To cite this version:
Ludovic Jason, Benoit Masson. Comparison between continuous and localized methods to evaluate the flow rate through containment concrete structures. Nuclear Engineering and Design, Elsevier, 2014, 277, pp.146-153. �10.1016/j.nucengdes.2014.06.010�. �hal-01221726�
1
Comparison between continuous and localized methods to evaluate the flow
rate through containment concrete structures
L. Jason*
,**
,1, B. Masson***
* CEA, DEN, DANS, DM2S, SEMT, LM2S2, F-91191 Gif sur Yvette, France
** LaMSID, UMR CNRS-EDF-CEA 8193, F-92141 Clamart, France *** Electricité de France (EDF), SEPTEN, F-69628 Villeurbanne, France
Abstract. In this contribution, different techniques are compared to evaluate the gas flow rate
through a representative section of a reinforced and prestressed concrete containment structure. A continuous approach is first applied which is based on the evaluation of the gas permeability as a function of the damage variable. The calculations show that the flow rate becomes significant only when the damage variable crosses the section. But in this situation, the continuous approach is no longer fully valid. That is why localized approaches, based on a fine description of the crack openings, are then investigated. A comparison between classical simplified laws (Poiseuille flow) and a more refined model which takes into account the evolution of the crack opening in the depth of the section enables to define the validity domain of the simplified laws and especially the definition of the associated “reference opening”.
Keywords. reinforced concrete, gas flow, permeability, crack 1. Introduction
The internal confinement vessel of nuclear power plants (1300 and 1450 MWe), combined with the external vessel and the ventilation and filtration of the capacity delimited by the two vessels, represent the third passive barrier for the environmental protection in case of accidents. Considering that there is no liner on the internal vessel and only concrete has to provide the air tightness, it is essential to estimate the associated potential leakage rate, especially during the integrity tests which are realized every ten years to check the effective ability of the containment building to protect the environment. As the transfer properties (permeability for example) are a direct function of the mechanical degradation (Picandet et al, 2001), it also supposes to correctly characterize the mechanical evolution of the reinforced prestressed concrete structure.
Concerning the mechanical behavior, many studies have been launched worldwide, especially to characterize the failure pressure, which corresponds to the maximum admissible pressure that the structure is able to support. For example, Hu and Lin (2006), Lee (2011) or Barbat et al (1998) performed the ultimate analysis of prestressed containment structures using shell or 3D elements. These computations are generally based on real industrial cases or on scaled experiments (one-sixth scale Sandia experiment (EPRI, 1989), third scale MAEVA mock-up (Granger et al, 2001) or one-fourth scale BARCOM tests (BARC, 2007)).
1 Corresponding author : [email protected]
2
In the situation in which information about the leakage rate is also required ((Granger et al, 2001) for example), two main techniques are generally used. In the first one, hydro (and/or hygro) thermo mechanical equations are solved. The transfer properties (gas and liquid permeability especially) are generally functions of the mechanical damage (damage – permeability law in (Gawin et al, 2003) or permeability as a function of the microcrack density in (Bary et al, 2008) for example). This technique, based on a continuous description of the mechanical problem, is known to be particularly representative until the damage variable becomes localized. At this stage, discrete approaches are preferred. The fluid flow inside localized cracks is then computed from the crack openings using Poiseuille’s law (Simon et al, 2007) among others. To bridge the gap between the two approaches, models are proposed to describe the evolution of the transfer property from a diffuse to a discrete regime (evolution of the permeability as a function of the crack width (Ozbolt et al, 2010) or relationship between permeability and damage that is consistent with the two situations (Pijaudier-Cabot et al, 2009)). These different contributions, among others, clearly show that techniques exist to evaluate fluid transfer through concrete structures. But their applications to containment buildings of nuclear power plants are rather rare. For integrity tests (increasing pressure inside the volume during one day), the relevance of the existing methods, and their predominance, may be questioned. What is the importance of the diffuse regime (Darcy’s law) compared to localized one (Poiseuille’s law)? Are engineering laws, based on average values of the crack openings, relevant compared to more sophisticated approaches which take into account the refined geometry of the cracks? To try to provide answers, different techniques are compared in this contribution on a simplified portion of a containment building, which corresponds to a section of the current wall. Starting from a given mechanical state (distribution of the damage variable and/or crack openings), continuous and localized approaches are applied to evaluate the associated leakage rates.
In a first part, the reference structure is presented and the mechanical computation is performed to obtain the initial states of damage. Then, a method to evaluate the fluid transfer using Darcy’s law is applied (Jason et al, 2007). Finally, localized laws are investigated, using two methods: simplified engineering equations (Poiseuille flow with average values of the crack openings) and a more refined approach that takes into account the geometry of the crack. Conclusions about the relevance of each method are finally provided.
2. Simulation of the mechanical behavior
The fluid flow through concrete is directly influenced by the mechanical state, through the damage distribution or the crack opening. Its determination thus needs to know the reference mechanical state. This is defined in this section.
2.1. Description of the reference structure
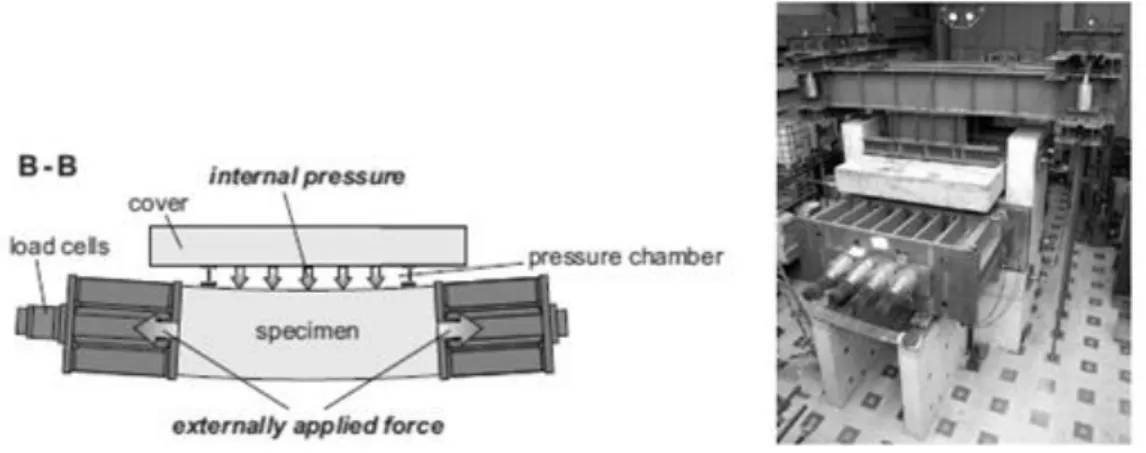
The studied structure is based on the experiment performed in (Hermann et al, 2009), whose principle is to represent the mechanical behavior of a Representative Structural Volume of a French containment building. The aim is to be as close as possible to an extraction of the current wall (Jason et al, 2010). The structure is under pressure loadings to simulate integrity tests (Figure 1). To simplify the simulation, only one section of the volume is considered in this contribution. The geometry of the tested specimen is presented in Figure 2 (top). It includes concrete and one tendon (which means steel duct, grout and steel tendon).
3
Figure 1. Description of the experiment on the Representative Structural Volume (from (Hermann et al, 2009))
Figure 2. Description of the simulated structure.
The structure is supported on an elastomer which is also represented in the simulation (Figure 2 bottom). The material properties have been chosen to be as representative as possible to the experiment. For the boundary conditions (Figure 3), restrained displacements are considered at the bottom of the elastomer (zero displacement) while a perfect relation is supposed between the elastomer and the concrete, the steel duct and the concrete, the steel duct and the grout and the grout and the steel tendon (simplified hypothesis). For the loadings (Figure 3), an increasing internal pressure Pint is applied along the internal line to represent the integrity test loading. A constant
compressive pressure (Ppre = 6.75 MPa) and a tensile pressure Ppint, proportional to the internal
pressure, are applied on each lateral line. They model the effect of the horizontal prestress and the orthoradial effect of the internal pressure respectively:
0,0889 rad Rint= 21,9 m e = 1,2 m Steel duct Grout Steel tendon Concrete Elastomer
4 int int int
.
pP R
P
e
The simulation (plane strain) is performed using the isotropic damage model developed in its initial form by Mazars (1984) and implemented in the finite element code Cast3M (2013). The law characterizes the mechanical degradation through an isotropic scalar damage variable ranging from 0 (safe material) to 1 (fully damaged material).
2.2. Mechanical simulation
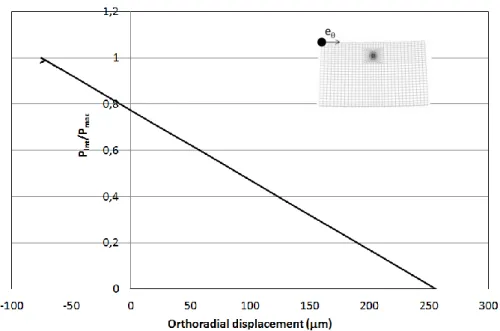
The results of the mechanical simulation are presented in this section. Figure 4 gives the evolution of the orthoradial displacement of a point located on the internal line as a function of the applied internal pressure. For a zero pressure, the initial orthoradial displacement is positive (compression). This is due to the horizontal prestress which is applied before the internal pressure. With an increasing Pint, the orthoradial displacement decreases and gradually becomes negative (tension).
Once the internal pressure has reached its maximum value Pmax, a nonlinear regime appears. It can
be associated with the development of the mechanical degradation.
Figure 3. Boundary conditions and loadings
Figure 4. Pressure – displacement curve for the simulated structure
Tensile pressure Ppint Tensile pressure Ppint
Prestress pressure Ppre Prestress pressure Ppre Internal pressure Pint
Restrained displacements
5
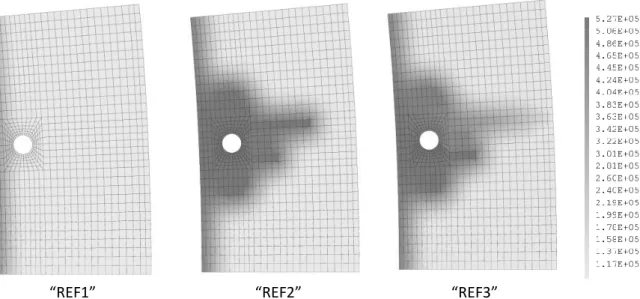
REF1 REF2 REF3
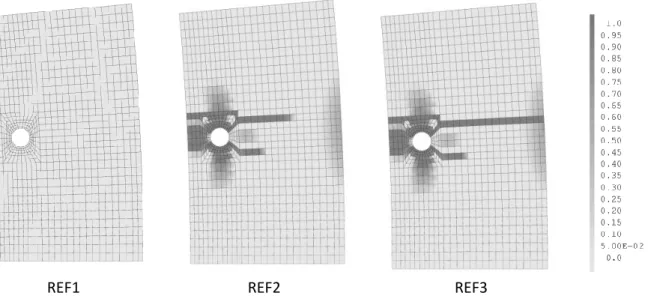
Figure 5. Reference damage distributions obtained from the mechanical simulation
Figure 5 gives the distribution of the damage at different loading steps. In the first case (named “REF1”), the damage variable is constant equal to zero and the response is still elastic. In the second case (beginning of the nonlinear phase), the damage develops from the vertical tendon which corresponds to a geometrical and a material heterogeneity in the volume (Jason et al, 2010). Finally, in “REF3” situation (end of the computation), damage is fully localized and crosses the section (from the inside to the outside of the volume).
3. Evaluation of the fluid flow through continuous approach
In each damaged situation (“REF1”, “REF2” or “REF3”), the flow rate can be estimated. In this section, it is calculated using Darcy’s law where the gas permeability is a direct function of the damage variable.
3.1. Description of the method
To calculate the fluid flow, the methodology from (Jason et al, 2007) is used. It is based on the resolution of the mass balance equations ((Bear, 1991) or (Mainguy et al, 2001)). It assumes that the gaseous phase does not contain vapor. This hypothesis fits to the case of integrity tests of containment facilities where dry air pressure is applied inside the concrete vessel. Moreover, no interaction between the air and the liquid phases is assumed.
Considering the gas transport, the associated mass balance equation is written as:
( g(1 Sl)) .( (1 Sl) gvg)
t
(1)
with the material total porosity (ratio of pore volume to the total volume), Sl the degree of
saturation (ratio of water volume to the pore volume), g the gas mass density and vg the gas
velocity.
6 (1 l) g g ( g) g K S v P
(2)where Kg is the gas permeability and
g the gas dynamic viscosity.Considering the gas as “ideal”, the hydraulic problem is finally driven by the equation:
(1
S
l)
P
g.(
P(
P
g) (
P
g))
t
(3)with P(Pg) the “diffusive” coefficient :
( ) g P g g g K P P
(4)From this equation, it is clear that the gas transfer is directly influenced by the value of the gas permeability. One of the crucial point is thus to determine the key parameters that influence the hydraulic conductivity. In this contribution, the evolution of the gas permeability is a function of the damage variable. It first follows the equation from (Jason et al, 2007):
0 8.67 0.3 0 if D < 0.035 .10 if D 0.035 g D g K K K K (5)
where K0 is the initial permeability.
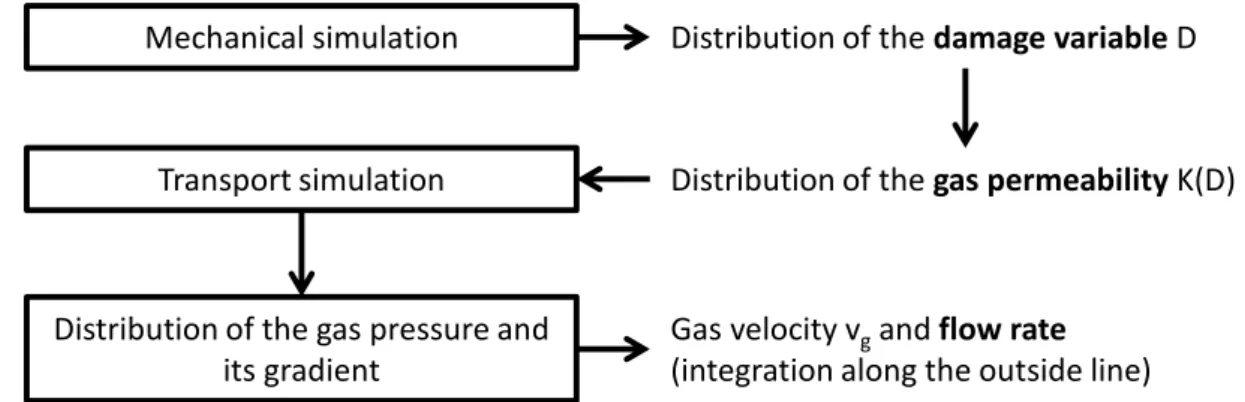
Eq. (3) is solved and provides the gas pressure. From its distribution and the distribution of its gradient, Eq. (2) gives the apparent gas velocity. The flow rate is finally computed by integration along the outside line. The principle of the method is summarized in Figure 6.
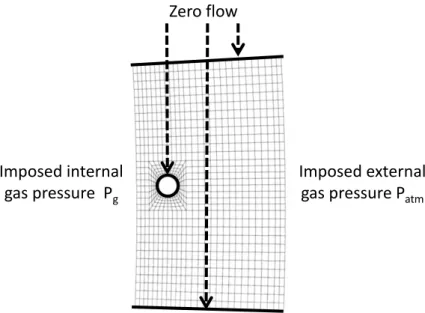
3.2. Application to the reference structures
The method is applied to the structure described in section 2. The loading and the boundary conditions are given in Figure 7. The internal gas pressure is imposed following the chronology of the integrity tests. It supposes a linear increase from the atmospheric pressure Patm to 0.53 MPa in 24
hours. The inside pressure is then constant for one other day. The total simulated time is thus 48 hours. The external pressure is kept constant equal to the atmospheric pressure.
Figure 6. Principle of the calculation of the flow rate
Mechanical simulation Distribution of the damage variable D
Distribution of the gas permeability K(D) Transport simulation
Distribution of the gas pressure and its gradient
Gas velocity vgand flow rate (integration along the outside line)
7
Figure 7. Description of the transport simulation
Variables Symbol Value
Degree of saturation Sl 70 %
Material porosity 0.15
Dynamic viscosity
g 186 10-7 kg.m-1.s-1Initial permeability K0 10-19 m2
Table 1. Parameters of the simulation.
The parameters of the simulation are summarized in Table 1. To simplify the resolution, a constant mean value of the saturation degree is chosen, in accordance with the values calculated in (Granger, 1995) or in (Jason et al, 2007). The initial permeability has been computed to include the effect of the saturation degree ((Jason et al, 2007) or (Monlouis-Bonnaire et al, 2003) for example).
To evaluate the impact of the mechanical degradation, the method is applied using each damage distribution obtained in Figure 5. It thus supposes three different simulations and three different values of the flow rate. Each value of the flow rate corresponds to one mechanical state (no damage (“REF1”), damage initiation (“REF2”) and localized damage band (“REF 3”)).
The distributions of the gas pressure are given in Figure 8 (t = 48h). They clearly show the impact of the damage variable. On the undamaged structure, the “diffusion” of the pressure is very low, due to the low values of the permeability. On the contrary, with the development of the damage, the pressure inside the damaged zones quickly reaches the value of the internal pressure.
In cases “REF1” and “REF2”, the permanent regime is not reached at the end of the computation (t=48 hours). The diffusion of the pressure is limited due to the portion of the volume which remains undamaged (low values of the gas permeability). On the contrary, in “REF3” case, a more gradual distribution of the gas pressure is obtained along the reference line (Figure 9). The steady state is reached with a classical parabolic evolution.
Zero flow
Imposed internal
gas pressure P
gImposed external
gas pressure P
atm8
“REF1” “REF2” “REF3”
Figure 8. Distribution of the gas pressure obtained for each damage situation at the end of the transport simulation
Figure 9. Evolutions of the gas pressure along the reference line (bold line on the right) for the three reference damage states
Damage reference state “REF1” “REF2” “REF3”
External flow rate (m3.s-1.m-1) 1.47 10-23 1.47 10-9 6.55 10-2
Table 2. External flow rate computed at the end of the computation
The external flow rate is then computed using Eq. (2) (Table 2), per unit of height (m3.s-1.m-1). It
shows that the flow rate is very low until the damage zone crosses the section. In cases “REF1” and “REF2”, the undamaged zone prevents the leakage. Even when interpolated to the whole containment structure (height equal to 60m and angular section equal to 2), this external flow rate is significantly smaller than the admissible flow rate.
The flow rate obtained for “REF1” state can be easily compared to the permanent flow rate Qstatio.,
using the equation (Picandet et al, 2001) :
2 2 int . ( ) 2 g atm statio g atm K P P Q l eP
(6)9
where l is the radial length (0.0889.Rint) (Figure 2). It comes Qstatio.1.18 108 m3.s-1.m-1. This value
is significantly higher than the simulated one. It confirms that the permanent regime is not reached at the end of the simulation.
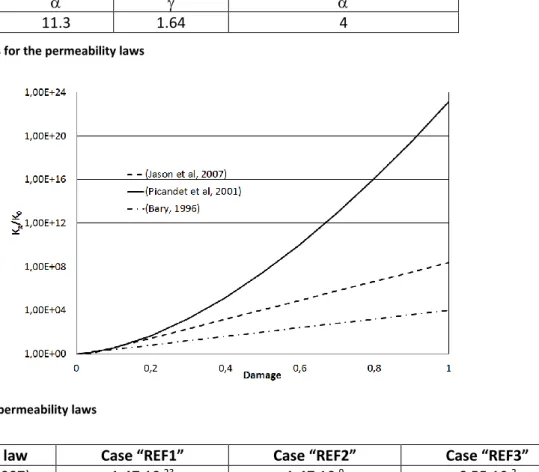
It is clear from Eq. (2) that the choice for the damage-permeability law may influence the computed values of the flow rate (Davie et al, 2012). To investigate this effect and to corroborate the conclusions, two other relations are tested (Eq. (7) and Eq. (8) from (Picandet et al, 2001) and (Bary,1996) respectively) 0
exp(( D) )
gK
K
(7) 010
D gK
K
(8)The parameters of the laws are given in Table 3. The three evolutions are presented in Figure 10. The differences are essentially observed for high values of the mechanical damage. Table 4 gives the computed external flow rates with the different permeability laws.
(Picandet et al, 2001) (Bary, 1996)
11.3 1.64 4
Table 3. Parameters for the permeability laws
Figure 10. Damage-permeability laws
Permeability law Case “REF1” Case “REF2” Case “REF3”
(Jason et al, 2007) 1.47 10-23 1.47 10-9 6.55 10-2
(Picandet et al, 2001) 1.47 10-23 1.18 10-9 0.167
(Bary, 1996) 1.47 10-23 2.81 10-10 2.64 10-6
10
As previously mentioned, the flow rates in cases “REF1” and “REF2” are very low. In case “REF3”, the effect of the damage-permeability law is clearly underlined. It thus confirms the previous conclusions: the flow rate becomes significant only when the damage variable crosses the section. But in this situation, the proposed continuous approach is no longer fully valid. Moreover, as the permeability only depends on the damage variable, the flow rate reaches its maximum value once the damage is equal to one along the crossing line. As a consequence, it does not evolve any more after the permanent state, even if the crack opening increases. That is why in this case, localized methods are preferred.
4. Evaluation of the fluid flow by localized approaches
Two methods based the definition of the crack openings are proposed. Only “REF3” case is considered as these approaches are only applicable when a discrete crack is developed through the section.
4.1. Engineering practice
When localized cracks are observed, engineering laws are often used to evaluate the leakage rate through the concrete wall. The Poiseuille equation in infinite parallel plates is generally considered. It supposes a laminar flow inside concrete cracks ((Gelain and Vendel, 2008) for example):
2 2 3 1 2 0
(
)
24
g rp
p
Q
l
w
RT
e
(9)where Q is the volumetric flow rate, l the crack extent, R the mass perfect gas constant, T the gas temperature, p1 and p2 respectively the inside and outside gas pressures, e the crack length, wr the
reference crack opening, the gas dynamic viscosity and 0 the mass density.
represents the effect of the tortuosity and of the roughness of the cracks. As its determination is still under discussion in the literature ((Picandet et al, 2001), (Suzuki et al, 1992) for example), with values ranging from 0.08 to 0.5, only the ratio
Q
will be studied in this contribution.Eq. (9) depends on the crack openings which need to be computed from the damage distribution proposed in “REF3” situation. Using a damage model for concrete asks the question of how to characterize the crack discontinuity from a continuous description of the problem. To answer this question, the principle proposed by (Matallah et al. 2010) and successfully applied in (Jason et al, 2013) is used. It consists in defining a cracking strain εf from the distribution of the total strain ε and
of the total stress following the equation:
f el
(12) where1
( )
eltr
I
E
E
(13)11
with E and respectively the concrete Young modulus and Poisson ratio. “tr” stands for the trace operator and I is the identity matrix. With this technique, the cracking strain corresponds to the inelastic part of the total strain. From the distribution of the cracking strain, the crack opening is calculated by multiplying it by the length hn of each concrete element in the direction n normal to
the crack (computed from the direction of the strain localization bands)
(
t).
n f n
w
n
n h
(14)This technique is applied to evaluate the flow rate in “REF3” case. The results are illustrated in Figure 11. A gradual increase of the crack opening from the inside to the outside of the surface is observed, underlining the role of the vertical tendon that initiates the crack but also “prevents” its opening. Eq. (9) is applied to the reference line (Figure 11). p1 and p2 pressures are taken equal to 0.45 MPa
(from the value obtained at x = 0.4 m in Figure 9) and 0.1 MPa (atmospheric pressure at x = 1.2 m) respectively. The temperature is equal to Eq. (9) supposes the definition of a “reference” crack opening. Different situations are considered in this contribution: wr equal to the maximum crack
opening along the line (251 m) (case 1), wr equal to the mean value of the crack opening along the
line (183 m) (case 2), 3
1
r
w
i
in which i is the mean value of1
3w
(152 m) (case 3) and finally wrequal to the minimum crack opening along the line (90 m). Table 5 gives the values of the external flow rate obtained for each case, using the parameters provided in
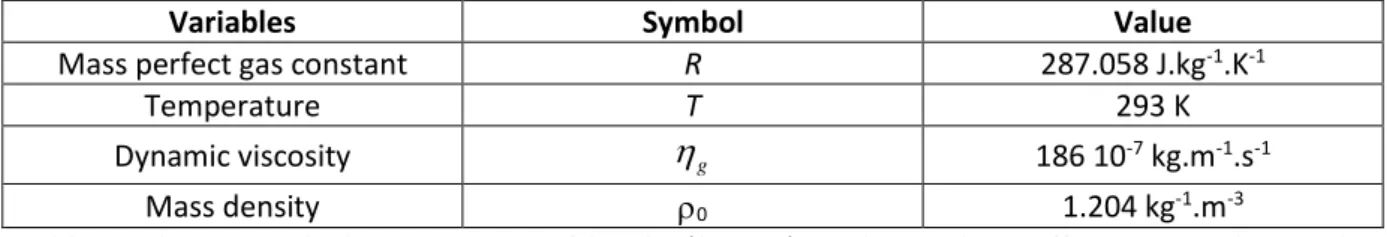
Variables Symbol Value
Mass perfect gas constant R 287.058 J.kg-1.K-1
Temperature T 293 K
Dynamic viscosity
g 186 10-7 kg.m-1.s-1Mass density 0 1.204 kg-1.m-3
Table 6. They are calculated per unit of height (l = 1m). It shows clear differences in the results, depending on the importance given to the large openings compared to the small ones. In order to investigate the definition of the reference opening, this “engineering” method is compared to a more refined one in the next section.
12
Figure 11. Crack opening along the localized reference line
Case 1 Case 2 Case 3 Case 4
8.45 10-2 3.26 10-2 1.87 10-2 3.88 10-3
Table 5. Flow rates in m3.s-1.m-1 for the different values of the reference crack opening
Variables Symbol Value
Mass perfect gas constant R 287.058 J.kg-1.K-1
Temperature T 293 K
Dynamic viscosity
g 186 10-7 kg.m-1.s-1Mass density 0 1.204 kg-1.m-3
Table 6. Parameters for the flow rate calculation
4.2. Refined approach
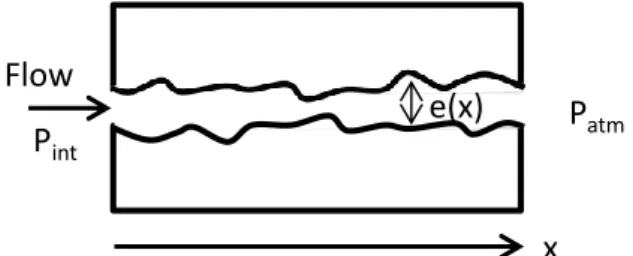
As the definition of the “reference” crack opening is essential in the definition of the fluid flow, a refined technique is now proposed. This approach is based on the work from (Simon et al, 2007) and (Caroli et al, 1995). The model was initially developed to evaluate the leakage of an air steam mixture through a traversing crack taking into account condensation and the evolution of the crack opening along the channel axis. In this contribution, it is applied to the simplified configuration where only dry air is considered, to be in accordance with the hypothesis chosen in the previous section (Figure 12). The main equations are the balance equations in the permanent state:
2
0
4
q
x
qu
P
u
e
f
x
x
(9)where x is the channel axis coordinate, q the total mass flow rate per extent length unit, u the mean velocity, f the friction factor, P the total pressure, e the crack opening and the density.
The friction factor is computed using the following equation
96
Max(
;
)
Re
cf
f
(10)where Re is the Reynolds number.
96
Re
f
corresponds to the laminar flow condition. For turbulent flow, the Colebrook formula is used:1
2.51
2 log(
)
3.7
Re
cf
f
13
2e
with the crack roughness.
Compared to the previous approach, the refined model enables to take into account the evolution of the crack opening along the damaged line. It also takes into account the effect of the crack roughness.
Figure 12. Configuration for the fluid flow calculation
Following the recommendations from (Simon et al, 2007), the crack roughness is chosen equal to 100 m to be of the same order of magnitude as the crack opening. The flow rate is computed using the same boundary conditions as the “engineering” calculation.
A value of 9.30 10-3 m3.s-1.m-1 is obtained. Compared to the engineering laws, it means that:
- the values calculated with the simplified engineering laws have the good order of magnitude - the small crack openings have the most important influence, as the closer values are
obtained with “case 3” and “case 4” definition.
- the engineering laws are conservative (except if the minimum value of the crack opening is chosen) as they give overestimated values of the flow rate. It can be explained by the crack roughness which is taken into account through the friction coefficient in the refined approach and which has a direct influence on the computed flow rate.
To underline this last point, the flow rate is also computed considering a zero roughness for the crack channel. The computed value (2.24 10-2 m3.s-1.m-1)is very close to the one obtained in case 3 with the
simplified Poiseuille law (Table 3). It first confirms the influence of the small crack openings compared to the larger ones. It also illustrates the pertinence of case 3 definition for the reference opening, compared to the minimum opening (case 4). Finally, it shows the effect of the crack roughness on the flow rate (flow rate divided by 2 for the chosen parameters).
5. Conclusions
In this contribution, different techniques were applied to evaluate the flow rate through concrete structures in the conditions of integrity test loadings. With the continuous approach, based on a damage – permeability law, the low permeability prevents any significant leakage in the undamaged zones. The flow rate thus becomes significant only when the damage variable crosses the section. But in this situation, the continuous approach is no longer fully valid.
In this case, localized approaches based on the evaluation of the crack openings were applied. A comparison with a refined model shows that the classical engineering laws (Poiseuille flow) are valid
Flow
e(x)
x
14
if the reference crack opening is chosen to take into account the effect of the small openings especially. An appropriate definition is also proposed. It supposes to know the evolution of the crack opening in the depth of the structure, which may be difficult in an experimental situation.
Finally, as the flow rate in containment buildings is directly influenced by the cracks, it supposes to simulate every effect which influences their apparition (steel-concrete bound for example (Casanova et al, 2012)) but also to precisely predict the local crack properties (influence of the roughness in the friction factor when using the refined approach but also of the tortuosity which directly influences the value of in Poiseuille law). These points will be further investigated in a next study.
References
Barbat, A.H., Cervera, M., Hanganu, A., Cirauqui, C., Onate, E., 1998. Failure pressure evaluation of the containment building of a large dry nuclear power plant, Nuclear Engineering and Design 180, 251–270
Bary, B., Ranc, G., Durand, S., Carpentier, O., 2008. A coupled thermo-hydro-mechanical-damage model for concrete subjected to moderate temperatures, International Journal of Heat and Mass Transfer 51, 2847–2862
BARC, 2007. Containment Model Round Robin Analysis, Model Documents, Mumbai India
Bear, J., 1991. Mathematical modelling of transport in porous media, Modelling and applications of transport in porous media, J. Bear and J-M. Buchlin, eds., Kluwer Academic, Boston, USA.
Caroli, C., Coulon, N., Morton, D.A.V., Williams, M.M.R., 1995. Theoretical and experimental investigations on the leakage of steam, gas and aerosols through narrow cracks and capillaries. FISA 95-EU research on severe accidents
Casanova, A., Jason, L., Davenne, L., 2012. Bond slip model for the simulation of reinforced concrete structures, Engineering Structures 39, 66-78
Cast3m, 2013. http://www-cast3m.cea.fr
Davie, C.T., Pearce, C.J., Bicanic, N., 2012. Aspects of permeability in modeling of concrete exposed to high temperatures, Transport in Porous Medium 95, 627-646
EPRI, 1989. Analysis of the Sandia one-sixth scale reinforced concrete containment model. Report EPRI NP-6261, Electric Power Research Institute, Palo Alto, CA
Gawin, D. , Pesavento, F., Schrefler, B.A., 2003. Modelling of hygro-thermalbehaviour of concrete at high temperature with thermo-chemical and mechanical material degradation, Computer Methods in Applied Mechanics and Engineering 192, 1731–1771
Gelain, T., Vendel, J., 2008. Research works on contamination through cracked concrete walls, Nuclear Engineering and Design 238, 1159-1165
15
Granger, L., 1995. Comportement différé du béton dans les enceintes de centrales nucléaires : analyse et modélisation, PhD Thesis, Ecole Nationale des ponts et Chaussées
Granger, L., Fleury, F., Touret, J.P., 2001. Mechanical and leakrate predictions for nuclear power plant containments in accidental conditions Nuclear Engineering and Design, 203, 39–55
Granger, L., Rieg, C.Y., Touret, J.P., Fleury, F., Nahas, G., Danisch, R., Brusa, L., Millard, A., Laborderie, C., Ulm, F., Contri, P., Schimmelpfennig, K., Barre, F., Firnhaber, M., Gauvain, J., Coulon, N., Dutton, L.M.C, Tuson, A., 2001. Containment Evaluation under Severe Accidents (CESA): synthesis of the predictive calculations and analysis of the first experimental results obtained on the Civaux mock-up, Nuclear Engineering and Design 209, 155–163,
Herrmann, N., Gerlach, L., Müller, H.S., Le Pape, Y., Bento, C., Niklasch, C., Kiefer, D., 2009. PACE-1450 - Experimental investigation of the crack behaviour of prestressed concrete containment walls considering the prestressing loss due to aging, 20th International Conference on Structural Mechanics in Reactor Technology (SMiRT 20), Espoo, Finland,
Jason, L., Torre-Casanova, A., Davenne, L., Pinelli, X., 2013. Cracking behavior of reinforced concrete beams. Experiment and simulations on the numerical influence of the steel-concrete bond, International Journal of Fracture 180, 243-260
Jason, L. , Pijaudier-Cabot, G., Ghavamian, S., Huerta, A., 2007. Hydraulic behaviour of a Representative Structural Volume for containment buildings, Nuclear Engineering and Design 237, 1259-1274
Jason, L., Ghavamian, S., Courtois, A., 2010. Truss vs solid modelling of tendons in concrete structures: consequences on mechanical capacity of a Representative Structural Volume, Engineering Structures, 32, 1779-1790
Hu, H.T., Lin, Y.H., 2006. Ultimate analysis of PWR prestressed concrete containment subjected to internal pressure, International Journal of Pressure Vessels and Piping 83, 161–167
Lee, H.P., 2011. Shell finite element of reinforced concrete for internal pressure analysis of nuclear containment building, Nuclear Engineering and Design 241, 515–525
Matallah, M., La Borderie, C., Maurel, O., 2009. A practical method to estimate crack opening in concrete structures. International Journal for numerical and analytical methods in geomechanics 34, 1615-1633
Mazars, J. , 1984. Application de la mécanique de l’endommagement au comportement non linéaire et à la rupture du béton de structure, PhD Thesis, Université Pierre et Marie Curie
Mainguy, M., Coussy, O., Baroghel – Bouny, V., 2001. Role of air pressure in drying of weakly permeable materials, Journal of engineering mechanics 127, 1227-1238
Monlouis-Bonnaire, J.P., Verdier, J., Perrin, B., 2003. Prediction of the relative permeability to gas flow of cement-based materials, Cement and Concrete Research, 2333, 1-8
Ozbolt, J., Balabanic, G., Periškic, G., Kušter, M., 2010. Modelling the effect of damage on transport processes in concrete, Construction and Building Materials 24, 1638–1648
16
Picandet, V., Khelidj, A., Bastian, G., 2001. Effect of axial compressive damage on gas permeability of ordinary and high performance concrete. Cement Concrete Research 31, 1525–1532
Pijaudier-Cabot, G., Dufour, F., Choinska, M., 2009. Permeability due to the increase of damage in concrete: From diffuse to localized damage distributions, Journal of Engineering Mechanics 135, 1022-1028
Simon, H., Nahas, G., Coulon, N., 2007. Air–steam leakage through cracks in concrete walls, Nuclear Engineering and Design 237, 1786–1794
Suzuki, T., Takiguchi, K., Hotta, H., 1992, Leakage of gas through concrete cracks, Nuclear Engineering and Design 133, 121-130