Publisher’s version / Version de l'éditeur:
Optoelectronics, Photonics, and Imaging (Opto Canada 2002), 2002
READ THESE TERMS AND CONDITIONS CAREFULLY BEFORE USING THIS WEBSITE. https://nrc-publications.canada.ca/eng/copyright
Vous avez des questions? Nous pouvons vous aider. Pour communiquer directement avec un auteur, consultez la première page de la revue dans laquelle son article a été publié afin de trouver ses coordonnées. Si vous n’arrivez pas à les repérer, communiquez avec nous à [email protected].
Questions? Contact the NRC Publications Archive team at
[email protected]. If you wish to email the authors directly, please see the first page of the publication for their contact information.
NRC Publications Archive
Archives des publications du CNRC
This publication could be one of several versions: author’s original, accepted manuscript or the publisher’s version. / La version de cette publication peut être l’une des suivantes : la version prépublication de l’auteur, la version acceptée du manuscrit ou la version de l’éditeur.
Access and use of this website and the material on it are subject to the Terms and Conditions set forth at
Neptec 3D Laser Scanner for Space Applications: Impact of Sensitivity
Analysis on Mechanical Design
Samson, C.; Christie, I.; Beraldin, Jean-Angelo; Blais, François
https://publications-cnrc.canada.ca/fra/droits
L’accès à ce site Web et l’utilisation de son contenu sont assujettis aux conditions présentées dans le site LISEZ CES CONDITIONS ATTENTIVEMENT AVANT D’UTILISER CE SITE WEB.
NRC Publications Record / Notice d'Archives des publications de CNRC:
https://nrc-publications.canada.ca/eng/view/object/?id=4bb9c0d3-67da-4ba0-a77a-ec2bda790bf1 https://publications-cnrc.canada.ca/fra/voir/objet/?id=4bb9c0d3-67da-4ba0-a77a-ec2bda790bf1
National Research Council Canada Institute for Information Technology Conseil national de recherches Canada Institut de technologie de l’information
Neptec 3D laser scanner for space applications:
Impact of sensitivity analysis on mechanical design.
Samson, C., Christie, I., Beraldin, J.-A., and Blais, F.
May 2002
* SPIE Proceedings, Optoelectronics, Photonics, and Imaging (Opto Canada 2002), Ottawa, On. May 9-10, 2002. NRC 44921.
Copyright 2002 by
National Research Council of Canada
Permission is granted to quote short excerpts and to reproduce figures and tables from this report, provided that the source of such material is fully acknowledged.
CA02-503
Neptec 3D Laser Scanner for Space Applications: Impact of Sensitivity Analysis on Mechanical Design C. Samson, I. Christie, (Neptec Design Group, 302 Legget Drive, Kanata, ON, Canada K2K 1Y5), J.-A. Beraldin, and F. Blais
(
National Research Council of Canada, Ottawa, ON, Canada K1A 0R6)1. Introduction
The Neptec Design Group has developed the Laser Camera System (LCS), a new 3D laser scanner for space applications, based on an auto-synchronized principle from the National Research Council of Canada (NRC). The LCS was tested in August 2001 during mission STS-105 of the space shuttle Discovery to the International Space Station1.
Significant design changes had to be made to the original NRC laboratory scanner to port it to the space environment. In order to guide decisions, a sensitivity analysis was performed early in the design process to identify and rank the different parameters affecting the accuracy at which the LCS can determine the position of discrete target points. This paper reports on the impact of the sensitivity analysis on the mechanical design of the LCS.
2. Sensitivity Analysis
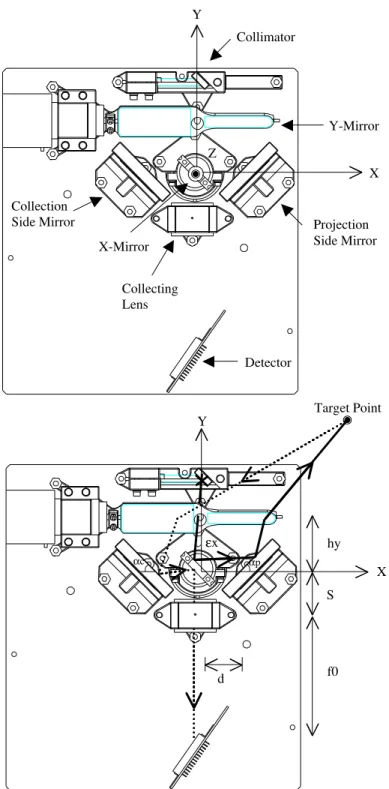
The main components of the LCS are shown in Figure 1 together with the coordinate system chosen for the analysis. The projection path (solid line) is: the collimated laser beam reflects on the scanning X-mirror, the fixed projection side mirror and the narrow region of the scanning Y-mirror before reaching a target point. The collection path (dotted line) is: the diffuse reflection from the target is collected on the wide region of the scanning Y-mirror, reflects on the fixed collection side mirror and the opposite surface of the scanning X-mirror, is focused by the collecting lens and illuminates the detector.
The LCS can be mathematically represented by trigonometric equations relating the angles of the different mirrors and the peak position on the detector to spatial X, Y and Z coordinates2. The equations include dimensional, angular and optical parameters, and conversion factors. The sensitivity analysis consisted in varying these parameters in small steps, and computing the corresponding variations in X, Y and Z. The difference between the X-coordinate of a target point for the base value of a given parameter, k, and for a small discrete increment, ∆k, is given by:
∆x = | x(k) – x(k±∆k) | . (1)
Similar equations are used for the Y- and Z-coordinates. For photogrammetry applications, X- and Y-coordinate accuracy is the most important.
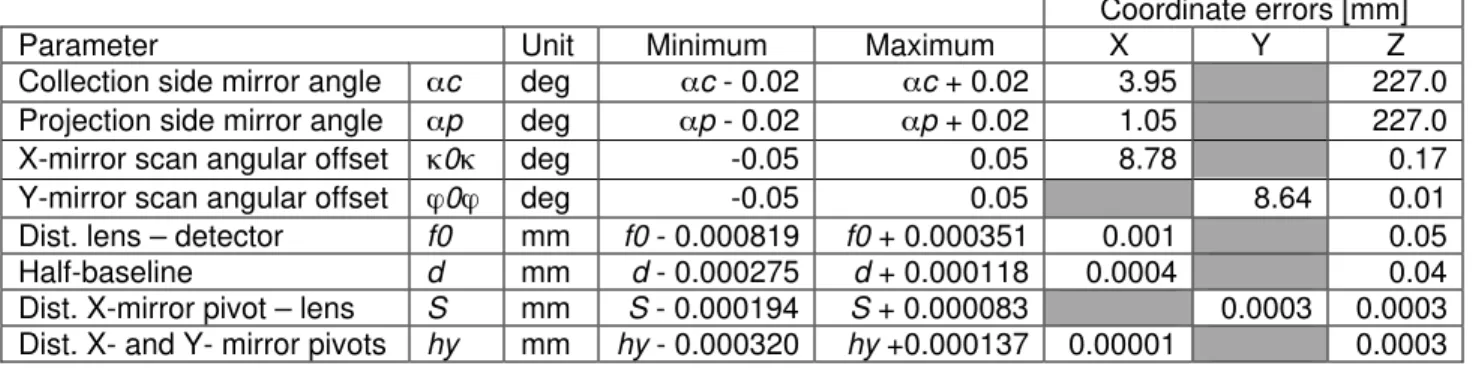
The sensitivity analysis showed that, in general, angular parameters have a greater impact on accuracy than dimensional parameters. Table 1 lists the coordinate errors associated with angular parameters c, p, 0 and 0 , and dimensional parameters f0, d, S and hy. All these parameters are defined in Figure 1. The corresponding coordinate errors have been reduced by careful mechanical design, as detailed in the following sections.
3. Mirror Angles
In theory, the projection and collection side mirror angles should be equal ( p= c= ) but, in practice, a small misalignment can occur. As shown in Table 1, the corresponding coordinate errors are large, especially for Z-coordinates. The collection side mirror angle causes the largest X-coordinate error because it affects both the slope of the collected ray and the location of the contact point on the mirror. The projection side mirror angle only affects the slope of the projected ray. To reduce errors, the side mirror
mounts have been designed to a tolerance of ±0.02°. This tight tolerance could be achieved via mechanical design and maintaining accuracy of fabricated parts.
The scanning angular offset, κ0κ for the X-mirror and ϕ0ϕ for the Y-mirror, is the angular difference between the actual rest position of the mirror and its ideal stationary position. Since these mirrors are moving, the tightest tolerance that could be achieved is ±0.05°. To meet this goal, a secondary bearing support was added to the Y-mirror to compensate for its size and weight.
4. Baseplate Material
The baseplate is certainly the most critical element of the opto-mechanical design, supporting all the different optical elements. Its rigidity, to maintain proper alignment, and thermal stability were extremely important parameters to investigate.
Two materials were under consideration for the optical baseplate: composite M55J/CE3 (M55J: graphite fiber, CE3: cyanate) and aluminium 6061-T6. Both materials are thermally isotropic in the X- and Y-directions. The coefficients of thermal expansion (CTE) of the composite and the aluminium are –2.39 E-07 K-1 and +2.34 E-05 K-1, respectively. A positive/negative CTE corresponds to expansion/ contraction with increasing temperature. Thermal modeling predicted that, during steady-state space operations, the LCS would be subjected to temperatures ranging from +7 to +51°C. At these temperature extremes, the sensitivity analysis showed that the difference of two orders of magnitude in CTE between the two materials directly translated into a difference of two orders of magnitude in coordinate errors. Based on these results, the composite was selected for the LCS. Table 1 shows the variations in dimensional parameters f0, d, S and hy for the composite between +7 to +51°C and the corresponding errors, which are overall very small.
5. Concluding Remarks
The error analysis reported in this paper shows the importance of doing a proper sensitivity analysis between an ideal design and the mechanical tolerances of its real-world implementation. The sensitivity analysis was performed to assist in the design process by identifying critical issues. It should be noted that the errors have been reduced further by calibration.
References
1. C. Samson, A. Deslauriers, C. English, G. Pepper, I. Christie, and F. Blais. “Imaging and Tracking Elements of the International Space Station using a 3D Autosynchronized Laser Scanner,” Proceedings of SPIE’s 16th Annual International Symposium on Aerospace/Defense Sensing, Simulations, and Controls, 2002.
2. J.-A. Beraldin, S.F. El-Hakim, and L. Cournoyer. “Practical Range Camera Calibration,” Videometrics II, Vol. 2067, pp. 21-31, 1993.
Table 1. Coordinate errors for a target point located 5 m away, directly in front of the LCS
Coordinate errors [mm]
Parameter Unit Minimum Maximum X Y Z
Collection side mirror angle c deg c - 0.02 c + 0.02 3.95 227.0
Projection side mirror angle p deg p - 0.02 p + 0.02 1.05 227.0
X-mirror scan angular offset 0 deg -0.05 0.05 8.78 0.17
Y-mirror scan angular offset 0 deg -0.05 0.05 8.64 0.01
Dist. lens – detector f0 mm f0 - 0.000819 f0 + 0.000351 0.001 0.05
Half-baseline d mm d - 0.000275 d + 0.000118 0.0004 0.04
Dist. X-mirror pivot – lens S mm S - 0.000194 S + 0.000083 0.0003 0.0003
Figure 1. Top views of the LCS baseplate and its various components. The projection and collection paths are shown in solid and dotted lines, respectively. The parameters studied during the sensitivity analysis are: c: collection side mirror angle; p: projection side mirror angle; f0: distance between the collecting lens and the detector; d: half-baseline; S: distance between the X-mirror pivot and the collecting lens; hy: distance between the X-and Y-mirror pivots.
Detector Collecting Lens Projection Side Mirror Collection Side Mirror Y-Mirror X-Mirror Collimator X Y Z εx αp hy S f0 Y X d αc Target Point