O R I G I N A L R E S E A R C H
Open Access
Dual time point [
18
F]FLT-PET for
differentiating proliferating tissues vs
non-proliferating tissues
Pierre Lovinfosse
1, Caroline Rousseau
2, Jean-Yves Pierga
3, Francis Bouchet
1, Alexandre Cochet
4,
Jean-Louis Alberini
5, Sylvie Girault
6, Pierre Vera
7, Pierre Olivier
8, Lionel Uwer
9, Florent Cachin
10, Benoit Scarwell
11,
Jérome Lemonnier
12, Emmanuelle Fourme
5, Christel Mesleard
12, Anne-Laure Martin
12, Franck Lac
œuille
1and
Olivier-François Couturier
1*Abstract
Purpose: For differentiating tumor from inflammation and normal tissues, fluorodeoxyglucose ([18F]FDG) dual time point PET could be helpful. Albeit [18F]FLT is more specific for tumors than [18F]FDG; we explored the role of dual time point [18F]FLT-PET for discriminating benign from malignant tissues.
Methods: Before any treatment, 85 womens with de novo unifocal breast cancer underwent three PET acquisitions at 33.94 ± 8.01 min (PET30), 61.45 ± 8.30 min (PET60), and 81.06 ± 12.12 min (PET80) after [18F]FLT injection. Semiquantitative analyses of [18F]FLT uptake (SUV) were carried out on tumors, liver, bone marrow (4th thoracic vertebra (T4) and humeral head), descending thoracic aorta, muscle (deltoid), and contralateral normal breast. Repeated measures ANOVA tests and Tukey’s posttests were used to compare SUVmax of each site at the three time points.
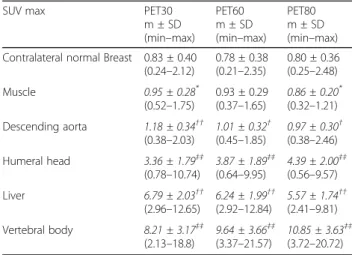
Results: There was a significant increase in SUVmax over time for breast lesions (5.58 ± 3.80; 5.97 ± 4.56; 6.19 ± 4.42; p < 0.0001) (m ± SD for PET30, PET60, and PET80, respectively), and bone marrow (for T4, 8.21 ± 3.17, 9.64 ± 3.66, 10.85 ± 3.63, p < 0.0001; for humeral head, 3.36 ± 1.79, 3.87 ± 1.89, 4.39 ± 2.00, p < 0.0001). A significant decrease in SUVmax over time was observed for liver (6.79 ± 2.03; 6.24 ± 1.99; 5.57 ± 1.74; p < 0.0001), muscle (0.95 ± 0.28; 0.93 ± 0.29; 0.86 ± 0.20; p < 0.027), and aorta (1.18 ± 0.34; 1.01 ± 0.32; 0.97 ± 0.30; p < 0.0001). No significant difference was observed for SUVmax in contralateral breast (0.8364 ± 0.40; 0.78 ± 0.38; 0.80 ± 0.35).
Conclusion: [18F]FLT-SUVmax increased between 30 and 80 min only in proliferating tissues. This could be helpful for discriminating between residual tumor and scar tissue.
Keywords: Fluorothymidine, FLT, Positron emission tomography, Breast cancer Introduction
Despite a lack of specificity for tumor, [18F]FDG remains the main tracer for positron emission tomography (PET). This success is explained by its high sensitivity and its capability to stage a wide variety of tumors. It has been shown that tis-sues with high levels of glycolysis will continue to accumu-late over time [18F]FDG as [18F]FDG-6-phosphate [1,2]. For differentiating malignant lesions from inflammation and
normal tissues, a dual time point imaging protocol has therefore been proposed, since tumor [18F]FDG uptake may increase over time but remain unchanged or decreased in normal or inflammatory tissues. Another approach is to de-velop new PET tracers offering improved specificity for tumor such as proliferation marker, uncontrolled tumor proliferation being one of the fundamental characteristics of cancer [3].
[18F]Fluorothymidine ([18F]FLT) is the leader of fluori-nated thymidine PET tracer, which tumor uptake is dir-ectly related to the thymidine kinase 1 (TK1) activity.
[18F]FLT tumor uptake reflects tumor proliferation in
© The Author(s). 2019 Open Access This article is distributed under the terms of the Creative Commons Attribution 4.0 International License (http://creativecommons.org/licenses/by/4.0/), which permits unrestricted use, distribution, and reproduction in any medium, provided you give appropriate credit to the original author(s) and the source, provide a link to the Creative Commons license, and indicate if changes were made.
* Correspondence:[email protected]
1Nuclear Medicine Department and Inserm UMR_S 1066 MINT, University of
Angers, Angers, France
most human cancers [3, 4] and is assumed to be more specific than [18F]FDG but less sensitive, related to high [18F]FLT activity in bone marrow and liver, limiting the detection of lesions in these common sites of metastases. In human breast cancer, high levels of TK1 activity has been observed [5], many fold higher than those of normal mammary tissues in particular in rapidly proliferating tis-sues such as breast adenocarcinoma [6–8]. 5' nucleotidase competes with TK1 and is responsible for the dephos-phorylation of [18F]FLT monophosphate, but its activity is too low to balance phosphorylation of [18F]FLT. [18F]FLT undergoes two other phosphorylations but is slightly in-corporated into DNA due to the stability conferred by the 18F-fluorination [9]. The consequence of these metabolic phenomena is an intracellular accumulation of [18F]FLT, comparable to that observed with [18F]FDG [10], and it can be hypothesized that [18F]FLT accumulates over time in tumors as seen with [18F]FDG.
There is no standardized protocol for performing
[18F]FLT-PET scans, namely, no standardization for the
uptake period. Kenny et al in a small cohort of 15 breast cancer patients reported that the values of semiquantita-tive parameters evaluating [18F]FLT uptake were similar when monitored early (21 min) or late (90 min) post-[18F]FLT injection [11]. Likewise, using a 45-min dynamic sequence immediately after intravenously administration of [18F]FLT, Pio et al. showed that tumor uptake from the 5- to 10-min first frames was able to predict longer-term clinical outcome [12]. Recently, Zhang et al. reported that e 16-min dynamic PET acquisition appears to be sufficient to provide accurate [18F]FLT kinetics to quantitatively as-sess the proliferation in breast cancer lesions [13]. Despite the lack of consensus, most studies use the same settings than those of [18F]FDG procedures, i.e., a period of 60 ± 10 min of uptake before scanning [7, 11, 14–24]. In the present study, using a multiple-point acquisition protocol,
we aimed to study the behavior of [18F]FLT uptake over
time in different tissues in women with a de novo locally advanced breast cancer prior the beginning of neoadjuvant anthracycline-based chemotherapy.
Material and methods Patients
Between February 2007 and March 2012, 122 women were included in this multicentre FLT01 study (NCT 00534274,
13 centers, France). Inclusion criteria were non-operable unifocal T2 or T3 breast tumor, M0 whatever N, histologi-cally proven (all types except lobular invasive grade I), not overexpressing c-erbB2 thus eligible for a neoadjuvant anthracycline-based chemotherapy. Noninclusion criteria were multifocal and/or bilateral breast tumor, metastatic in-vasion except lymph node involvement, inflammatory breast tumors, patient already included in another trial with experi-mental therapeutic molecule, pregnancy, woman deprived of liberty or under guardianship, inability to submit follow-up medical testing.
Eighty-five women (age : 49.39 ± 10.30 years (m ± DS); bodyweight: 67.49 ± 13.56 and BMI : 25.47 ± 4.58) had a complete three-point acquisition protocol at baseline [18F]FLT-PET, i.e., before the beginning of the neoadju-vant chemotherapy.
This study was approved by the ethics committee of the University Hospital of Angers, and all patients signed their informed consent before enrollment.
Histology
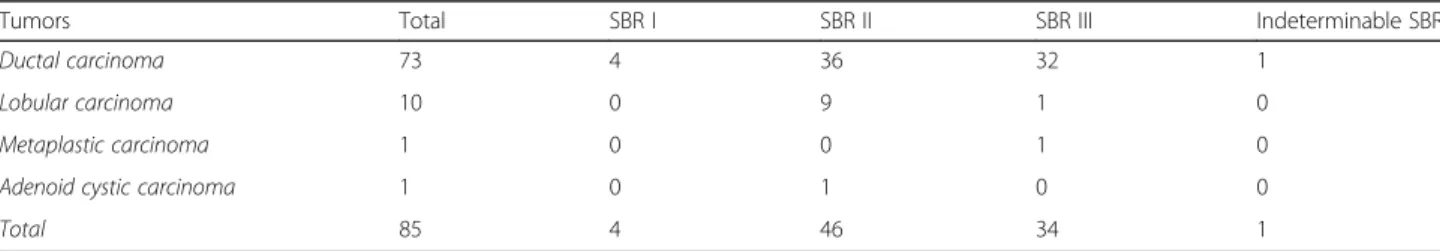
Three 14 G (or 16 G) micro-biopsies, one of which was frozen, were performed under ultrasound control for each tumor, with histological and histopronotic grade deter-mination according to modified Scarff-Bloom-Richardson. Histological analysis of these 85 tumors revealed 73 ductal carcinomas, 10 lobular carcinomas, 1 metaplastic carcin-oma, and 1 adenoid cystic carcincarcin-oma, among which 4 SBR I, 46 SBR II, 34 SBR III, and 1 indeterminable SBR grade (Table1).
Study design
Before inclusion, a conventional staging was performed in all patients, i.e., clinical examination, bilateral mam-mogram, breast ultrasound, and echo-guided biopsy for histological analysis. The patients were included if they met all inclusion criteria without any noninclusion
cri-teria. The [18F]FLT-PET examination was performed
away from the biopsy (at least 10 days) but as soon as possible thereafter, not to delay the onset of the neoad-juvant chemotherapy.
Combined [18F]FLT-PET/CT studies
The same acquisition [18F]FLT-PET procedure was
followed by all the 13 centers. Table 1 Tumor characteristics
Tumors Total SBR I SBR II SBR III Indeterminable SBR
Ductal carcinoma 73 4 36 32 1
Lobular carcinoma 10 0 9 1 0
Metaplastic carcinoma 1 0 0 1 0
Adenoid cystic carcinoma 1 0 1 0 0
Patients were not fasting but well oral hydrated. A ven-ous catheter with an infusion of 500 mL of saline serum was placed in a peripheral vein (in the contralateral arm to the breast tumor). According to the type of [18F]FDG-PET
scanner used, a [18F]FLT dose of about 3 MBq/kg (3D
mode) or about 5 MBq/kg (2D mode) body weight was injected (mean ± SD, 4.54 ± 0.81 MBq/kg; min–max, 2.85–6.41 MBq). The mean ± SD-injected dose was 305.53 ± 77.68 MBq (min–max: 137–495 MBq).
After an uptake phase of 20 min, the patient was set in prone position in the PET machine, and the first PET acquisitions (PET30) focused on breasts and axillae which started immediately (uptake times; m ± SD: 33.94 ± 8.01 min.). For all series of PET/CT images, a low-dose CT scans were acquired first (120 to 140 keV; 80 to 100 mAs, depending on the routine procedure of each center), followed by PET scans with an acquisition time of 5 min per bed position. At the end of PET30 acquisi-tions, the patient remained in the PET system until the start of the second PET (PET60) acquisitions focused on breasts and axillae with exactly the same settings (uptake time; m ± SD: 61.45 ± 8.30 min.). Thereafter, the patient was set in supine position for the whole body PET scan (PET80) (pelvis to base of the skull, uptake phase (up-take times; m ± SD: 81.06 ± 12.12 min)).
The CT data were used for attenuation correction, and
[18F]FLT-PET images were reconstructed by using a
standard iterative algorithm depending on each type of PET machine (ordered subset expectation maximization or row-action maximalization-likelihood iterative algo-rithm). A centralized reading was performed with a dedi-cated software providing multiplanar reformatted images of non-attenuated PET, attenuated PET, CT, and fused
data with linked cursors (IMAGYS® Workstation, 2010–
Kéosys, St Herblain, France).
[18F]FLT-PET data analysis
Semiquantitative analysis of [18F]FLT uptake has been
carried out using standardized uptake values (SUV) nor-malized by body weight.
Differents types of SUVs were computed for breast tu-mors: maximum SUV (SUVmax; maximum pixel value), mean SUV (SUV41; computed on a 3D isocontour at 41% of the maximum pixel value), and peak-equivalent
SUVs (SUVpeak computed on a 3D ROI of 1 cm3
con-taining the maximum pixel value but not necessarily centered by the maximum pixel value).
For normal tissues, SUVmax and SUVmean were calcu-lated on the liver (3D ROI of 3 cm diameter drawn on the right liver area following PERCIST recommendations [25]) and on a 3D ROI of 1 cm diameter for the others tissues, i.e., contralateral breast, descending aorta, muscle (deltoid), and bone marrow (humeral head and T4 vertebral body).
Statistical analysis
Comparisons of [18F]FLT SUV in normal tissues and
tu-mors, i.e., between PET30, PET60, and PET80 data were carried out by using variance analysis tests (repeated measures one-way ANOVA). These analyses were done for each type of SUV and SUV ratio. Tukey’s multiple comparison posttests were used for identifying the sig-nificant differences between two sets of data.
About 0.05 was set at the level of statistical significance. All statistical tests were performed with Prism® 4 for Macintosh, version 6.0 h, 2015, Graphpad® software Inc., La Jolla, CA 92037 USA)
Results
SUVmax was chosen as the parameter of reference for describing the results of the present study. Endeed, SUVmax is the most documented semiquantitavive PET parameter in the literature, and furtheremore in this study, SUVpeak and SUVmean values followed most often the same profiles as SUV max values (in case of different behaviors between the different type of SUV, these differences have been reported).
Tumor characteristics
Histological analysis of these 85 tumors revealed 73 ductal carcinomas, 10 lobular carcinomas, 1 metaplastic carcinoma, and 1 adenoid cystic carcinoma, among which four SBR I, 46 SBR II, 34 SBR III, and 1
indeter-minable SBR grade (Table1).
Biodistribution of [18F]FLT in normal tissues
Whatever the type of SUV, at all acquisition times (i.e., PET30, PET60, and PET80), vertebral bone marrow was
the tissue with the most important [18F]FLT uptake,
followed by respectively liver and humeral head [18F]FLT
uptakes (SUVmax values are summarized in Table2). In
contrast, normal breast tissues (contralateral to the pri-mary breast tumor), thoracic aorta, and muscle showed the weakest [18F]FLT uptake.
Normal breast tissues [18F]FLT uptake did not
sig-nificantly vary over time, and only a weak decrease
in [18F]FLT uptake between PET30 and PET80 was
observed for muscle. Probably due to the elimination
and metabolism of [18F]FLT, a significant decrease in
[18F]FLT uptake was observed between all acquisition times
in aorta (repeated measures ANOVA p < 0.0001) and in
liver (p < 0.0001). In three cases (3, 5%), an intense activity was observed in the gall bladder, and in one of these three patients, the main bile duct was also visualized. After glu-curonidation of [18F]FLT in the liver, the metabolites are excreted in urine which explains a bladder activity in all pa-tients. In 17 patients (20%), a thymic uptake was observed.
The bone marrow of the 4th dorsal (D4) vertebral body was the normal tissue displaying the most important
[18F]FLT uptake and increase (p < 0.0001) in tracer uptake over time. The most important variation in D4 uptake was seen between PET30 and PET80 (SUVmax average in-crease of 2.64 (+ 32%) ± 1.45). The humeral head [18F]FLT uptake followed the same variations with a sig-nificant increase over time (the most important SUVmax average increase was observed between PET30 and PET80 with a value of 2.64 (+ 31%) ± 1.45).
Tumor uptake of [18f]FLT
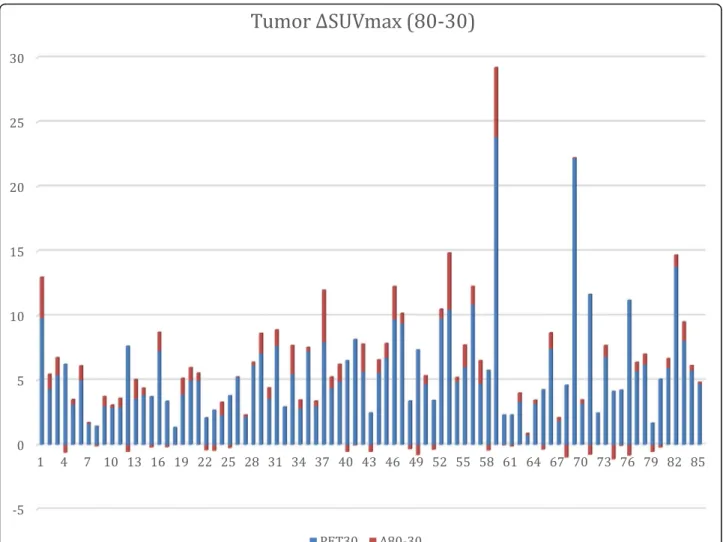
Table 3 and Fig. 1 summarize the tumor uptake values.
Breast tumor [18F]FLT uptake increased significantly
over time (repeated measures ANOVAp < 0.0001). The
most important increase was observed between PET30 and PET80 (SUVmax average increase of 0.61 (+ 11%) ± 1.13).
All the 85 primitive breast tumors were clearly visual-ized at all acquisition times. The ratios between tumor
[18F]FLT uptake and normal tissues (contralateral
nor-mal breast, aorta, liver, and muscle) were measured for each acquisition time (Table 4). The highest ratios were observed between tumor and normal breast tissues for
PET60 whereas tumor to liver ratios were the smallest whatever the acquisition time. All these ratios increased significantly over time between PET30 and PET60 and
PET30 and PET80 (repeated measures ANOVA p <
0.0001). The most important increase over time was ob-served for tumor to muscle ratios between P30 and P80 (SUVmax average increase of 3.04 (+ 57%) ± 2.90).
Discussion
The concept of dual time point (DTP) has been the
sub-ject of numerous publications with [18F]FDG in various
cancer types. It has been shown that tissues with high levels of glycolysis will continue to accumulate [18F]FDG
as [18F]FDG-6-phosphate, whereas tissues with high
glucose-6-phosphatase activity (such as liver) will peak early, followed by a decrease in [18F]FDG retention [1,2]. Studies on the DTP concept were conducted to define the optimal time needed between tracer injection and image acquisitions to distinguish between benign and malignant lesions.
The first study was conducted in head and neck tumor patients in 1999 by Hustinx R. et al. [26] and showed an
increase in [18F]FDG tumor uptake between two
acquisi-tions performed with 28 min of mean interval (70 and 98 min). The use of DTP in lung lesions showed con-flicting results, but overall it seems that DTP increases the sensitivity in detecting the malignancy of lesions while the specificity remains stable or even decreases [27–33]. One of the main problems pointed out in the-ses studies is the lack of consensus to define a threshold of [18F]FDG uptake for malignancy.
In 1999, Boerner et al. demonstrated the superiority of a 180-min image acquisition in the detection of breast cancers and metastatic lymph node lesions compared to 40-min and 90-min acquisitions. In 2005, Kumar et al. reported a significant increase in SUV between the two acquisitions of DTP (ΔSUV) for breast cancer lesions [34]. The effectiveness ofΔSUV was reported for the de-tection of small cancers located in dense breasts (120) and for the determination of malignancy in breast le-sions with a low initial uptake (SUVmax≤ 2.5) [35–37]. However, for the detection of metastatic axillary lymph nodes, DTP may not increase the overall performance of [18F]FDG-PET, due in particular to false positives at the late time [38,39].
The main problem of DTP studies is the lack of meth-odological homogeneity, leading to conflicting results [2]. Several factors could be identified: (1) different delays of late acquisitions, with sometimes an overlap between early and late acquisitions coming from different studies (major source of conflicting results); (2) different gold standards or criteria for the determination of malignancy (SUVmax threshold, retention index); (3) different study designs (pre-or post-therapeutic evaluation, patient population size and Table 2 SUVmax of different normal target tissues over time
SUV max PET30
m ± SD (min–max) PET60 m ± SD (min–max) PET80 m ± SD (min–max) Contralateral normal Breast 0.83 ± 0.40
(0.24–2.12) 0.78 ± 0.38 (0.21–2.35) 0.80 ± 0.36 (0.25–2.48) Muscle 0.95 ± 0.28* (0.52–1.75) 0.93 ± 0.29 (0.37–1.65) 0.86 ± 0.20* (0.32–1.21) Descending aorta 1.18 ± 0.34†† (0.38–2.03) 1.01 ± 0.32 † (0.45–1.85) 0.97 ± 0.30 † (0.38–2.46) Humeral head 3.36 ± 1.79‡‡ (0.78–10.74) 3.87 ± 1.89‡‡ (0.64–9.95) 4.39 ± 2.00‡‡ (0.56–9.57) Liver 6.79 ± 2.03†† (2.96–12.65) 6.24 ± 1.99 †† (2.92–12.84) 5.57 ± 1.74 †† (2.41–9.81) Vertebral body 8.21 ± 3.17‡‡ (2.13–18.8) 9.64 ± 3.66‡‡ (3.37–21.57) 10.85 ± 3.63‡‡ (3.72–20.72) *significant decrease;p < 0.05 †significant decrease; p < 0.0001 ‡significant increase; p < 0.0001
Table 3 Primary breast tumor SUV over time
Breast Tumor PET30 m ± SD (min–max) PET60 m ± SD (min–max) PET80 m ± SD (min–max) SUVmax 5.58 ± 3.80†‡ (0.73–23.84) 5.97 ± 4.56 †* (0.75–29.28) 6.19 ± 4.42 ‡* (0.88–29.22) SUVpeak 4.27 ± 2.63†‡ (0.66–16.59) 4.49 ± 3.10†* (0.63–19.63) 4.66 ± 3.10‡* (0.71–18.61) SUVmean41% 3.38 ± 2.27*‡ (0.58–14.35) 3.55 ± 2.66 ** (0.53–17.32) 3.78 ± 2.70 *‡ (0.54–16.86) *significant increase;p < 0.05 †significant increase; p < 0.001 ‡significant increase; p < 0.0001
characteristics, various cancer types, etc.). However, studies agree on the following points: (1) background noise gener-ally decreases on late images leading to a better image qual-ity; (2) uptake increases on late images for the majority of [18F]FDG-avid tumors; (3) better diagnostic performance
compared to a single acquisition in most studies, i.e., a bet-ter sensitivity of lesion detection thanks to a betbet-ter lesion/ background ratio with a gain of specificity; (4) SUVmax that is dependent of multiple factors should not be used as the sole criterion but also retention index or a combination of
Fig. 1 Primary breast tumor SUVmax differences between PET80 and PET30 (ΔSUVmax). ΔSUVmax is plotted vs PET30 SUVmax. Note that 24 patients showed a decrease in FLT uptake, even though these decreases are marginal or of low amplitude. However, 50% of the patients correspond to an increase in FLT uptake between 30 and 60 min (79% are ductal carcinoma, and 58% are SBR II)
Table 4 Primary breast tumor to background SUVmax ratio
SUV max ratio PET30
m ± SD (min–max) PET60 m ± SD (min–max) PET80 m ± SD (min–max) Primitive Tumor to contralateral Breast 7.94 ± 5.83†‡
(1.16–32.66) 9.05 ± 6.72
†
(1.38–40.11) 9.00 ± 6.24
‡
(1.5–33.98) Primitive Tumor to descending Aorta 4.88 ± 2.75‡‡
(0.62–16.22) 6.10 ± 4.04
‡
(0.86–25.46) 6.66 ± 4.74
‡
(0.88–34.79) Primitive Tumor to Liver 0.84 ± 0.46‡‡
(0.13–2.40) 0.98 ± 0.59
‡‡
(0.10–2.97) 1.18 ± 0.75
‡‡
(0.12–3.56) Primitive Tumor to Muscle 5.29 ± 3.09‡‡
(0.75–21.10) 6.71 ± 4.56‡‡ (0.81–32.53) 8.33 ± 5.15‡‡ (1.28–31.09) †significant increase; p ≤ 0.001 ‡significant increase; p ≤ 0.0001
SUV and retention index. Finally, the main limitation of performing DTP examinations is the difficulty of integrat-ing this technique for all patients into a daily schedule of Nuclear Medicine services.
In our study, bone marrow and liver displayed the highest [18F]FLT uptake in all patients. The intense bone marrow uptake is related to its important proliferative
activity and to the absence of [18F]FLT catabolism by
thymidine phosphorylase, due to the 18F labeling at the 3' position of the thymidine which confers the stability to the molecule [40–42]. The intense liver activity is re-lated to the hepatic glucuronidation of the molecule, ob-served only in primates and humans, who have an enterohepatic cycle. [18F]FLT metabolites are excreted in the bile (in our study, three patients had intense gall-bladder activity) and reabsorbed by the small intestine, before its urine elimination [4,41]. By contrast, control-lateral breast and muscle tissues displayed the lowest FLT uptake due to their low cell proliferation.
All breast tumors were well individualized at all the three examination times, due to the high cancer uptake and/or the low uptake of surrounding tissues,
confirm-ing the results of previous studies with [18F]FLT in
breast cancer patients [7,12,14,43]. The highest uptake ratios were observed between breast tumor and normal breast tissues for PET60. We found also a significant
in-crease over time in breast cancer [18F]FLT uptake. The
most important increase over time was observed for tumor to muscle ratios between P30 and P80 (SUVmax average increase of 3.04 (+ 57%) ± 2.90). To our know-ledge, there is currently no publication specifically
dedi-cated to [18F]FLT DTP in the evaluation of cancers. As
for [18F]FDG, there is a cellular trapping of [18F]FLT by proliferative cells that overexpress“es” transporters allow-ing [18F]FLT entry into the cell [44] and with a high TK1 activity that phosphorylates [18F]FLT [9, 44–47]. This process competes with 5'-nucleotidase dephosphorylation, which is largely minority compared to TK1 activity [10],
and phosphorylated [18F]FLT is not incorporated into
DNA [9, 48–50], both explaining intracellular [18F]FLT accumulation over time. In comparison, the different “non-proliferating” tissues (aorta, muscle, normal breast, and liver), with a low level of cells at the end of the G1 and S phase, do not overexpress“es” transporters [51] or do not exhibit TK1 activity and therefore present a de-crease in [18F]FLT uptake over time. This explains also the significant increase in tumor to not tumor ratios and a better tumor contrast over time.
Although [18F]FLT is assumed to be more specific for
tumor than [18F]FDG, the increase in [18F]FLT tumor
uptake over time could play an important role in asses-sing the neoplastic character of equivocal breast lesion and internal lymph node lesions. In addition, while in-tense activity in the hepatic parenchyma decreases
significantly over time, the increase in tumoral uptake over time may allow the detection of metastatic liver le-sions, using preferably an interval of approximately 1 h between the early and late acquisitions, this interval showing the most significant differences in our study.
Conclusion
[18F]FLT uptake of neoplastic and non-neoplastic prolifer-ating tissues increases significantly when the time between tracer injection and image acquisition increases, while this increase is not observed for“non-proliferating” tissues. This observation may be useful for distinguishing between tumor residues and scar tissues, particularly when [18F]FLT uptake becomes weak after treatment. In addition, changes in [18F]FLT uptake over time underscore the importance of a rigorous methodology when patients are imaged many times, for instance, when evaluating response to therapy. To improve the assessment of tumor proliferation, dynamic [18F]FLT studies have already been used, but the dual time point may allow the whole or partial body assessment in-stead of just a single dynamic volume.
Acknowledgements
This study was supported by ABX-CRO, UNICANCER, and the Ligue Nationale Contre le Cancer (LNCC). The authors are grateful for their help.
The authors acknowledge patients for their involvement.
Authors’ contributions
OC conceived of the study, participated in its design and coordination, and drafted the manuscript. PL was involved in the reading and analyse of PET data and the redaction of the manuscript. FB was involved in the quality control of PET systems and analyse of PET data. CR, JYP, AC, JLA, SG, PV, PO, LU, FC, and BS were involved of the inclusions of patients and data collection. OC and EF performed the statistical analysis. FL was the radiopharmacist responsible for FLT logistic and quality control. JL, CM, and ALM were involved in the coordination of the study and data collection. All authors read and approved the final manuscript.
Funding
This study was supported by a grant from the French Ministry of Health (PHRC 2005). The La Ligue Nationale Contre le Cancer provided financial support for this study but had no role in study design, data collection, data analysis, data interpretation, or writing of the report.
Availability of data and materials
The datasets generated during and/or analysed during the current study are available from the Sponsor UNICANCER on reasonable request. The French Breast Cancer Intergroup (UCBG) scientific board must study and validate all proposals that will require access to data.
Ethics approval and consent to participate
Patients provided written informed consent before enrollment. The protocol was approved by the French national ethics committee (CCPPRB Angers ; N°2006/11) on 31 August 2006, and the study was conducted according to the Declaration of Helsinki and European Good Clinical Practice
requirements.
Consent for publication Not Applicable
Competing interests
Author details
1Nuclear Medicine Department and Inserm UMR_S 1066 MINT, University of
Angers, Angers, France.2Nuclear Medicine Department, West Cancer Institut
(ICO), René Gauducheau Centre, Saint Herblain, France.3Nuclear Medicine Department, Curie Institut, Paris, France.4Nuclear Medicine Department,
Georges-François Leclerc Centre, Dijon, France.5Nuclear Medicine
Department, Curie Institut, Saint-Cloud, France.6Nuclear Medicine
Department, West Cancer Institut (ICO), Paul Papin Centre, Angers, France.
7Nuclear Medicine Department, Henri Becquerel Centre, Rouen, France. 8Nuclear Medicine Department, University of Nancy, Nancy, France.9Nuclear
Medicine Department, Institut de cancerologie de lorraine, Vandoeuvre-les-, Nancy, France.10Nuclear Medicine Department, Jean Perrin Center, Clermont Ferrand, France.11Nuclear Medicine Department, Centre Hospitalier de la
Cote Basque, Bayonne, France.12UniCancer R&D, Paris, France.
Received: 19 July 2019 Accepted: 26 November 2019
References
1. Gallagher BM, Ansari A, Atkins H, Casella V, Christman DR, Fowler JS, et al. Radiopharmaceuticals XXVII. 18F-labeled 2-deoxy-2-fluoro-d-glucose as a radiopharmaceutical for measuring regional myocardial glucose metabolism in vivo: tissue distribution and imaging studies in animals. J Nucl Med. 1977; 18:990–6.
2. Cheng G, Torigian DA, Zhuang H, Alavi A. When should we recommend use of dual time-point and delayed time-point imaging techniques in FDG PET. Eur J Nucl Med Mol Imaging. 2013;40:779–87.
3. Couturier OO, Luxen AA, Chatal J-FJ, Vuillez J-PJ, Rigo PP, Hustinx RR. Fluorinated tracers for imaging cancer with positron emission tomography. Eur J Nucl Med Mol Imaging. 2004;31:1182–206.
4. Salskov A, Tammisetti VS, Grierson J, Vesselle H. FLT: Measuring tumor cell proliferation in vivo with positron emission tomography and 3 ′-deoxy-3′-[18F]fluorothymidine. Semin Nucl Med. 2007;37:429–39.
5. Romain S, Martin P-M, Klijn JGM, van Putten WLJ, Look MP, Guirou O, et al. DNA-synthesis enzyme activity: a biological tool useful for predicting anti-metabolic drug sensitivity in breast cancer? International Journal of Cancer. Wiley-Blackwell. 1997;74:156–61.
6. Sakamoto S, Kuwa K, Tsukada K, Sagara T, Noriyuki K, Okamoto R. Relative activities of thymidylate synthetase and thymidine kinase in 1,2-dimethyihydrazine-induced colon carcinomas in rats. Carcinogenesis. 1987;8:405–8.
7. Smyczek-Gargya B, Fersis N, Dittmann H, Vogel U, Reischl G, Machulla H-J, et al. PET with [18F]fluorothymidine for imaging of primary breast cancer: a pilot study. Eur J Nucl Med Mol Imaging. 2004;31:720–4.
8. Buck AK, Schirrmeister H, Mattfeldt T, Reske SN. Biological characterisation of breast cancer by means of PET. Springer-Verlag. 2004;31:S80–7.
9. Seitz U, Wagner M, Neumaier B, Wawra E, Glatting G, Leder G, et al. Evaluation of pyrimidine metabolising enzymes and in vitro uptake of 3 “-[18F]fluoro-3-”deoxythymidine ([18F]FLT) in pancreatic cancer cell lines. Eur J Nucl Med Mol Imaging. 2002;29:1174–81.
10. Grierson JR, Schwartz JL, Muzi M, Jordan R, Krohn KA. Metabolism of 3 ′-deoxy-3′-[F-18]fluorothymidine in proliferating A549 cells: Validations for positron emission tomography. Nucl. Med. Biol. 2004;31:829–37.
11. Kenny LM, Vigushin DM, Al-Nahhas A, Osman S, Luthra SK, Shousha S, et al. Quantification of cellular proliferation in tumor and normal tissues of patients with breast cancer by [ 18F]fluorothymidine-positron emission tomography imaging: evaluation of analytical methods. Cancer Res. 2005;65: 10104–12.
12. Pio BS, Park CK, Pietras R, Hsueh W-A, Satyamurthy N, Pegram MD, et al. Usefulness of 3“-[F-18]fluoro-3-”deoxythymidine with positron emission tomography in predicting breast cancer response to therapy. Mol Imaging Biol. 2006;8:36–42.
13. Zhang J, Liu X, Knopp MI, Ramaswamy B, Knopp MV. How Long of a Dynamic 3“-Deoxy-3-”[18F]fluorothymidine ([18F]FLT) PET acquisition is needed for robust kinetic analysis in breast cancer? Mol Imaging Biol. Springer International Publishing. 2019;21:382–90.
14. Kenny L, Coombes RC, Vigushin DM, Al-Nahhas A, Shousha S, Aboagye EO. Imaging early changes in proliferation at 1 week post
chemotherapy: a pilot study in breast cancer patients with 3 “-deoxy-3-”[18F]fluorothymidine positron emission tomography. Eur J Nucl Med Mol Imaging. 2007;34:1339–47.
15. Buck AK, Halter G, Schirrmeister H, Kotzerke J, Wurziger I, Glatting G, et al. Imaging proliferation in lung tumors with PET: 18F-FLT versus 18F-FDG. J Nucl Med. 2003;44:1426–31.
16. Buck AK, Schirrmeister H, Hetzel M, Heide Von Der M, Halter G, Glatting G, et al. 3-deoxy-3-[(18)F]fluorothymidine-positron emission tomography for noninvasive assessment of proliferation in pulmonary nodules. Cancer Res. 2002;62:3331–4.
17. Dittmann H, Dohmen BM, Paulsen F, Eichhorn K, Eschmann SM, Horger M, et al. [ 18 F]FLT PET for diagnosis and staging of thoracic tumours. Springer-Verlag. 2003;30:1407–12.
18. Buck AK, Bommer M, Stilgenbauer S, Juweid M, Glatting G, Schirrmeister H, et al. Molecular imaging of proliferation in malignant lymphoma. Cancer Res. 2006;66:11055–61.
19. Francis DL. In vivo imaging of cellular proliferation in colorectal cancer using positron emission tomography. Gut. 2003;52:1602–6.
20. Chen W, Cloughesy T, Kamdar N, Satyamurthy N, Bergsneider M, Liau L, et al. Imaging proliferation in brain tumors with 18F-FLT PET: comparison with 18F-FDG. J Nucl Med. 2005;46:945–52.
21. Choi SJ, Kim JS, Kim JH, Oh SJ, Lee JG, Kim CJ, et al. [18F]3 ′-deoxy-3′-fluorothymidine PET for the diagnosis and grading of brain tumors. Springer-Verlag. 2005;32:653–9.
22. Cobben DCP. Detection and grading of soft tissue sarcomas of the extremities with 18F-3“-fluoro-3-”deoxy-L-thymidine. Clin. Cancer Res. 2004; 10:1685–90.
23. van Westreenen HL, Cobben DCP, Jager PL, van Dullemen HM, Wesseling J, Elsinga PH, et al. Comparison of 18F-FLT PET and 18F-FDG PET in esophageal cancer. J Nucl Med. 2005;46:400–4.
24. Yap CS, Czernin J, Fishbein MC, Cameron RB, Schiepers C, Phelps ME, et al. Evaluation of thoracic tumors with fluorothymidine and 18F-fluorodeoxyglucose-positron emission tomography. Chest. 2006;129:393–401. 25. Wahl RL, Jacene H, Kasamon Y, Lodge MA. From RECIST to PERCIST:
Evolving Considerations for PET response criteria in solid tumors. J Nucl Med. 2009;50(Suppl 1):122S–50S.
26. Hustinx R, Smith RJ, Benard F, Rosenthal DI, Machtay M, Farber LA, et al. Dual time point fluorine-18 fluorodeoxyglucose positron emission tomography: a potential method to differentiate malignancy from inflammation and normal tissue in the head and neck. Eur J Nucl Med. 1999;26:1345–8.
27. Matthies A, Hickeson M, Cuchiara A, Alavi A. Dual time point 18F-FDG PET for the evaluation of pulmonary nodules. J Nucl Med. 2002;43:871–5. 28. Alkhawaldeh K, Bural G, Kumar R, Alavi A. Impact of dual-time-point
(18)F-FDG PET imaging and partial volume correction in the assessment of solitary pulmonary nodules. Eur J Nucl Med Mol Imaging. 2008;35:246–52. 29. Schillaci O, Travascio L, Bolacchi F, Calabria F, Bruni C, Cicciò C, et al.
Accuracy of early and delayed FDG PET-CT and of contrast-enhanced CT in the evaluation of lung nodules: a preliminary study on 30 patients. Radiol Med. 2009;114:890–906.
30. Macdonald K, Searle J, Lyburn I. The role of dual time point FDG PET imaging in the evaluation of solitary pulmonary nodules with an initial standard uptake value less than 2.5. Clin Radiol. 2011;66:244–50.
31. Chen C-J, Lee B-F, Yao W-J, Cheng L, Wu P-S, Chu CL, et al. Dual-phase 18F-FDG PET in the diagnosis of pulmonary nodules with an initial standard uptake value less than 2.5. AJR Am J Roentgenol. 2008;191:475–9. 32. Barger RL, Nandalur KR. Diagnostic performance of dual-time 18F-FDG PET
in the diagnosis of pulmonary nodules: a meta-analysis. Acad Radiol. 2012; 19:153–8.
33. Gould MK, Maclean CC, Kuschner WG, Rydzak CE, Owens DK. Accuracy of positron emission tomography for diagnosis of pulmonary nodules and mass lesions. JAMA. 2001;285:914.
34. Kumar R, Loving VA, Chauhan A, Zhuang H, Mitchell S, Alavi A. Potential of dual-time-point imaging to improve breast cancer diagnosis with (18)F-FDG PET. J Nucl Med. 2005;46:1819–24.
35. Imbriaco M, Caprio MG, Limite G, Pace L, De Falco T, Capuano E, et al. Dual-time-point 18F-FDG PET/CT versus dynamic breast MRI of suspicious breast lesions. AJR Am J Roentgenol. 2008;191:1323–30.
36. Caprio MG, Cangiano A, Imbriaco M, Soscia F, Di Martino G, Farina A, et al. Dual-time-point [18F]-FDG PET/CT in the diagnostic evaluation of suspicious breast lesions. Radiol Med. 2010;115:215–24.
37. Zytoon AA, Murakami K, El-Kholy MR, El-Shorbagy E, Ebied O. Breast cancer with low FDG uptake: characterization by means of dual-time point FDG-PET/CT. Eur J Radiol. 2009;70:530–8.
38. Hahn S, Hecktor J, Grabellus F, Hartung V, Pöppel T, Kimmig R, et al. Diagnostic accuracy of dual-time-point 18F-FDG PET/CT for the detection of axillary lymph node metastases in breast cancer patients. Acta Radiol. 2012; 53:518–23.
39. Choi WH, Yoo IR. O JH, Kim SH, Chung SK. The value of dual-time-point 18F-FDG PET/CT for identifying axillary lymph node metastasis in breast cancer patients. Br J Radiol. 2011;84:593–9.
40. Koolen BB, Pengel KE, Wesseling J, Vogel WV, Vrancken Peeters M-JTFD, Vincent AD, et al. FDG PET/CT during neoadjuvant chemotherapy may predict response in ER-positive/HER2-negative and triple negative, but not in HER2-positive breast cancer. Breast. 2013;22:691–7.
41. van Kruchten M, Glaudemans AWJM, de Vries EFJ, Beets-Tan RGH, Schröder CP, Dierckx RA, et al. PET imaging of estrogen receptors as a diagnostic tool for breast cancer patients presenting with a clinical dilemma. J Nucl Med. Society of Nuclear Medicine. 2012;53:182–90.
42. Shields AFA, Grierson JRJ, Dohmen BMB, Machulla HJH, Stayanoff JCJ, Lawhorn-Crews JMJ, et al. Imaging proliferation in vivo with [F-18]FLT and positron emission tomography. Nat Med. 1998;4:1334–6.
43. Been LB, Elsinga PH, de Vries J, Cobben DCP, Jager PL, Hoekstra HJ, et al. Positron emission tomography in patients with breast cancer using (18)F-3 “-deoxy-3-”fluoro-l-thymidine ((18)F-FLT)-a pilot study. Eur J Surg Oncol. 2006; 32:39–43.
44. Belt JA, Marina NM, Phelps DA, Crawford CR. Nucleoside transport in normal and neoplastic cells. Advances in Enzyme Regulation. 1993;33:235–52. 45. Brockenbrough JS, Souquet T, Morihara JK, Stern JE, Hawes SE, Rasey
JS, et al. Tumor 3“-deoxy-3-”(18)F-fluorothymidine ((18)F-FLT) uptake by PET correlates with thymidine kinase 1 expression: static and kinetic analysis of (18)F-FLT PET studies in lung tumors. J Nucl Med. 2011;52:1181–8.
46. Barthel H, Perumal M, Latigo J, He Q, Brady F, Luthra SK, et al. The uptake of 3“-deoxy-3-”[18F]fluorothymidine into L5178Y tumours in vivo is dependent on thymidine kinase 1 protein levels. Eur J Nucl Med Mol Imaging. 2005;32:257–63.
47. Buchmann I, Neumaier B, Schreckenberger M, Reske S. [18F]3 “-Deoxy-3-”fluorothymidine-PET in NHL patients: whole-body biodistribution and imaging of lymphoma manifestations—a pilot study. Cancer Biother. Radiopharm. Mary Ann Liebert, Inc. 2 Madison Avenue Larchmont, NY 10538 USA; 2004;19:436–42.
48. Toyohara J, Waki A, Takamatsu S, Yonekura Y, Magata Y, Fujibayashi Y. Basis of FLT as a cell proliferation marker: comparative uptake studies with [3H]thymidine and [3H]arabinothymidine, and cell-analysis in 22 asynchronously growing tumor cell lines. Nucl. Med. Biol. 2002;29:281–7. 49. Lu L, Samuelsson L, Bergstrom M, Sato K, Fasth K-J, Langstrom B. Rat studies
comparing 11C-FMAU, 18F-FLT, and 76Br-BFU as proliferation markers. J Nucl Med. 2002;43:1688–98.
50. Wagner M, Seitz U, Buck A, Neumaier B, Schultheiss S, Bangerter M, et al. 3 “-[18F]fluoro-3-”deoxythymidine ([18F]-FLT) as positron emission tomography tracer for imaging proliferation in a murine B-Cell lymphoma model and in the human disease. Cancer Res. 2003;63:2681–7.
51. Plagemann PGW, Richey DP, Zylka JM, Erbe J. Thymidine transport by Novikoff rat hepatoma cells synchronized by double hydroxyurea treatment. Experimental Cell Research. 1974;83:303–10.
Publisher’s Note
Springer Nature remains neutral with regard to jurisdictional claims in published maps and institutional affiliations.