Publisher’s version / Version de l'éditeur:
Vous avez des questions? Nous pouvons vous aider. Pour communiquer directement avec un auteur, consultez la première page de la revue dans laquelle son article a été publié afin de trouver ses coordonnées. Si vous n’arrivez pas à les repérer, communiquez avec nous à [email protected].
Questions? Contact the NRC Publications Archive team at
[email protected]. If you wish to email the authors directly, please see the first page of the publication for their contact information.
https://publications-cnrc.canada.ca/fra/droits
L’accès à ce site Web et l’utilisation de son contenu sont assujettis aux conditions présentées dans le site LISEZ CES CONDITIONS ATTENTIVEMENT AVANT D’UTILISER CE SITE WEB.
E3S Web of Conferences, 40, 2018-09-05
READ THESE TERMS AND CONDITIONS CAREFULLY BEFORE USING THIS WEBSITE. https://nrc-publications.canada.ca/eng/copyright
NRC Publications Archive Record / Notice des Archives des publications du CNRC :
https://nrc-publications.canada.ca/eng/view/object/?id=7729397c-e7c8-4252-a0c9-7a72b62fab9a
https://publications-cnrc.canada.ca/fra/voir/objet/?id=7729397c-e7c8-4252-a0c9-7a72b62fab9a
Archives des publications du CNRC
This publication could be one of several versions: author’s original, accepted manuscript or the publisher’s version. / La version de cette publication peut être l’une des suivantes : la version prépublication de l’auteur, la version acceptée du manuscrit ou la version de l’éditeur.
For the publisher’s version, please access the DOI link below./ Pour consulter la version de l’éditeur, utilisez le lien DOI ci-dessous.
https://doi.org/10.1051/e3sconf/20184005010
Access and use of this website and the material on it are subject to the Terms and Conditions set forth at
Comparison of large woody debris prototypes in a large scale
non-flume physical model
Comparison of Large Woody Debris Prototypes in
a Large Scale Non-flume Physical Model
Brian Perry1,*, Colin Rennie1, Andrew Cornett1, 2, and Paul Knox2 1Department of Civil Engineering, University of Ottawa, Ottawa, Ontario Canada
2Ocean, Coastal and River Engineering, National Research Council of Canada, Ottawa, Ontario
Canada
Abstract. Due to excessive rainfall in June of 2013, several rivers located in and near the City of Calgary, Canada experienced significant flooding events. These events caused severe damage to infrastructure throughout the city, precipitating a renewed interest in flood control and mitigation strategies for the area. A major potential strategy involves partial diversion of Elbow River flood water to the proposed Springbank Off-Stream Storage Reservoir. A large scale physical model study was conducted to optimize and validate the design of a portion of the new project. The goals of the physical model were to investigate diversion system behaviors such as flow rates, water levels, sediment transport and, debris accumulation, and optimize the design of new flow control structures to be constructed on the Elbow River. In order to accurately represent the behavior of debris within the system due to flooding, large woody debris created from natural sources was utilized in the physical model and its performance was compared to that of debris of the same size fabricated from pressed cylindrical wood dowels. In addition to comparing the performance of these two debris types, the impact of root wads on debris damming was also investigated. Significant differences in damming behavior was shown to exist between the natural debris and the fabricated debris, while the impact of root wad on damming affected the dam structure and formation. The results of this experiment indicate that natural debris is preferred for studies involving debris accumulation.
1. Introduction
Large woody debris (LWD) and its interaction with river systems has been a topic of interest for researchers for over 50 years. Extensive information regarding the impact of LWD on the geomorphology and ecology of a river system is available, however significant gaps exist with respects to wood, fluxes in water, sediment transport and other phenomena in a river system [1]. Entrainment of LWD due to flooding, and the associated impacts once entrained has become an ever important topic of research due to the increasing frequency of flood events globally. In June 2013, the City of Calgary, Canada experienced significant flood events along the Elbow and Bow Rivers, which resulted in extensive damage to the city and surrounding areas. These events led to increased awareness of flood risk and an in-depth analysis of the Elbow River, including a proposal to mitigate future flood damage by diverting floodwater from the Elbow River to a new Springbank Off-Channel Reservoir.
In order to optimize and validate the design of the floodwater diversion system, a large-scale physical model of a portion of the Elbow River was created at the Ocean Coastal and River Engineering Research Centre (OCRE) of the National Research Council of Canada (NRC). Among other things, the physical model was used to assess the behavior of LWD arriving at new flow control and diversion inlet structures as a significant amount of LWD was identified along the banks and floodplain of the Elbow River following the 2013 flood [2]. Both realistic debris fabricated from natural tree limbs as well as less realistic debris made of wooden dowel were studied. Both debris types have been used in previous physical modelling studies [3] however, the authors are unaware of a previous direct comparison of the performance of realistic natural debris and wooden dowels in a non-flume physical model. The Springbank physical model presented an opportunity to compare each LWD type at a large scale.
2. Experimental Setup
An undistorted length scale of 1:16 was selected in order to comply with laboratory constraints while maintaining the largest possible ratio between model and prototype. Froude scaling was used to relate quantities in the model with corresponding quantities in nature. The physical model occupied a 50m by 30m footprint and included realistic scaled reproductions of the bathymetry and topography around the location of the new diversion inlet, including the natural river channel and adjacent floodplain as well as the proposed diversion channel, new diversion inlet and sluiceway/spillway structures. The bathymetry and topography were modelled as a rigid surface formed in grout. Plywood templates were cut and placed at 1-meter intervals then filled with gravel and grout to simulate the study area terrain. Main and secondary channels were constructed and wooded portions of the floodplain identified in aerial photos were replicated in the model by placing natural tree limbs into the wet grout.
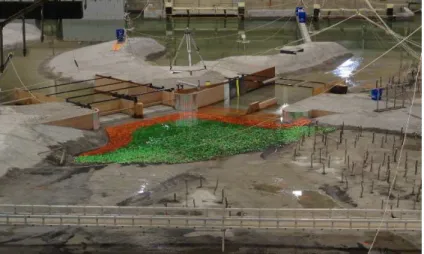
Figure 1: Springbank Physical Model, view facing downstream; Diversion structure (left) and Main Channel structure (right) can be seen in the photo as well as the wooded portions of the floodplains with scaled trees placed vertically within the grout.
2. Experimental Setup
Flow rates for the model were selected to match a series of design events
established through a detailed study of hydrologic processes in the watershed and estimated using numerical runoff models as well as historical data for the Elbow River [4]. The flow rates used in testing are shown in Table 1. A variable-pitch pump drawing from a large sump was used to supply a steady adjustable discharge to the upstream side of the model, and a pair of adjustable sharp-crested weirs were used to control the water level on the downstream side of the river and diversion channels. Figure 1 displays an upstream view of the physical model. The diversion inlet and channel leads left while the natural river channel and spillway structure leads right.
Table 1: Model Flowrates
Target Flowrate (m3/s) Model Flowrate (m3/s)
60 0.06
160 0.16
320 0.31
760 0.74
1240 1.21
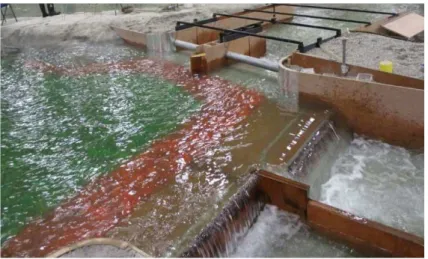
Two separate structures were created within the model to match designs developed by the engineering design team [5]. The river channel flow control structure was composed of two spillways (1.5m in width on the left, 1.125m on the right) with Obermeyer-type crest gates separated by a central pier, while the diversion channel consisted of two spillways (both 1.25m in width) with vertical lift gates separated by a single pier. Chute blocks were located downstream of the diversion inlet structure and riprap was placed in front of the structures, painted both orange and green. Figure 2 shows the crest gates restricting discharge down the main channel and the diversion channel inlet near full capacity.
Figure 2: Diversion (top) and Main Channel (bottom) Structures at the target flow rate of 760 m3/s.
channel. The debris rack positioning was selected in order to maximize the area directly perpendicular to the flow path entering the diversion channel. Two debris racks consisting of 4 vertical posts separated 31.3 cm apart were positioned directly upstream of the diversion channel gates. The opening between posts was approximately equal to 1/3 the mean length of the LWD.
The LWD used for testing was classified into three categories: realistic debris with root wad (RDR), realistic debris without root wad (RDN), and manufactured debris (MD) which consisted of cylindrical wood dowels. Each of these categories had similar length, diameter and density characteristics as defined in table 2. The realistic debris naturally tapered and therefore has a large diameter (base of debris) and a small diameter (tip of debris). The manufactured debris had one consistent diameter.
Table 2: LWD Properties
Debris Type Mean Length (m) Mean Large Diameter (m) Mean Small Diameter (m) Mean Density (kg/m3) RDR 1.00 0.025 0.00875 652 RDN 1.00 0.025 0.00875 652 MD 1.00 0.025 0.025 399
Field investigations suggested approximately 60% of debris had root wad attached to the base. Therefore, of the 200 pieces of realistic debris created, 120 included root wad attached to their base. The root wad was created using thin wood strips attached in an “X” pattern approximately 5 cm in diameter.
3. Testing Method
Three testing procedures were created in order to compare the percent passing of the three LWD types. All tests were performed with 0.74 m3/s model discharge, with 80% of flow passing through the diversion channel inlet. All tests were recorded using both video cameras and time-lapse photos. The image collection frequency for the time-lapse photos was 0.5 Hz.
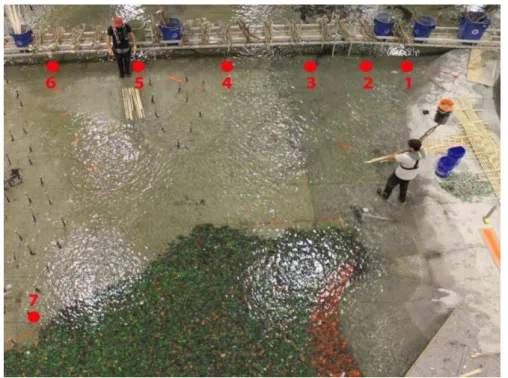
The first test series involved debris rafts of various sizes released from seven pre-determined locations upstream of the diversion structure with no debris rack in place, dubbed the debris raft test. The raft sizes selected consisted of 4 pieces, 10 pieces and 40 pieces of debris. The seven release locations are identified in Figure 4 and were situated along flow paths previously mapped during clear water testing. All rafts were released with the same orientation, parallel to the flow path, with the individual debris pieces aligned in parallel to one another and no debris piece released atop another. The number of pieces passing through the diversion channel was recorded and all pieces accumulated on the structure were removed prior to the release of the next raft. Figure 3 shows release of a 10-piece raft at location 5.
pe gth y
3. Testing Method
Figure 3: Release locations of all debris tests and example deployment of 10-piece MD raft. The raft was released parallel to the flow path with no overlapping debris pieces.
The second test series consisted of 15 identical rafts of each debris type being released from the same location with the debris rack positioned in front of the diversion channel. Based on previous research of blocking probability of wood [9], 15 tests per debris type was deemed sufficient to represent the blocking behavior of each debris type. The raft size selected was 10 pieces of debris per raft and the release location selected was location 5. This location was selected as the associated flow path ran directly through the center of the debris rack. All rafts were released with the same orientation, parallel to the flow path. The number of pieces passing the debris rack was recorded and all pieces accumulated on the debris rack were removed prior to the release of the next raft. This was dubbed the repeatability test.
The third testing procedure consisted of single pieces of debris released continually until 40 total pieces were released and arrived at the debris rack situated downstream. All debris pieces were released from location 5. No pieces were removed while the continual release occurred. The number of pieces passing the debris rack and their position within the release sequence were recorded. This test was dubbed the single debris test.
4. Experimental Results
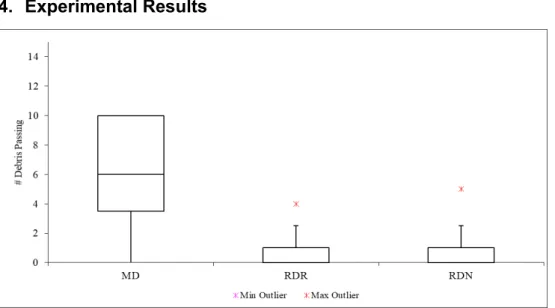
Figure 4: Repeatability Results: The largest/single box represents the median to the 75th percentile
(Q3) of the data and the smaller box represents the 25th percentile (Q1) to the median (MD only). The
whiskers are equal to 1.5 times the difference between Q3 and Q1.
The debris raft results were used to determine the release location and raft size of the repeatability test. It was determined that of the seven release locations, location 5 led to the highest probability of a 10 piece debris raft interacting with the center of the debris rack.
During the repeatability testing, the manufactured debris was observed to have a higher percent passing in 13 of 15 trials. The mean number of debris pieces passing for MD was 6.27 pieces per 10 piece raft. The corresponding numbers for the RDN and RDR debris types were 0.87 and 0.67 pieces per 10 piece raft respectively. Comparing the repeatability results utilizing Students’ T-test (95% confidence) it was determined that the results for the MD debris type were statistically significantly different from the results of both other LWD types. Assessing the single debris test, 20% of MD debris released passed the debris rack, while 5% of RDN and 2.5% of RDR was observed passing the rack. In each test the first of 40 pieces of debris passed the rack, and the first and second piece of 40 passed the rack for both the MD and RDN. Following this, only the MD debris experienced additional pieces passing; these were the 13th, 15th, 26th, 27th, 28th and 29th pieces. Figure 5 displays the damming characteristics of each debris type.
5. Discussion
Assessing the repeatability results, it was determined that the MD exhibited statistically different behavior than natural debris. The manufactured debris passed the debris rack more often, despite being released from an identical location and orientation. This suggests that the roughness of each individual natural debris piece plays a large role in its interaction with other pieces and the debris rack structure.
4. Experimental Results
5. Discussion
Figure 5: 40 piece debris dam at the debris rack located directly upstream of the diversion structure. MD (top), RDN (middle), RDR (bottom).
This can be observed in the results from the repeatability test but also within the final dam shape observed at the rack. MD dams exhibited little to no perpendicular or angular pieces at the rack, while a significant portion of natural debris (both root wad and no root wad) dams contained perpendicular and angular pieces. These protruding pieces could be located above the rack or extended beyond the rack’s face having partially entered the diversion inlet. Comparing realistic debris with root wad to its counterpart without root wad, a less distinct difference in behavior could be drawn. The two debris types could not be considered statistically significantly different even though the root wad debris
experienced less pieces passing the debris rack within the repeatability test. Further investigations including identifying individual events where root wad is the sole reason for debris blocking is therefore required and will be conducted as it was noted visually that root wads was affecting the debris damming behavior. The results from the single debris test agreed with the results from the repeatability test and provided insight as to how LWD dams formed, including notable key-log pieces arriving at the debris rack prior to damming, however the reproducibility of the results cannot be commented on as each test was
6. Conclusion
Based on the results from the physical model experiments it is evident that the manufactured debris, constructed of smooth cylindrical wooden dowels, behave in a manner that is statistically significantly different from similar debris collected from natural wood material in a non-flume physical model. The impact of natural roughness between individual debris pieces causes raft and damming behavior that was not observed within the manufactured debris and a satisfactory number of trials were conducted in order to validate these results. For this reason, it is pertinent that testing with LWD be performed with debris collected from natural sources or be manufactured to have a similar degree of roughness in order to attain realistic results. The impact of root wad on the blocking probability of the debris was noted however further investigations are required in order to determine the extent to which it increases debris damming.
References
[1] E. Wohl, (2017). Bridging the gaps: An overview of wood across time and space in diverse rivers. Geomorphology, 279, 3-26. doi:10.1016/j.geomorph.2016.04.014
[2] A. Cornett, P. Knox, J. Menninger, R. Lux, & M. Provan, (2017). Assessment of debris issues impacting design of a flood diversion project in a large scale physical model.
Proceedings 37th IAHR World Congress. Kuala Lumpur, Malaysia.
[3] M. S. Gallisdorfer, S. J. Bennett, J. F. Atkinson, S. M. Ghaneeizad, A. P. Brooks, A. Simon, & E. J. Langendoen, (2014). Physical-scale model designs for engineered log jams in rivers. Journal of Hydro-Environment Research, 8(2), 115-128.
doi:10.1016/j.jher.2013.10.002
[4] B. Kappel, S. Abbas, S. Figliuzzi, S. Guangul, J. Menninger, & G. Sabol, (2016). Updating PMP for the elbow river: complex terrain, unique solutions. Proceedings CDA
2016 Annual Conference. Halifax, Canada.
[5] P. Knox, A. Cornett, M. Provan, J. Menninger, R. Lux, & S. Abbas, (2017). Assessment of debris issues impacting design of a flood diversion project in a large scale physical model. Proceedings 2017 CSCE Conference. Vancouver, Canada
[6] L. Schmocker, & W. H. Hager, (2013). Scale modeling of wooden debris accumulation at a debris rack. Journal of Hydraulic Engineering, 139(8), 827-836.
doi:10.1061/(ASCE)HY.1943-7900.0000714
[7] M. I. Rusyda, (2015). Log jams at a bridge with a pier and a bridge without pier.
Proceedings EACEF-5., 125 277-283. doi:10.1016/j.proeng.2015.11.040
[8] J. H. Zar, (1996). Biostatistical Analysis, 3rd edition. Upper Saddle River, New Jersey: Prentice Hall
[9] P. Furlan, M. Pfister, J. Matos, & A. J. Schleiss, (2017). Blocking probability of driftwood at ogee crest spillways with piers: influence of woody debris characteristics.
Proceedings 37th IAHR World Congress. Kuala Lumpur, Malaysia