Allergic inflammatory memory in human
respiratory epithelial progenitor cells
The MIT Faculty has made this article openly available.
Please share
how this access benefits you. Your story matters.
Citation
Ordovas-Montanes, Jose et al. "Allergic inflammatory memory in
human respiratory epithelial progenitor cells." Nature 560, 7720
(2018): 649–654 © 2018 Springer Nature
As Published
http://dx.doi.org/10.1038/s41586-018-0449-8
Publisher
Springer Nature
Version
Author's final manuscript
Citable link
https://hdl.handle.net/1721.1/122932
Terms of Use
Article is made available in accordance with the publisher's
policy and may be subject to US copyright law. Please refer to the
publisher's site for terms of use.
Allergic inflammatory memory in human respiratory epithelial
progenitor cells
Jose Ordovas-Montanes#1,2,3,4, Daniel F. Dwyer#5,6, Sarah K. Nyquist1,2,3,7,9, Kathleen M. Buchheit5,6, Marko Vukovic1,2,3, Chaarushena Deb1,2,3, Marc H. Wadsworth II1,2,3, Travis K. Hughes1,2,3, Samuel W. Kazer1,2,3, Eri Yoshimoto5,6, Katherine N. Cahill5,6, Neil
Bhattacharyya6,8, Howard R. Katz5,6, Bonnie Berger9,10,11, Tanya M. Laidlaw5,6, Joshua A. Boyce5,6, Nora A. Barrett#5,6, and Alex K. Shalek#1,2,3,11
1.Institute for Medical Engineering and Science (IMES), Department of Chemistry, and Koch Institute for Integrative Cancer Research, MIT, Cambridge, MA, USA
2.Broad Institute of MIT and Harvard, Cambridge, MA, USA 3.Ragon Institute of MGH, MIT and Harvard, Cambridge, MA, USA
4.Division of Infectious Diseases and Division of Gastroenterology, Boston Children’s Hospital, Boston, MA, USA
5.Jeff and Penny Vinik Center for Allergic Disease Research, Division of Rheumatology, Immunology, and Allergy, Brigham and Women’s Hospital, Boston, MA, USA
6.Department of Medicine, Harvard Medical School, Boston, MA, USA 7.Program in Computational and Systems Biology, MIT, Cambridge, MA, USA 8.Department of Surgery, Brigham and Women’s Hospital, Boston, MA, USA
9.Computer Science and Artificial Intelligence Laboratory, MIT, Cambridge, MA, USA 10.Department of Mathematics, MIT, Cambridge, MA, USA
11.Harvard-MIT Division of Health Sciences & Technology, Cambridge, MA, USA
# These authors contributed equally to this work.
Users may view, print, copy, and download text and data-mine the content in such documents, for the purposes of academic research, subject always to the full Conditions of use:http://www.nature.com/authors/editorial_policies/license.html#terms
AUTHOR CONTRIBUTIONS
J.O.M., D.F.D., T.M.L., J.A.B., N.A.B., and A.K.S. designed the study. N.B., performed surgeries. J.O.M., D.F.D., C.D., M.V., K.M.B., K.N.C., E.Y. collected patient samples and performed single-cell experiments. J.O.M., M.V., D.F.D., E.Y. performed in vitro experiments, M.H.W., and T.K.H provided Seq-Well platform and expertise. H.R.K., and E.Y. performed histologic analyses. B.B. provided supervision and analyzed epigenetic experiments. J.O.M., D.F.D., S.K.N., and S.W.K. analyzed data. J.O.M., D.F.D., S.K.N., N.A.B., and A.K.S. interpreted data. J.O.M., D.F.D., N.A.B., and A.K.S. wrote the manuscript, with input from all authors.
AUTHOR INFORMATION
Reprints and permissions information is available at www.nature.com/reprints. The authors declare no competing financial interests. Readers are welcome to comment on the online version of the paper. Aligned and quality-filtered data and complete statistical outputs for manuscript figures are included in manuscript as Supplementary Tables, with further information at http://shaleklab.com/ resources/. Correspondence and requests for materials should be addressed to A.K.S. ([email protected]) and/or N.A.B. ([email protected]).
SUPPLEMENTARY INFORMATION
HHS Public Access
Author manuscript
Nature
. Author manuscript; available in PMC 2019 February 22.Published in final edited form as:
Nature. 2018 August ; 560(7720): 649–654. doi:10.1038/s41586-018-0449-8.
A
uthor Man
uscr
ipt
A
uthor Man
uscr
ipt
A
uthor Man
uscr
ipt
A
uthor Man
uscr
ipt
Barrier tissue dysfunction is a fundamental component of chronic human inflammatory diseases1. Specialized epithelial subsets—including secretory and ciliated cells—
differentiate from basal stem cells to collectively protect the upper airway2–4. There, allergic inflammation can develop from persistent activation5 of Type 2 immunity6 (T2I), resulting in chronic rhinosinusitis (CRS): ranging from rhinitis to severe nasal polyps7. Basal cell hyperplasia is a hallmark of severe disease7–9, yet how these progenitors2,10,11 contribute to clinical presentation and barrier tissue dysfunction in humans remains unexplored. Profiling primary human surgical CRS samples (18,036 cells, n=12) that span the disease spectrum with Seq-Well12 for massively-parallel single-cell RNA-sequencing (scRNA-seq), we report transcriptomes for human respiratory epithelial, immune, and stromal cell types/subsets from a T2I inflammatory disease, and map key mediators. Through comparison with nasal scrapings (18,704 cells, n=9), we define core, healthy, inflamed, and polyp secretory cell signatures. We find striking differences between the epithelial compartments of the non-polyp and non-polyp cellular ecosystems, identifying and validating a global reduction of cellular diversity in polyps characterized by basal cell hyperplasia, concomitant decreases in
glandular cells, and phenotypic shifts in secretory cell antimicrobial expression. We detect an aberrant basal progenitor differentiation trajectory in polyps, and propose cell-intrinsic13, epigenetic14,15, and extrinsic factors11,16,17 that lock polyp basal cells into this uncommitted state. Finally, we functionally validate that basal cells ex vivo retain intrinsic memory of IL-4/IL-13 exposure, and test the potential for clinical administration of IL-4Rα blockade to modify basal and secretory cell states in vivo. Overall, we identify that a key element of T2I barrier tissue dysfunction is reduced epithelial diversity stemming from functional shifts in basal cells. Our data demonstrate that epithelial stem cells may contribute to the persistence of human disease by serving as repositories for allergic memories.
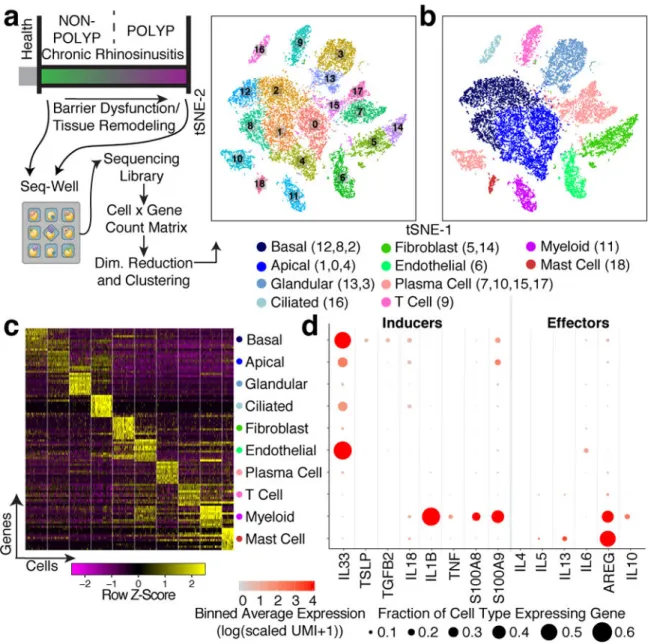
The T2I module6 regulates homeostatic processes18 (metabolism), host defense19 (parasites, venoms, allergens, toxins) and inflammatory tissue repair11. However, this module may become self-reinforcing in allergic inflammation leading to substantial alterations in gross tissue architecture20 as observed in polyps7. To investigate how the overall tissue cellular ecosystem shifts in composition and state during chronic respiratory T2I disease in humans, we used Seq-Well12 to profile the ethmoid sinus (EthSin) of patients spanning the CRS spectrum (Fig. 1a; Supplementary Table 1; Methods; Supplementary Information; n=12 samples: 6 non-polyp, 6 polyp). Deconstructing these tissues into their component cells provides a unique lens into the cellular ecosystem of human T2I, helping us to: 1. characterize each major cell type without biases typically introduced by marker pre-selection; 2. evaluate cell types/states with striking disease-associated transcriptional differences; and 3. reconstruct tissue-level dynamics.
We derived a unified cells-by-genes expression matrix (18,036 cells) and performed dimensionality reduction and graph-based clustering (Fig. 1a; Extended Data Fig. 1a,b; Supplementary Table 2; Methods). We used complete lists of cluster-specific genes to identify epithelial2, stromal7,20, and immune cells4,6, recovering a reproducible distribution of cell types across patients (Fig. 1b,c; Extended Data Figs. 1c–e&2a–e; Supplementary Table 3; Methods; Supplementary Information). We highlight the major types recovered: basal (KRT5) and apical (KRT8)—which orient the pseudostratified epithelial division—
A
uthor Man
uscr
ipt
A
uthor Man
uscr
ipt
A
uthor Man
uscr
ipt
A
uthor Man
uscr
ipt
further specialized ciliated (FOXJ1) and glandular3 (LTF) cells, and supportive endothelial (DARC), fibroblast (COL1A2), plasma (CD79A), myeloid (HLA-DRA), T (TRBC2), and mast cells (TPSAB1) (Extended Data Fig. 1e). For each cell type, sub-clustering revealed further, potentially meaningful heterogeneity, providing a useful reference atlas for studying human inflammatory diseases of barrier tissues (Extended Data Fig. 3a–c; Supplementary Information).
Next, we charted the cell-of-origin for chemokines and lipid mediators, which aid in the recruitment and positioning of lymphoid and myeloid cells in tissues during T2I21 (Extended Data Fig. 4a; Supplementary Information). For example, we found mast cells specifically enriched for HPGDS, PTGS2, and ALOX5, suggesting they may be a dominant source of prostaglandin D2, implicated in activation of T-helper 2 (Th2) cells4. Alongside these mediators, the production of instructive first-order cytokines primes recruitment and activation of effector mechanisms. In particular, IL-25, IL-33, and TSLP are broadly regarded as epithelial-derived cytokines4,5,16,20,22, yet little is known about their cell-of-origin in human disease. TSLP was uniquely restricted to basal cells, which may link increased basal cell numbers to activation of effector cells (Fig. 1d; Extended Data Figs. 3a&4b,c; Supplementary Information).
Second-order effector cytokines were identified in a subset of CD4+ T cells expressing IL4, IL5, IL13, and HPGDS, fitting the profile of allergen-specific Th2A cells23 (Fig. 1d; Extended Data Fig. 4c–e; Methods; Supplementary Information). Additionally, substantial numbers of mast cells produced IL5 and IL13, which along with myeloid cells, were the main expressers of the tissue-reparative cytokine AREG22. Notably, patients with or without polyps showed consistent cells-of-origin for T2I-related chemokines, lipids, and cytokines, except select mediators (Extended Data Fig. 4a,b; Supplementary Information). Several genome-wide association studies (GWAS)-implicated genes for allergic diseases24 were restricted to specific cell types. Thus, we mapped the expression of proposed risk genes including GATA2, IL1RL1 (IL-33R), CDHR3, KIF3A, TMEM232 and MYC (Extended Data Fig. 4f; Supplementary Information). Cellular maps of tissues frequently affected by inflammatory disease should aid in providing mechanistic insights into genotype-phenotype interactions.
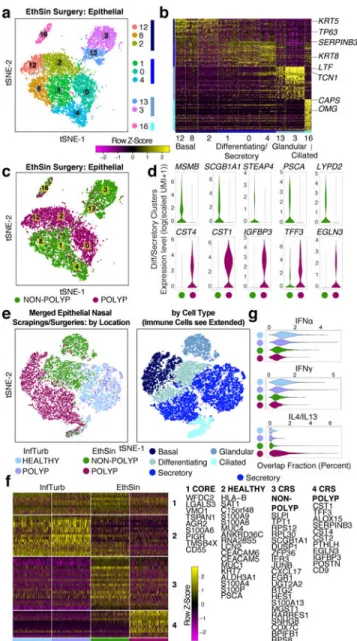
We further analyzed clusters within the broad epithelia (Fig. 2a; Extended Data Fig. 5a–c) providing single-cell human transcriptomes25 for basal, secretory, glandular, and ciliated cell types from a T2I ecosystem (Fig. 2a,b; Extended Data Fig. 5; Supplementary Table 3). Epithelial marker gene analysis identified conserved programs present in basal (clusters=3), differentiating/secretory (clusters=3), glandular (clusters=2) and ciliated (clusters=1) types (Fig. 2a,b; Extended Data Fig. 5a–d; Supplementary Table 3, Supplementary
Information)2,3.
Observing striking polyposis-related differences across clusters within cell types (Fig. 2c; Extended Data Fig. 5e; Supplementary Information), we quantified the numerical over-representation of cells from non-polyp and polyp ecosystems within each cluster and type. The clusters comprising basal, differentiating/secretory, and glandular cells showed the most significant links to disease-state (p-values: Fisher’s with least-significant-difference; Fig. 2c;
A
uthor Man
uscr
ipt
A
uthor Man
uscr
ipt
A
uthor Man
uscr
ipt
A
uthor Man
uscr
ipt
Supplementary Table 3). We compared transcriptomes of differentiating/secretory cells3 (containing KRT8 secretory and apical goblet cells), noting that secretory cells from polyps appear to supplant antimicrobial function with tissue-repair (Fig. 2d; Supplementary Table 3, Supplementary Information).
Intriguingly, we observe expression of MUC5B within glandular mucus cells (cluster 13), but MUC5AC in a distinct subset of secretory goblet cells co-expressing SCGB1A1 and FOXA3 (Fig. 2b; Extended Data Fig. 5f,g, Supplementary Information). This suggests the goblet cell program is layered atop a secretory cell base2. We also assessed glandular heterogeneity identifying five discrete subsets with variegated antimicrobial expression3 (Fig. 2a; Extended Data Fig. 6a,b; Supplementary Table 3; Supplementary Information). This compartmentalization may represent a mechanism for regulated secretion, with imbalances affecting innate host defense.
To contextualize disease-associated shifts, we turned to sino-nasal scrapings as a method of sampling healthy apical cells through Seq-Well (Extended Data Fig. 6c,d, Methods;
Supplementary Tables 3&6; 18,704 additional cells: n=3 healthy inferior turbinate (InfTurb), n=4 polyp-patient InfTurb, n=2 polyp directly). We recovered immune cells, differentiating/ secretory and ciliated epithelial cells from the InfTurb of patients with polyposis and healthy controls, but basal cells only in polyp scrapings (Extended Data Fig. 6d–f; Supplementary Table 3; Supplementary Information). By combining all epithelial cells from surgical resections with scrapings (Fig. 2a–c,e), we identified a conserved secretory core gene set present in all sites sampled, and healthy, InfTurb, EthSin-non-polyp and CRS-EthSin-polyp specific gene signatures. Overall, we note a shift from IFNα-/IFNγ-induced to IL-4/IL-13-induced genes with increasing disease severity (Fig. 2e–g; Supplementary Table 3; Supplementary Information). Secretory cells from involved CRS-EthSin tissue differ significantly from the InfTurb, and secretory cells in non-polyp and polyp EthSin reach distinct states whose altered functionality may be linked to disease severity.
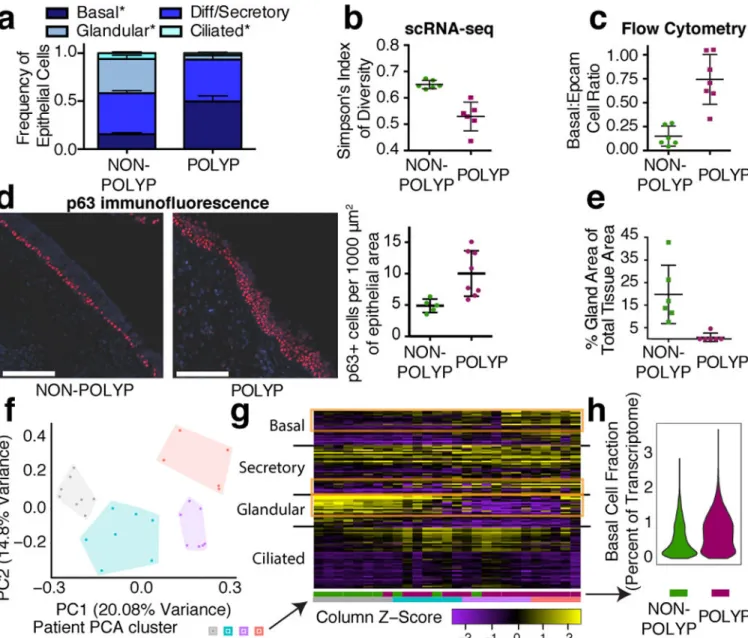
As specialized epithelial cell types arise from basal progenitors2,10, we formally examined their distribution in each sample (Fig. 3a; Extended Data Fig. 7a). Our data indicate a significant loss of epithelial ecological diversity in nasal polyps by Simpson’s Index (Methods), largely driven by glandular and ciliated cell depletion, and an enrichment in basal cells (Fig. 3a,b; Extended Data Fig. 7a–d; Supplementary Information). This altered diversity tracked closely with rank-ordered pathology of patient tissue samples, which correlated positively with basal cell frequency (r=0.6252) and negatively with epithelial diversity (r=−0.6824; Extended Data Fig 7e). We speculate immune cells in polyps may represent an overcorrection in attempting to balance the epithelial compartment (Extended Data Fig. 7f; Supplementary Information).
To confirm our epithelial findings, we utilized complementary approaches. With flow cytometry10, we demonstrated that the frequency of basal cells significantly increased in polyps at the expense of differentiated epithelial cells in 13 additional patients (Fig. 3c; Extended Data Fig. 7g,h). Using histology (not subject to dissociation-induced artifacts like scRNA-seq or flow cytometry), we confirmed8 a significant increase of p63+ cells per 1,000μm2 of epithelial area, and a striking loss of glands in polyps (Fig. 3d,e; Extended Data
A
uthor Man
uscr
ipt
A
uthor Man
uscr
ipt
A
uthor Man
uscr
ipt
A
uthor Man
uscr
ipt
Fig. 7i,j; Methods). Finally, we utilized marker genes for specialized lineages to deconvolve bulk EthSin-tissue RNA-seq of another 27 individuals. We identified four patient clusters and confirmed glandular enrichment in non-polyps, and shifts in secretory cell states and the progressive acquisition of basal-associated transcripts in polyps (Fig. 2d,f; Fig. 3f,g; Supplementary Tables 1&3; Methods, Supplementary Information). We also validated these findings with publicly-available RNA-seq datasets containing normal human sinus tissue and polyps (Extended Data Fig. 7k,l; Supplementary Information).
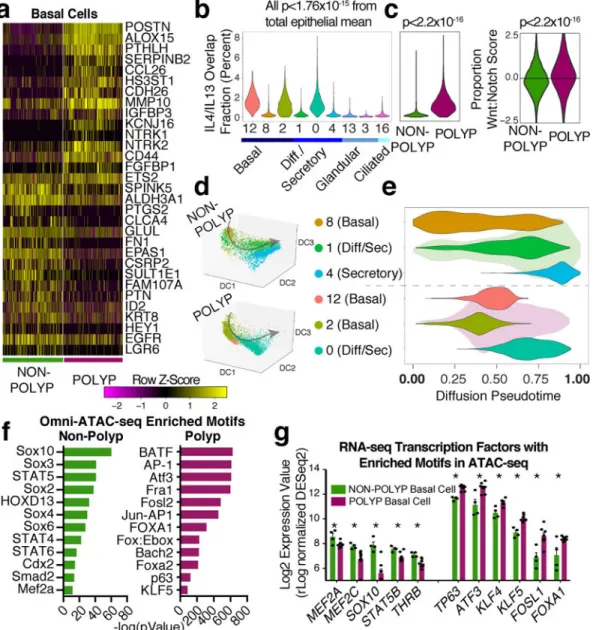
To identify what mechanisms might account for decreased epithelial diversity in polyps, we compared the transcriptomes of non-polyp and polyp basal progenitors2,10, identifying elevated polyp expression of transcripts involved in extracellular matrix remodeling and chemo-attraction of effector cells, and a decrease in protease-inhibitor expression and metabolic genes (Fig. 4a). As some of these upregulated genes are IL-4/IL-13 responsive7, we assessed cytokine-induced gene sets. A combined IL-4/IL-13 signature is strongly induced not only in differentiated polyp epithelium, but also in basal cells, with a large effect size between disease states (Fig. 4b,c; Extended Data Fig. 8a; Methods; Supplementary Table 4). IFNα- and IFNγ-signatures—indicative of a Type-1 immune module6—have small effect sizes (Extended Data Fig. 8b; Supplementary Table 4). Furthermore, from specific hallmark genes, we observed altered balance between Wnt (CD44) and Notch (HEY1) signaling in polyp epithelium favoring Wnt26,27 (Fig. 4a,c; Supplementary Table 4). We further contextualized our basal cell findings by defining alterations in the fibroblast niche that correlate with basal hyperplasia, and identifying significant changes in myeloid and endothelial cell gene expression (Extended Data Figs. 7b&8c–f; Supplementary Information).
Next, we used diffusion pseudotime mapping (Methods), aligning and reconstructing how basal cells differentiate to mature secretory cells to identify where basal cells become “stuck” in polyps. In the non-polyp ecosystem, we observed that basal cells traverse a wider swath of common pseudotime, with the majority of secretory cells distributed towards the trajectory’s terminus (Fig. 4d,e; Extended Data Fig. 9a; Methods). Conversely, in polyps, basal cells accumulate shy of the trajectory’s midpoint, losing the true progenitor position occupied by cluster 8, yet failing to contribute towards later differentiation states (Fig 4d,e; Extended Data Fig. 9a). Ordering cells along this common axis, we identified several genes dysregulated in polyps during epithelial cell differentiation (Extended Data Fig. 9b; Supplementary Table 3; Supplementary Information).
We sorted basal cells (Extended Data Fig. 7h) from 3 non-polyp and 7 polyp tissues and performed Omni-assay for transposase accessible chromatin-(ATAC)-Seq to identify intrinsic epigenetic changes from the integration of extrinsic cellular signaling events28, and subsequent bulk RNA-seq to confirm/extend our findings (Methods). Polyp basal cells were enriched in peaks for bZIP transcription factor motifs, including various AP-1 family members11, such as JUN, FOXA1, ATF3, KLF5 and p63 itself associated with the maintenance of an undifferentiated state, chromatin opening, and oncogenesis (Fig. 4f; Extended Data Fig. 9b–f; Supplementary Table 5, Supplementary Information). Clustering of enriched motifs revealed changes in correlation by disease state (Extended Data Fig. 9c–f; Supplementary Information). We identified expressed candidate transcription factors that
A
uthor Man
uscr
ipt
A
uthor Man
uscr
ipt
A
uthor Man
uscr
ipt
A
uthor Man
uscr
ipt
may bind to these accessible sites (Fig. 4f,g; Extended Data Fig. 9e,f; Supplementary Information). Collectively, our transcriptomic, pseudotemporal, and epigenetic studies led us to hypothesize that during chronic T2I, basal cell differentiation is intrinsically impaired through the influence of extrinsic cues (e.g., IL-4/IL-13 and Wnt pathway).
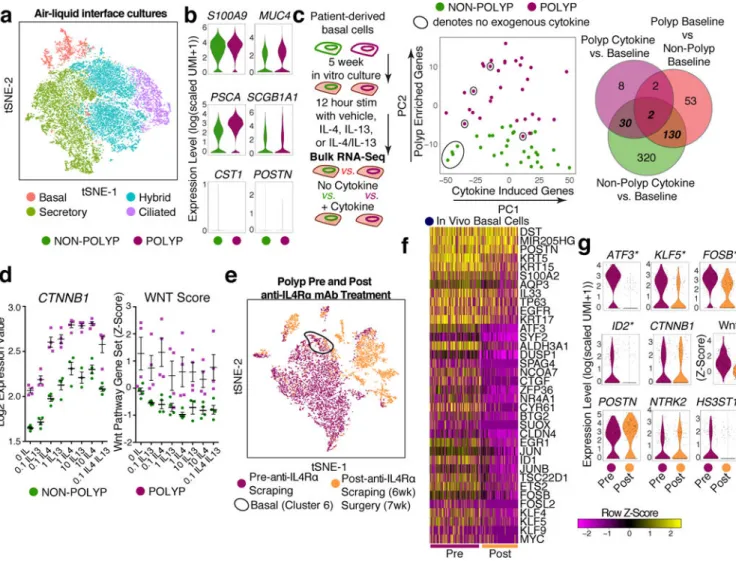
To functionally test for intrinsically altered differentiation potential in vitro, we first seeded basal cells from non-polyp or polyp tissue into air-liquid interface (ALI) cultures (Fig. 5a; Extended Data Fig. 9g; Supplementary Table 3; Methods; Supplementary Information). Our data suggest that basal cells from polyps can be released from their “stuck” state and differentiate towards a mixed-tissue secretory cell phenotype if provided with strong and sustained extrinsic cues, even in the presence of IL-13 (Fig. 5b; Extended Data Figs. 7h&9f,h,i; Supplementary Information).
Second, as ALI cultures enforced strong terminal differentiation, we directly tested how IL-4/IL-13 act to induce rapid expression of genes in basal cells cultured 5 weeks ex vivo hypothesizing that polyp basal cells would respond more vigorously to exogenous cytokines than non-polyp ones14. Surprisingly, we identified 482 genes induced in non-polyp basal cells, but only 42 in polyps (Fig. 5c; Supplementary Table 3). PCA highlighted that while unstimulated non-polyp basal cells grouped together, those from polyp basal cells were distributed along PC1, which captured cytokine stimulation (Fig. 5c). Identifying overlaps in genes significantly induced by cytokine treatment in non-polyp basal cells with genes upregulated at baseline in polyp vs. non-polyp basal cells resolved 132 genes (Fig. 5c; Supplementary Table 3).
We focused on the central overlap of these three differential expression tests, which included CTNNB1 (β-catenin), the key effector of Wnt pathway activation26,27 (Fig. 5c). We
highlight the fundamental finding that CTNNB1 was robustly induced in non-polyp and polyp basal cells in a dose-sensitive fashion to IL-4 and IL-13. Moreover, baseline CTNNB1 expression in polyp basal cells was equivalent to the levels induced by cytokine treatment of non-polyp cells (Fig. 5d). Wnt-pathway target genes were significantly upregulated across doses tested, confirming activation of the pathway overall, and of specific factors (CTGF) (Fig. 5d; Extended Data 9j; Supplementary Table 4; Supplementary Information). Based on polyp epithelial gene signatures (Fig. 4c), and our functional testing for IL-4/IL-13 induced genes “remembered” by polyp basal cells (Fig. 5c,d), we propose that chronic IL-4/IL-13 exposure in vivo can lead to persistent expression of Wnt/CTNNB1 target genes in a cell-intrinsic fashion, even in the absence of exogenous cytokine.
One polyp patient sampled through scraping commenced treatment with a monoclonal antibody (mAb) targeting the shared IL-4Rα subunit of the IL-4 and IL-13 receptors to treat atopic dermatitis, allowing us the chance to examine the in vivo relevance of our
observational, mechanistic and functional data on how T2I cytokines influence basal cell states (Fig. 5e; Extended Data Fig. 10a,b; Methods). We compared cells recovered from pre- and 6-week-post-mAb scrapings, and through surgical intervention at 7 weeks post-mAb (Fig. 5e; Extended Data Fig. 10a,b; Supplementary Table 7; Supplementary Information). We identified basal cells and generated a heatmap containing their top marker genes, agnostic to treatment, followed by genes differentially expressed pre- and post-treatment,
A
uthor Man
uscr
ipt
A
uthor Man
uscr
ipt
A
uthor Man
uscr
ipt
A
uthor Man
uscr
ipt
leveraging myeloid cells to identify basal-specific changes (Fig. 5f; Extended Data Fig. 10a– c; Supplementary Table 3; Supplementary Information).
Contextualizing these findings within our previous data, we identify several key gene sets, including a conserved core set of basal cell genes (Extended Data Fig. 10d). Intriguingly, transcription factors upregulated in polyp basal cells identified through Omni-ATAC-seq/ RNA-seq (ATF3, KLF5, FOSB) were significantly decreased by treatment (Fig. 5g). While Wnt pathway target gene expression was globally reduced, CTNNB1 expression was notably retained, as were genes upregulated both in vitro and in vivo in polyp basal cells, suggesting that some genes in this patient, and at this timepoint, persist (Fig. 5g; Extended Data Fig. 10d; Supplementary Information).
Lastly, we sought to understand how changes in the basal epithelium propagated through to secretory cells. Within secretory cells recovered from scrapings of both InfTurb and accessible polyp tissue pre- and post-treatment, our data suggest that even though EthSin-CRS samples have unique secretory cell signatures (Fig. 2f), cytokine blockade leads to gene expression associated with healthy InfTurb secretory cells, even in polyp tissue (Extended Data Fig. 10e–h; Supplementary Table 8; Supplementary Information).
One goal of understanding the cellular and molecular pathways activated in T2I is to provide mechanisms which explain persistent chronic allergic inflammatory disease29. Utilizing scRNA-seq applied to patients across the CRS spectrum, our study provides descriptive, mechanistic and functional insights into an enigmatic basal cell state and productive differentiation of a barrier tissue. We show striking differences in antimicrobial expression by secretory cells relative to healthy tissue, a loss of glandular cell heterogeneity, and that IL-4/IL-13 strongly induce a transcriptional program already at the level of basal progenitor cells15. Our data may help to explain why nasal polyposis is associated with infections by specific microorganisms7, and how a mAb targeting the shared IL-4/IL-13 receptor can reduce nasal polyp burden (Methods).
Taken together with recent work in the murine intestinal tract and skin11,13,16,17,30, we provide human evidence for the emerging paradigm of stem cell dysfunction altering the set-point of barrier tissues, highlighting substantial overlap amongst putative driving
transcription factors (ATF3, AP-1, TP63, and KLF5)13. This demonstrates that the principle of inflammatory memory28 underlying barrier tissue adaptation is a generalizable
phenomenon observed in distinct anatomical locations, inflammatory modules, and species. We build on these findings by culturing basal cells ex vivo and identifying the indelible mark of IL-4/IL-13 as a baseline induction of the Wnt pathway. We propose that basal cells form “memories” of chronic exposure to an inflammatory T2I environment, shifting the entire cellular ecosystem away from productive differentiation, and propagating disease. Future work will seek to determine the relative contributions of memory stored in distinct cellular compartments to develop the most effective mechanisms by which to erase them.
A
uthor Man
uscr
ipt
A
uthor Man
uscr
ipt
A
uthor Man
uscr
ipt
A
uthor Man
uscr
ipt
METHODS
Study Participants and Design for Single-Cell Study from Ethmoid Sinus Tissue Subjects between the ages of 18 and 75 years were recruited from the Brigham and Women’s Hospital (Boston, Massachusetts) Allergy and Immunology clinic and
Otolaryngology clinic between May 2014 and March 2018 (Supplementary Table 1). The Institutional Review Board approved the study, and all subjects provided written informed consent. Ethmoid sinus (EthSin) tissue was collected at the time of elective endoscopic sinus surgery from patients with physician-diagnosed CRS with and without nasal polyps based on established guidelines31. Patients with polyps include both aspirin-tolerant chronic
rhinosinusitis with nasal polyps (CRS polyp) and individuals with aspirin-exacerbated respiratory disease (AERD), both referred to as CRS-EthSin-polyp for the purposes of this study. Patients were suspected of having AERD if they had asthma, nasal polyposis, and a history of respiratory reaction on ingestion of a COX 1 inhibitor, with confirmation via a graded oral challenge to aspirin. Subjects with cystic fibrosis and unilateral polyps were excluded from the study. No distinctions were made between these two disease endotypes in our study as both present with polyposis, but we present the information of clinical diagnosis in Supplementary Table 1.
A tissue segment (one per patient) for bulk tissue RNA-seq was immediately placed in RNAlater (Qiagen) for RNA extraction, For patient samples loaded on Seq-Well and for flow-sorting to Omni-ATAC-seq/RNA-seq, tissue was received in-hand, placed in RPMI (Corning) with 10% FBS (ThermoFisher 10082–147) and immediately put on ice for transport. Details of the subjects’ characteristics included in scseq cohort, tissue RNA-seq cohort, and basal cell flow cytometry/ATAC-RNA-seq/RNA-RNA-seq cohort (including age, gender, medication use, and disease severity) are included in Supplementary Table 1.
NB: Originally, we enrolled a healthy control subject with no known history of CRS or nasal polyposis who was undergoing sinus surgery for concha bullosa. However, this subject upon pathology evaluation was noted to have mild eosinophilia. A chart review revealed a history of allergic rhinitis and asthma, and their diagnosis was updated to CRS non-polyp clinically by the surgeon upon follow-up visits so we updated their status accordingly in our study. Additionally, non-polyp patient 6 was sampled twice (denoted as 6A and 6B), representing distinct cells that were captured on two different Seq-Well arrays. As such, they should not be viewed as a technical replicate and are referred to as distinct samples.
Collection of Inferior Turbinate and Nasal Polyp Samples through Nasal Scraping Nasal samples were collected from the inferior turbinate (InfTurb) of healthy control subjects and from the inferior turbinate and accessible polyp tissue in subjects with CRS-EthSin-polyps using the Rhino-Pro® Curette, a sterile, disposable, mucosal collection device, as described32,33. One sample was taken from the right and left mid-inferior portion of the inferior turbinate using a gentle scraping motion. In two subjects with CRS polyp, with accessible nasal polyp tissue, the polyp tissue was sampled using the Rhino-Pro® Curette under direct visualization. The nasal scrapings were placed directly in RPMI with 10% FBS and immediately put on ice for transport before loading on Seq-Well arrays.
A
uthor Man
uscr
ipt
A
uthor Man
uscr
ipt
A
uthor Man
uscr
ipt
A
uthor Man
uscr
ipt
Details of the subjects’ characteristics (including age, gender, medication use, and disease severity) are included in Supplementary Table 1.
Nasal scraping allows for access to the superficial epithelial cell layer of the inferior turbinate34; in contrast, the surgical resections from ethmoid sinus we utilize as the central data set of this paper contain both epithelial cells and underlying tissue, including sub-mucosal glands34 (Extended Data Fig. 6c). Since scraping samples a proximal but distinct anatomical location with a distinct technique, in addition to collecting inferior turbinate scrapings from healthy controls (n=3), we also collected inferior turbinate scrapings from individuals with polyps (n=4), and, from two of these individuals, from accessible polyps protruding beyond the middle meatus (n=2).
One subject with CRS polyps and co-morbid severe atopic dermatitis was started on dupilumab35, a human monoclonal antibody that binds to the IL-4Rα subunit approved for severe atopic dermatitis36, and in a randomized, double-blind, placebo-controlled parallel-group study was shown to significantly reduce endoscopic nasal polyp burden after 16 weeks37. The inferior turbinate and nasal polyp tissue was sampled with the Rhino-Pro® Curette pre- and post-treatment with 3 doses of dupilumab, and through endoscopic sinus surgery as noted above.
Tissue Digestion
Single-cell suspensions from collected surgical specimens were obtained using a modified version of a previously published protocol38, described below in detail. Each specimen was received directly in hand and processed directly with an average time from patient to loading onto the Seq-Well platform of 3 total hours, and never exceeding 4 hours. Surgical
specimens were collected into 30 mL of ice cold RPMI (Corning). Specimens were finely minced between two scalpel blades and incubated for 15 minutes at 37°C in a rotisserie rack with end-over-end rotation in 25 mL digestion buffer supplemented with 600 U/mL
collagenase IV (Worthington) and 20 μg/mL DNAse 1 (Roche) in RPMI with 10% fetal bovine serum. After 15 minutes, samples were triturated five times using a syringe with a 16G needle and returned to the rotisserie rack for another 15 minutes. At the conclusion of the second digest period, samples were triturated an additional five times using a syringe with a 16G needle, at which point the digest process was stopped via the addition of EDTA to 20mM. Nasal scrapings were only dissociated with one 15 minute dissociation via collagenase and omission of the 16G needle trituration, instead replaced with P1000 pipette trituration, as typically cell yields were <20,000 total cells. Processing downstream
remained identical. Samples were typically fully dissociated at this step and were filtered through a 70μM cell strainer and spun down at 500G for 10 minutes followed by a rinse with ice-cold PBS (ThermoFisher 10010023, Ca/Mg-free) to 30 mL total volume. Red blood cells (RBCs) were lysed using ACK buffer (ThermoFisher A1049201) for 3 minutes on ice to remove RBCs, even if no RBC contamination was visibly seen in order to maintain consistency across patient groups. Cells were then washed with sterile PBS and spun down at 500G for 5 minutes, resuspended in complete RPMI medium with 2% FCS (RPMI1640 [ThermoFisher 61870–127], 100 U/ml penicillin [ThermoFisher 15140–122], 100 μg/mL streptomycin [ThermoFisher 15140–122], 10 mM HEPES [ThermoFisher 15630–080], 2%
A
uthor Man
uscr
ipt
A
uthor Man
uscr
ipt
A
uthor Man
uscr
ipt
A
uthor Man
uscr
ipt
FCS [ThermoFisher 10082–147], 50 μg/mL gentamicin [ThermoFisher 15750–060]), and counted to adjust concentration to 100,000 cells/mL for loading onto Seq-Well arrays. Flow Cytometry, Cell Sorting, and Analysis
Single-cell suspensions in FACS Buffer (HBSS [ThermoFisher 14170161, Ca/Mg-free] supplemented with 2% FCS) were pre-incubated with Fc-Block (BD 564220) before staining for surface antigens. The following antibodies were used to identify basal cells via flow cytometry: FITC human THY1 (Biolegend, clone 5E10), Brilliant Violet 421 anti-human CD45 (Biolegend, clone HI30), Brilliant Violet 650 anti-anti-human EPCAM (Biolegend, clone 9C4), APC/Cy7 anti-human ITGA6 (Biolegend, clone GoH3), PE/Cy7 anti-human NGFR (Biolegend, clone ME20.4), APC anti-human PDPN (Biolegend, clone NC-08). Cells were stained for 30 minutes on ice in FACS buffer and then washed for immediate sorting. Cells were sorted on a BD FACSAria Fusion cell sorter using BD FACSDiva software. Up to 10,000 Basal cells were sorted into 100 μL BAM banker (Wako chemicals) for Omni-ATAC-seq and cooled to −80°C using a “Mr. Frosty” freezing container (Thermo scientific). Samples were stored at −80°C until thawed for Omni-ATAC-seq. 1,000 Basal cells for bulk RNAseq were sorted directly into 5 μL TCL buffer (Qiagen). FlowJo v10 by TreeStar was used to generate plots.
Histologic Analyses
Biopsies were fixed in 4% paraformaldehyde, embedded in paraffin, and 6 µm sections were prepared and stained with hematoxylin and eosin for quantification of glandular areas. Photomicrographs encompassing the entire area of each biopsy were taken. Total and glandular areas were measured with Image J software and expressed as glandular area as a percentage of total area. For p63 immunofluoresence, sections were quenched for 10 minutes in 1 mg/mL sodium borohydride in PBS. For antigen retrieval, slides were placed in a Coplin jar with preheated citrate target retrieval buffer (DAKO) at 95°C and transferred to a steamer for 60 minutes. Slides were cooled for 20 minutes at room temperature and then transferred to distilled water followed by PBS. Samples were blocked with serum free protein block (DAKO) containing 5% normal donkey serum for 60 minutes. Samples were incubated overnight at 4°C with purified anti-TP63 antibody (Biolegend, clone W15093A). After three washes in PBS-T, samples were incubated with 1:500 AlexaFluor
647-conjugated donkey anti-mouse IgG (Jackson immunoresearch, catalog# 715–605-150) and 1:10,000 Hoescht nuclear dye. Quantification of p63+ cells was performed in a blinded fashion and involved counting of p63+ nuclei relative to background staining with an isotype control primary antibody. As the epithelium can vary in length across sections, we
normalized our quantification of total positive nuclei per 1,000μm2 area of epithelium as measured in ImageJ and report the final value as p63+ cells/1,000μm2 of epithelium. Single-cell RNA-seq with Seq-Well
Once a single-cell suspension was obtained from freshly resected sinus tissue, or scrapings from inferior turbinate, we utilized the Seq-Well platform for massively parallel scRNA-seq to capture transcriptomes of single cells on barcoded mRNA capture beads. Full methods on implementation of this platform are available in Gierahn et al12. Briefly, 20,000 cells were loaded onto one array preloaded with barcoded mRNA capture beads (ChemGenes). The
A
uthor Man
uscr
ipt
A
uthor Man
uscr
ipt
A
uthor Man
uscr
ipt
A
uthor Man
uscr
ipt
loaded arrays containing cells and beads were then sealed using a polycarbonate membrane with a pore size of 0.01 μm, which allows for exchange of buffers but retains biological molecules confined within each nanowell. Subsequent exchange of buffers allows for cell lysis, transcript hybridization, and bead recovery before performing reverse transcription en masse. Following reverse transcription using Maxima H Minus Reverse Transcriptase (ThermoFisher EP0753) and an Exonuclease I treatment (NewEngland Biolabs M0293L) to remove excess primers, PCR amplification was carried out using KAPA HiFi PCR
Mastermix (Kapa Biosystems KK2602) with 2,000 beads per 50 μL reaction volume. Libraries were then pooled in sets of six (totaling 12,000 beads) and purified using Agencourt AMPure XP beads (Beckman Coulter, A63881) by a 0.6X SPRI followed by a 0.7X SPRI and quantified using Qubit hsDNA Assay (Thermo Fisher Q32854). Quality of WTA product was assessed using the Agilent hsD5000 Screen Tape System (Agilent Genomics) with an expected peak >1,000bp tailing off to beyond 5000bp, and a small/non-existent primer peak, indicating a successful preparation. Libraries were constructed using the Nextera XT DNA tagmentation method (Illumina FC-131-1096) on a total of 600 pg of pooled cDNA library from 12,000 recovered beads using index primers with format as in Gierahn et al12. Tagmented and amplified sequences were purified at a 0.6X SPRI ratio yielding library sizes with an average distribution of 650–750 base pairs in length as determined using the Agilent hsD1000 Screen Tape System (Agilent Genomics). Two arrays were sequenced per sequencing run with an Illumina 75 Cycle NextSeq500/550v2 kit (Illumina FC-404-2005) at a final concentration of 2.2–2.8pM. The read structure was paired end with Read 1 starting from a custom read 1 primer12 containing 20 bases with a 12bp cell barcode and 8bp unique molecular identifier (UMI) and Read 2 containing 50 bases of transcript information.
Single-cell RNA-seq Computational Pipelines and Analysis
Read alignment was performed as in Macosko et al39. Briefly, for each NextSeq sequencing run, raw sequencing data was converted to demultiplexed FASTQ files using bcl2fastq2 based on Nextera N700 indices corresponding to individual samples/arrays. Reads were then aligned to Hg19 genome using the Galaxy portal maintained by the Broad Institute for Drop-Seq alignment using standard settings. Individual reads were tagged according to the 12-bp barcode sequenced and the 8-bp UMI contained in Read 1 of each fragment. Following alignment, reads were binned onto 12-bp cell barcodes and collapsed by their 8-bp UMI. Digital gene expression matrices (e.g. cells-by-genes tables) for each sample were obtained from quality filtered and mapped reads, with an automatically determined threshold for cell count. UMI-collapsed data was utilized as input into Seurat40 (https://github.com/satijalab/ seurat) for further analysis. Before incorporating a sample into our merged dataset, we individually inspected the cells-by-genes matrix of each as a Seurat object.
For analysis of all sequenced surgical ethmoid sinus resection samples, we merged UMI matrices across all genes detected in any condition and generated a matrix retaining all cells with at least 500 UMI detected (19,196 cells and 31,032 genes). This table was then utilized to setup the Seurat object in which any cell with at least 300 unique genes was retained and any gene expressed in at least 5 cells was retained (Supplementary Information: an R Script is included from this point to set up Seurat object and walk reader through dimensionality
A
uthor Man
uscr
ipt
A
uthor Man
uscr
ipt
A
uthor Man
uscr
ipt
A
uthor Man
uscr
ipt
reduction and basic data visualization). The object was initiated with log-normalization, from a UMI+1 count matrix, scaling, and centering set to True. The total number of cells passing these filters captured across all patients was 18,624 cells with 22,575 genes, averaging 1,503 cells per sample with a range between 789 cells and 3,109 cells (Extended Data Fig. 1a,b, Supplementary Table 2). Before performing dimensionality reduction, data was subset to include cells with less than 12,000 UMI, and a list of 1,627 most variable genes was generated by including genes with an average normalized and scaled expression value greater than 0.13 and with a dispersion (variance/mean) greater than 0.28. We then performed principal component analysis (PCA) over the list of variable genes. For both clustering and t-stochastic neighbor embedding (tSNE), we utilized the first 12 principal components, as upon visual inspection of genes contained within, each contributed to a non-redundant cell type and this reflected the inflection point of the elbow plot. We used FindClusters within Seurat (which utilizes a shared nearest neighbor (SNN) modularity optimization based clustering algorithm) with a resolution of 1.2 and tSNE set to Fast with the Barnes-hut implementation to identify 21 clusters across the 12 input samples.
For analysis of all sequenced inferior turbinate scraping samples, the object was initiated with log-normalization, from a UMI+1 count matrix, scaling, and centering set to True. The total number of cells passing these filters captured across all patients was 18,704 cells with 24,842 genes, averaging 2,078 cells per sample with a range between 65 cells and 5,625 cells (NB: The 65 cell sample was a very mucus-laden polyp inferior turbinate sample, perhaps explaining the low cell yield, but clustered well within the three other samples each containing 253, 599, and 1,381 cells). Before performing dimensionality reduction, data was subset to include cells with less than 10,000 UMI, and a list of 1,499 most variable genes was generated by including genes with an average normalized and scaled expression value greater than 0.22 and with a dispersion (variance/mean) greater than 0.26. We then
performed PCA over the list of variable genes. For both clustering and tSNE, we utilized the first 16 principal components, as upon visual inspection of genes contained within, each contributed to a non-redundant cell type and this reflected the inflection point of the elbow plot. We used FindClusters (which utilizes an SNN modularity optimization based clustering algorithm) with a resolution of 1 and tSNE set to Fast with the Barnes-hut implementation to identify 18 clusters across the 9 input samples.
For analysis of all sequenced ALI cultures, the object was initiated with log-normalization, from a UMI+1 count matrix, scaling, and centering set to True. The total number of cells passing these filters captured across all patients was 16,173 cells with 27,396 genes, averaging 2,448 cells per sample with a range between 1,980 cells and 3,009 cells. Before performing dimensionality reduction, data was subset to include cells with less than 25,000 UMI, and a list of 1,670 most variable genes was generated by including genes with an average normalized and scaled expression value greater than 0.35 and with a dispersion (variance/mean) greater than 0.35. We then performed PCA over the list of variable genes. For both clustering and tSNE, we utilized the first 16 principal components, as upon visual inspection of genes contained within, each contributed to a non-redundant cell state and this reflected the inflection point of the elbow plot. We used FindClusters (which utilizes an SNN modularity optimization based clustering algorithm) with a resolution of 0.6 and tSNE
A
uthor Man
uscr
ipt
A
uthor Man
uscr
ipt
A
uthor Man
uscr
ipt
A
uthor Man
uscr
ipt
set to Fast with the Barnes-hut implementation to identify 11 clusters across the 4 input samples.
Cell Type Identification and within Cell Type Analysis
To identify genes which defined each cluster, we performed a ROC test implemented in Seurat with a threshold set to an area under the curve of 0.65. Top marker genes with high specificity were used to classify cell subsets into cell types (Fig. 1a–c; Extended Data Fig. 1e) based on existing biological knowledge. Three clusters were considered doublets (588 cells) based on co-expression of markers indicative of distinct cell types at ~1/2 the
expression level detected in the parent cell cluster (e.g. T cell and myeloid cell) and removed from further analyses yielding a matrix with 18,036 cells used in all subsequent steps. Closely related clusters were merged to cell types based on biological curation and analysis of hierarchical cluster trees yielding ten total cell types (Fig. 1a–c; Extended Data Fig. 1e). We identified a much smaller number of eosinophils than expected in our single-cell data. Specifically, if we do not place bulk tissue immediately into RNA-later within 10 minutes, we cannot reliably detect eosinophil associated transcripts. However, flow cytometrically we recover from 0.5% to 5% of total cells fitting eosinophil profiles from polyps, and focused single-cell studies on granulocytes at the expense of the full ecosystem are possible and the topic of future work (data not shown). With the gentler tissue dissociation required for scrapings (Methods), we did recover a greater frequency of eosinophils from polyps in line with flow data (0.31% to 4.6% of cells; Extended Data Fig. 6d). We also did not find a distinct cluster of ILCs as they are around 0.01 to 0.1% of CD45 cells across the CRS spectrum per existing literature41 and extrapolating to the number of CD45 cells we
captured, we would have detected between 0.8 and 8 ILCs. To investigate further granularity present within cell types, such as T cells, myeloid cells, fibroblasts, endothelial cells, and epithelial cells, we subset these cells from the Seurat object and re-ran dimensionality reduction and clustering (Extended Data Figs. 3, 4 and 6). The process used for clustering and subset identification was adapted for each cell type to optimize the parameters of variable genes, principal components, and resolution of clusters desired. Canonical correlation analysis42 (CCA) was also performed to validate epithelial cell type classification across disease states (Extended Data Fig. 5; Supplementary Information). Differential Expression and Fractional Contribution of Gene Set to Transcriptome
To identify differentially expressed genes within cell types across non-polyp and polyp disease states, we utilized the ‘bimod’ setting in FindMarkers implemented in Seurat based on a likelihood ratio test designed for single-cell differential expression incorporating both a discrete and continuous component43. To determine the expression contribution to a cell’s transcriptome of a particular gene list, we summed the total log-normalized expression values for genes within a “list of interest” and divided by the total amount of log-normalized transcripts detected in that cell, giving the proportion of a cell’s transcriptome dedicated to producing those genes. For comparison of Wnt and Notch signaling, we z-scored the expression contribution metric and subtracted the value of Notch from Wnt yielding a metric centered on zero if both scores are equivalent, or weighted in the positive direction if enriched in Wnt. For reference gene lists used, including basal cell44, IFNα-, IFNγ-, IL-4-, IL-13-, IL-4/IL-13-induced genes45, Wnt and Notch please see Supplementary Table 4.
A
uthor Man
uscr
ipt
A
uthor Man
uscr
ipt
A
uthor Man
uscr
ipt
A
uthor Man
uscr
ipt
Simpson’s Index of Diversity, and Fibroblast Gene correlation with Basal Cell Frequency To measure the “richness” of the epithelial ecosystem46, we employed Simpson’s Index of Diversity (D), which we present as (1-D), and ranges between 0 and 1, with greater values indicating larger sample diversity47. We used Simpson’s Index to characterize the
composition of epithelial cells across basal, differentiating/secretory, glandular, and ciliated groupings in the non-polyp and polyp ethmoid sinus tissue ecosystems, as this metric accounts for both the number of distinct cell types present (e.g. species), and the evenness of the cellular composition across those cell types (e.g. relative abundance of species to each other). This measure takes into account the total number of members of a cell type, the number of cell types, and the total number of cells present. We calculate (1-D) for each sample. To determine genes correlated in specific cell types (e.g. fibroblasts) with the frequency of basal cells present in a cellular ecosystem, we correlated the average log-normalized single-cell count data for each gene to the rank of samples determined by increasing frequency of basal cells in each ecosystem (8.2% to 19.1% for non-polyp and 27.9% to 70.1% for polyp samples, Extended Data Fig. 7b).
Tissue and Sorted Basal Cell RNA-seq
Population RNA-seq was performed using a derivative of the Smart-Seq2 protocol for single cells48. In brief, tissue was collected directly into RNAlater (Qiagen) in the surgical suite and stored at −80°C until RNA isolation. RNA was isolated from 30 patients using phenol/ chloroform extraction and normalized to 5ng as the input amount for a 2.2X SPRI ratio cleanup using Agencourt RNAClean XP beads (Beckman Coulter, A63987). RNA-seq from sorted basal cells was done as a bulk population using Smart-Seq2 chemistry starting with a 2.2X SPRI ratio cleanup. After oligo-dT priming, Maxima H Minus Reverse Transcriptase (ThermoFisher EP0753) was utilized to synthesize cDNA with an elongation step at 52°C before PCR amplification (15 cycles for tissue, 18 cycles for sorted basal cells) using KAPA HiFi PCR Mastermix (Kapa Biosystems KK2602). Sequencing libraries were prepared using the Nextera XT DNA tagmentation kit (Illumina FC-131-1096) with 250pg input for each sample. Libraries were pooled post-Nextera and cleaned using Agencourt AMPure SPRI beads with successive 0.7X and 0.8X ratio SPRIs and sequenced with an Illumina 75 Cycle NextSeq500/550v2 kit (Illumina FC-404-2005) with loading density at 2.2pM, with paired end 35 cycle read structure. Tissue samples were sequenced at an average read depth of 7.98 million reads per sample and 3 samples not meeting quality thresholds were excluded from further analyses yielding 27 total useable samples. Sorted basal cell samples were sequenced at an average read depth of 21.15 million reads per sample and all samples met quality thresholds regarding genomic and transcriptomic alignment.
Tissue and Sorted Basal Cell RNA-seq Data Analysis
Tissue and sorted basal cell samples were aligned to the Hg19 genome and transcriptome using STAR49 and RSEM50. 3 samples were excluded for low transcriptome alignment (<25%), so we retained 27 samples for further analyses. Differential expression analysis was conducted using DESeq2 package for R51. Genes regarded as significantly differentially expressed were determined based on an adjusted p-value using the Benjamini-Hochberg procedure to correct for multiple comparisons with a false discovery rate <0.05. We
A
uthor Man
uscr
ipt
A
uthor Man
uscr
ipt
A
uthor Man
uscr
ipt
A
uthor Man
uscr
ipt
performed Ingenuity Pathway Analysis (IPA, Qiagen) through an instance available through the Broad Institute on the top 1,000 genes (all adjusted p<0.05) differentially expressed from our DESeq2 analysis, taking into account corresponding log-fold change for each gene. We also subset the tissue RNA-seq matrix based on genes found in Supplementary Table 3, which, from our single-cell marker discovery, were specific for basal, differentiating/ secretory, glandular, or ciliated cells. We then ran PCA and KNN clustering implemented in R over these genes in order to identify the greatest vectors of variance across samples within the epithelial cell compartment (Fig. 3f,g).
For re-analysis of published data, we used two publicly-available RNA-seq data sets: one profiling normal human olfactory mucosa and the other assessing differences in gene expression between healthy, non-eosinophilic nasal polyps and eosinophilic nasal polyps7,52,53 NB: analysis is done per sample and as such no comparisons across the data sets or samples are made.
Diffusion Pseudotime Mapping for Differentiation Analysis
Using diffusion pseudotime54 mapping, which seeks to provide the most likely
reconstruction for the developmental progression of a set of cells we built a trajectory for cells within basal and differentiating/secretory epithelial clusters (non-polyp clusters: 8-basal, 1-differentiating/secretory, 4-secretory; and polyp clusters: 12-8-basal, 2-8-basal, 0-differentiating/secretory; running several iterations starting from a random seed cell in cluster 8), over the combined basal and apical marker gene list (Fig. 4d; Extended Data Fig. 9a, Supplementary Table 3). By calculating a pseudotime trajectory for cells from both non-polyps and non-polyps together, we were then able to ask where cells from each disease state fall along a shared inferred temporal axis (Fig. 4d,e; Extended Data Fig. 9a). Diffusion
pseudotime54 was calculated using the scanpy python package ‘dpt’ function on log-normalized data for clusters 8, 1 and 4 (predominantly non-polyp, Supplementary Table 3) and 12, 2, and 0 (predominantly polyp, Supplementary Table 3) together. A random root cell was chosen from cluster 8, as this was the basal cell cluster representative of the non-polyp (e.g. less aberrant) state, and we also ran iterations with random root cells chosen from the entire set of clusters and it assigned cluster 8 as the cluster most enriched at the beginning of the diffusion map, regardless. Plots were created with the seaborn, matplotlib, and pandas packages. Pearson correlations were then calculated for all genes in all cells tested, or for all genes in non-polyp cells and all genes in polyp cells, relative to pseudotime (Extended Data Fig. 9b). Differential correlation testing was performed using the cocor package to identify significance for the difference between correlation coefficients using Fisher’s 1925 z-statistic, account for number of cells.
Epigenetic Profiling of Basal Cells using Omni-ATAC-seq
Accessible chromatin profiling55 using the Omni-ATAC-seq protocol as described in Corces et al56 was performed on basal cells stored in 100 μL BAMBanker freezing media from 12 patients (n=4 non-polyp (3 retained after data quality filtering) and n=8 polyp). Cells (ranging from 1,000 to 10,000) were thawed quickly in a 37°C rock bath and 900 μL of ice-cold PBS supplemented with Roche complete-Mini Protease inhibitor was added
immediately. Cells were split into two 1.5mL Eppendorf DNA lo-bind tubes to serve as
A
uthor Man
uscr
ipt
A
uthor Man
uscr
ipt
A
uthor Man
uscr
ipt
A
uthor Man
uscr
ipt
technical replicates. Cells were centrifuged at 500g for 5 minutes at 4°C, washed once in PBS with protease inhibitor, centrifuged at 500g for 5 minutes at 4°C and supernatant was removed completely using two separate pipetting steps with extreme caution taken to avoid resuspension (e.g. smooth and consistent aspiration). The transposition reaction consisted of 20 μL total volume of the following mixture (10 μL 2X TD Buffer, 1 or 0.5 μL TDEnzyme, 0.1 μL of 2% digitonin, 0.2 μL of 10% Tween 20, 0.2 μL of 10% NP40, 6.6 μL of 1X PBS and 2.3 μL of nuclease free water). We performed replicates with two distinct concentrations of TDE since, when dealing with minute clinical samples, flow sorting can sometimes give variable cell numbers, and the ratio of TDE to cells is critical in determining the frequency with which cuts are made in the genome. We optimized in pilot experiments that for basal cell inputs in the range of 500 to 10,000 cells, the aforementioned two ratios gave expected patterns of nucleosome banding in gels (data not shown). We performed two reactions and then later, during in silico analysis, pooled peaks together for downstream analysis. The cells were resuspended into the transposition mixture and incubated at 37°C for 30 minutes in an Eppendorf Thermomixer with agitation at 300rpm. Transposed DNA was purified using a Qiagen MinElute Reaction Cleanup Kit with elution in 15 μL. Libraries were constructed from 10 μL of DNA using a 50 μL total reaction volume of NEB HF 2X PCR Master Mix with custom Nextera N700 and N500 index primers to barcode samples (also used in Smart-Seq2 protocol). We performed 14 cycles of PCR amplification and SPRI purified at 1.8X ratio. Based on the molarity of each library, we adjusted the number of subsequent PCR cycles to either 3, 4 or 5 more for each sample. We then performed a 0.25X reverse SPRI to remove larger fragments followed by a 1.7X SPRI to purify libraries for sequencing. Libraries were sequenced on an Illumina NextSeq with paired end 38 cycle read structure at a loading density of 1.95pM.
Omni-ATAC-seq Data Analysis
Reads were aligned using bowtie2 using the following flags: “-S -p 1 -X 2000 --chunkmbs 1000” then bams were created using samtools view with the following flags: “samtools view -bS -F 4 –”. Duplicates were removed with picard. Forward reads were shifted 4bp and negative reads were shifted 5bp using a custom python script and the pysam package as is recommended for ATAC-seq data. Samples for each patient were merged using samtools merge and all patients were downsampled to 3 million reads using custom python scripts and ‘samtools view’ with the ‘-b’ and ‘-s’ flags. MACS2 ‘callpeak’ command was used to call peaks on each sample with flags ‘“-f BAMPE’-q 0.001 --nomodel --shift −100 --extsize 200 -B –broad’. Peaks from all samples were merged into one peakfile with bedtools and counts of reads per peak for each sample was generated with bedtools multicov. DESeq2 was run with the design ~polyp, testing for significant differences between polyp and non-polyp samples on this peak matrix and differential peaks with Benjamini-Hochberg adjusted p-value less than 0.01 with ‘greater’ or ‘less’ null hypotheses were used in downstream analysis. Homer2 was run for known motif finding on differential peaks with the set of all peaks as background57. To determine a false discovery rate, Homer2 was run on sets of random peaks chosen with replacement from the set of all peaks.
A
uthor Man
uscr
ipt
A
uthor Man
uscr
ipt
A
uthor Man
uscr
ipt
A
uthor Man
uscr
ipt
Epithelial Cell Culture
Tissues were digested as described above from either non-polyp or polyp surgical resections from the ethmoid sinus. 1,000,000 digested cells were added to a 25 cm2 tissue culture flask (Corning) pre-coated with 0.03 mg/mL Type I bovine collagen solution (StemCell
Technologies) and cultured in PneumaCult-Ex media (Stemcell Technologies, 05008). Media was changed every second day until cells reached confluence. Cells were subsequently frozen in 70% basal media with 20% FBS and 10% DMSO. Air-liquid Interface Cultures
For air-liquid interface (ALI) cultures58, 100,000 cultured epithelial cells per well were added to 0.4μm pore 24-well polyester membrane inserts (Corning) pre-coated with 0.03 mg/mL Type I bovine collagen solution (StemCell Technologies) with Pneumacult-Ex media (Stemcell Technologies, 05008) on both sides of the membrane. After 24 hours, apical media was changed to remove dead cells. After 72 hours, apical media was removed completely and basal media was changed to Pneumacult-ALI (Stemcell Technologies, 05001) supplemented with 5 mL 100x penicillin-streptomycin (Fisher), 1 mL 500x gentamicin/amphotericin B (ThermoFisher), 1 mL 0.2% heparin sodium salt in PBS (Stemcell Technologies) and 2.5 mL 200x hydrocortisone stock solution (Stemcell
Technologies) and 0, 0.1, 1 or 10 ng/mL IL-13 (Biolegend). Basal media was changed every 2–3 days for 21 days, after which membranes were removed and cells dissociated with Stempro Accutase Cell Dissociateion Reagent (Gibco) for Seq-Well or flow cytometry. After following scRNA-seq data analysis pipelines described above, cell states recovered in ALI cultures (Fig. 5a; Extended Data Fig. 9g) were related to in vivo cell types59.
Basal Cell Stimulation
Basal cells from non-polyp or polyp surgical resections from ethmoid sinus were placed into epithelial cell culture (e.g. “lateral expansion” in the absence of differentiation, see above, inspired by experiments in microglia60), passaged, and 10,000 cells seeded at passage 5 (e.g. 5 weeks ex vivo) and cultured at confluence in 96 well flat-bottom collagen-coated tissue culture plates (Corning, 3799) for 48 hours in Pneumacult-Ex serum-free media (Stemcell Technologies, 05008). Cytokines were added for 12 hours overnight at increasing doses (0, 0.1, 1, 10 ng/mL) of IL-4 (Biolegend 766205), IL-13 (Biolegend 571104), and (0.1, ng/mL) IL-4+IL-13 in combination (n=32 samples non-polyp and n=32 samples polyp basal cells over all conditions, each condition run as a biological duplicate, and a technical duplicate therein) before lysis using RLT + 1% BME (Qiagen and Sigma, respectively). Bulk RNA-seq was performed as described for sorted basal cells starting from lysates. Basal cell stimulation samples were sequenced at an average read depth of 3 million reads per sample and all samples met quality thresholds regarding genomic and transcriptomic alignment. Statistical Analyses
Number of samples included in analyses are listed throughout figure legends and all represent distinct biological samples. The same surgeon performed surgeries on all individuals and was blinded to study design. The same allergist/immunologist performed nasal scrapings on all samples and was blinded to study design. Quantification of
A
uthor Man
uscr
ipt
A
uthor Man
uscr
ipt
A
uthor Man
uscr
ipt
A
uthor Man
uscr
ipt
histological sections was performed in a blinded fashion. No samples or cells meeting quality thresholds were excluded from analyses. Where single-cell data was analyzed on a gene-level, the statistics were performed over the number of cells. Statistical analyses were performed using GraphPad Prism v7.0a, Seurat 1.4.0.1 implemented in RStudio, DESeq2 1.10.1 package implemented in RStudio, and Ingenuity Pathway Analysis run through the Broad Institute, and macs2, DESeq2 and Homer2 for Omni-ATAC-Seq. All violin plots were generated using standard Seurat code without modification to smoothing or density. Violin density only generated when >25% of cells in indicated sample have non-zero measurement for gene, widest aspect represents centre of positive measures, minima and maxima are represented within the scale with minima at 0 and maxima encompassing all points for the count-based expression level (log(scaled UMI+1)) of each gene. Exact values for all genes displayed and tested available in Supplementary Table 3 organized by panel. All violin plots contain at minimum 100 individual cells in any one cluster (Supplementary Table 3 for precise numbers of cells per cluster and type, most are included in figure legends where space allows), and have points suppressed for ease of legibility. Some violin plots with less than 100 cells have individual data points displayed and corresponding statistical metrics are available in accompanying figure legend and Supplementary Table 3. As some scores followed non-normal distributions as tested for using a Lilliefors normality test, we utilized a Mann-Whitney U-test where indicated for determining statistical significance. For scores in single-cell data, we report effect sizes in addition to statistical significance as an
additional metric for the magnitude of the effect observed. The calculation was performed as Cohen’s d where: effect size d = (Mean1-Mean2)/(S.D. pooled). Unpaired two-tailed t-tests
for direct comparisons and t-test with Holm-Sidak correction, Bonferroni correction, or Benjamini-Hochberg for multiple comparisons, depending on software package used, where appropriate. Mann-Whitney U-test for quantification of histological data due to
non-normally distributed data. Pearson correlation thresholds were determined as significant through determination of asymptotic p-values through use of rcorr function in Hmisc, but exact corrected p-values by Holm-Sidak method for multiple comparisons are calculated for those highlighted in text using RcmdrMisc package. Comparison of Pearson correlation coefficients in pseudotime analyses was done using Fisher’s 1925 z-statistic accounting for the number of cells.
Data Availability Statement
The cells-by-genes matrix generated from ethmoid sinus surgical resections and analyzed during the current study is available along with the manuscript as Supplementary Table 2 along with R code for standard implementation of Seurat. A cells-by-genes matrix from inferior turbinate and polyp scraping data is also available as Supplementary Table 6. Dupilumab treatment cells-by-genes matrices as Supplementary Tables 7 and 8. A metadata table encompassing all scRNA-seq samples is provided as Supplementary Table 9. The count and TPM matrices and associated metadata from bulk tissue RNA-seq are available as Supplementary Tables 10, 11, and 12. FASTQ file format data will be available through dbGaP under accession number XXXX. Marker gene lists for cell types identified in Fig. 1a,b, and from resultant analyses in Fig. 2b, for frequencies of cell clusters and types in Fig. 2c, for cell types identified in Fig. 2e, Fig. 2f, Fig. 3g, Fig. 5a, Fig. 5e, Extended Data Fig. 3a,b,c, Extended Data Fig. 4c, Extended Data Fig. 5e, Extended Data Fig. 6b,d, Extended
A
uthor Man
uscr
ipt
A
uthor Man
uscr
ipt
A
uthor Man
uscr
ipt
A
uthor Man
uscr
ipt
Data Fig. 10a, selected comparisons of differential expression in Fig. 2d, Fig. 4a, Fig. 5c, Fig. 5f, Extended Data Fig. 2c, Extended Data Fig. 10h, and pseudotime correlation Extended Data Fig. 9b, are available as tabs in Supplementary Table 3. Differential peak calling from epigenetic profiling available in Supplementary Table 5. Additional R code for analyses available on http://shaleklab.com/resources/.
Extended Data
Extended Data Figure 1 |. Consistency of cell capture and identification in surgical EthSin scRNA-seq patient cohort
(a) Number of unique molecular identifiers (nUMI) and genes identified, and fraction of reads mapping to mitochondrial or ribosomal genes across recovered cell types; 3,222 basal cells, 4,362 apical cells, 2,192 glandular cells, 498 ciliated cells, 835 T cells, 2,976 plasma cells, 1,724 fibroblasts, 1,143 endothelial cells, 811 myeloid cells, 273 mast cells.
A
uthor Man
uscr
ipt
A
uthor Man
uscr
ipt
A
uthor Man
uscr
ipt
A
uthor Man
uscr
ipt
(b) nUMI and genes identified, and fraction of reads mapping to mitochondrial or ribosomal genes across patient samples; 789 Polyp 1 cells, 1,309 Polyp 2 cells, 1,153 Polyp 3 cells, 913 Polyp 4 cells, 1,219 Polyp 5 cells, 1,141 Polyp 6A cells, 1,334 Polyp 6B cells, 1,314 Polyp 7 cells, 1,286 Polyp 8 cells, 1,481 Polyp 9 cells, 2,988 Polyp 11 cells, 3,109 Polyp 12 cells.
(c) tSNE plot as in Fig. 1b colored by cell types across all patients and then separated by sample; 18,036 single cells (n=12 samples).
(d) The percentage of each cell type recovered within each sample.
(e) Select marker gene overlays displaying binned count-based UMI-collapsed expression level (log(scaled UMI+1)) on a tSNE plot from Fig. 1b for key cell types identified (see Supplementary Table 3 for full gene lists); area under the curve (AUC) 0.998 to 0.7 for all markers displayed.
A
uthor Man
uscr
ipt
A
uthor Man
uscr
ipt
A
uthor Man
uscr
ipt
A
uthor Man
uscr
ipt
Extended Data Figure 2 |. Top marker genes for cell types by scseq and bulk tissue RNA-seq from EthSin recovers expected T2I and eosinophilic modules
(a) Row-normalized heatmap of the top-10 marker genes identified by ROC-test (AUC>0.73 for all) over all cell types (Fig. 1b,c) with select genes displayed on y-axis and cells on x-axis (see Supplementary Table 3 for full gene lists); maximum 500 cells/type.
(b) An overlay of CLC displaying binned count-based expression level (log(scaled UMI+1)) amongst myeloid cells (a pathognomonic gene for eosinophils); 811 myeloid cells from n=12 samples.
(c) A row-normalized and row-clustered heatmap over the top 100 positively and negatively differentially-expressed genes (50 in each direction) in bulk tissue RNA-seq of 27 samples from non-polyp (n=10) and polyp (n=17) tissue with select genes displayed; DESeq2 Wald Test, all p<9.03×10⁻⁵ for genes displayed, corrected for multiple comparisons by Benjamini procedure, samples ordered as in Fig. 3g, (see Supplementary Table 3 for full gene list and associated statistics).
(d) The top differentially regulated pathways identified by Ingenuity Pathway Analysis (see Methods) over the top 1,000 differentially expressed genes, as determined by p<0.05 corrected for multiple comparisons by Benjamini procedure, across polyp and non-polyp tissue.
(e) Predicted upstream regulators based on differentially expressed gene modules in polyp tissue relative to non-polyp determined using Ingenuity Pathway Analysis (see Methods).
A
uthor Man
uscr
ipt
A
uthor Man
uscr
ipt
A
uthor Man
uscr
ipt
A
uthor Man
uscr
ipt
Extended Data Figure 3 |. Sub-clustering of myeloid, fibroblast and endothelial cell types from the EthSin T2I inflammatory ecosystem
(a) tSNE plot of 811 myeloid cells (n=6 non-polyp, n=6 polyp samples), colored by clusters identified through shared nearest neighbor (SNN) analysis (Supplementary Table 3;
Methods), from CRS-EthSin; select marker gene overlays displaying count-based (unique molecular identifier (UMI) collapsed) expression level (log(scaled UMI+1)) on a tSNE plot (see Supplementary Table 3 for full gene lists; genes identified via ROC test with AUC 0.689 for S100A8, 0.763 for CD1C, 0.927 for C1QC); a clustered correlation matrix of marker genes identified in single-cell data from myeloid cells; and violin plots for the expression value (log(scaled UMI+1)) of selected markers of myeloid activation state. (b) tSNE plot of 1,724 fibroblasts (n=6 non-polyp, n=6 polyp samples), colored by clusters identified through shared nearest neighbor (SNN) analysis (Supplementary Table 3; Methods), from CRS-EthSin; select marker gene overlays displaying count-based (unique molecular identifier (UMI) collapsed) expression level (log(scaled UMI+1)) on a tSNE plot