Cotargeting among microRNAs in the brain
The MIT Faculty has made this article openly available.
Please share
how this access benefits you. Your story matters.
Citation
Cherone, Jennifer M. et al. "Cotargeting among microRNAs in the
brain." Genome Research 29, 11 (October 2019): 1791-1804 © 2019
Cherone et al
As Published
http://dx.doi.org/10.1101/gr.249201.119
Publisher
Cold Spring Harbor Laboratory
Version
Final published version
Citable link
https://hdl.handle.net/1721.1/126145
Terms of Use
Creative Commons Attribution NonCommercial License 4.0
Cotargeting among microRNAs in the brain
Jennifer M. Cherone,
1Vjola Jorgji,
2and Christopher B. Burge
11
Department of Biology, Massachusetts Institute of Technology, Cambridge, Massachusetts 02139, USA;
2Department of Biology,
Wellesley College, Wellesley, Massachusetts 02481, USA
MicroRNAs (miRNAs) play roles in diverse developmental and disease processes. Distinct miRNAs have hundreds to
thou-sands of conserved mRNA binding sites but typically direct only modest repression via single sites. Cotargeting of
individ-ual mRNAs by different miRNAs could potentially achieve stronger and more complex patterns of repression. By
comparing target sets of different miRNAs, we identified hundreds of pairs of miRNAs that share more mRNA targets
than expected (often by twofold or more) relative to stringent controls. Genetic perturbations revealed a functional overlap
in neuronal differentiation for the cotargeting pair miR-138/miR-137. Clustering of all cotargeting pairs revealed a group of
nine predominantly brain-enriched miRNAs that share many targets. In reporter assays, subsets of these miRNAs together
repressed gene expression by five- to 10-fold, often showing cooperative repression. Together, our results uncover an
un-expected pattern in which combinations of miRNAs collaborate to robustly repress cotargets, and suggest important
devel-opmental roles for cotargeting.
[Supplemental material is available for this article.]
MicroRNAs (miRNAs) are 21- to 23-nt noncoding RNAs that spec-ify the repression of target mRNAs by the RNA-induced silencing complex (RISC), predominantly via recognition of a short comple-mentary sequence matching the miRNA seed (Lewis et al. 2003; Bartel 2018). miRNAs regulate a broad set of cellular processes, in-cluding differentiation and development, and are misregulated in many diseases (Mendell and Olson 2012; Bartel 2018). However, genetic studies have found that individual miRNAs are often not essential for viability or development (Miska et al. 2007), and their regulatory roles are often difficult to detect, requiring knockout of multiple family members (Alvarez-Saavedra and Horvitz 2010) and/or environmental perturbations (van Rooij et al. 2007; Zheng et al. 2011) and leaving an incomplete picture of the func-tional roles of most miRNAs.Each conserved miRNA typically has hundreds of target genes or more that are conserved across mammals, together encom-passing at least 60% of mammalian mRNAs, as well as additional nonconserved targets (Friedman et al. 2008). However, miRNAs typically elicit modest effects on any given target, often repressing expression by <20% (Baek et al. 2008; Selbach et al. 2008). The evo-lutionary logic for having so many conserved targets but repressing each one so modestly is not well understood. Because some genes contain several conserved miRNA sites, stronger repression may re-sult when multiple sites are active. For example, five target sites that individually repress an mRNA to 80% of its prior level could togeth-er repress expression to (0.8)5=∼33% of its prior level in principle, because repression by multiple sites appears to be multiplicative (often described as“log-additive”) (Grimson et al. 2007; Nielsen et al. 2007). Cooperativity between closely spaced miRNA sites, with a distance of∼15–35 nt between seed starts, can further boost the repression exerted by a pair of sites (Doench and Sharp 2004; Grimson et al. 2007; Sætrom et al. 2007). Although a transcript may contain and be regulated by multiple sites for the same miRNA (Lee et al. 1993; Wightman et al. 1993; Reinhart et al. 2000; Mayr et al. 2007), only 7% of genes containing at least one
conserved miRNA site have more than one conserved site for the same miRNA family (Friedman et al. 2008). In contrast, 72% of predicted targets have sites for multiple miRNA families, with an average of more than four highly conserved sites per targeted 3′ UTR (Friedman et al. 2008). Thus, there is far more potential for coregulation of mRNAs by multiple miRNAs with distinct seed sequences than for multiple targeting by the same miRNA.
It has been proposed that individual mRNAs are often regulat-ed by more than one miRNA and that combinations of miRNAs collaborate in repression of specific targets (Krek et al. 2005; Friedman and Burge 2014), but few studies have explored this no-tion or identified specific examples of coregulano-tion. When predict-ed target sites across a single 3′UTR have been comprehensively tested in reporter assays, only a subset of these sites were found to be functional (Jiang et al. 2009; Wu et al. 2010). Moderate— less than twofold—repression has been observed for sites to multi-ple distinct miRNAs in the same natural 3′UTR (Krek et al. 2005; Grimson et al. 2007; Sætrom et al. 2007), although up to fourfold repression by three miRNA sites was observed for viral transcripts regulated by a combination of viral and host miRNAs (Riley et al. 2012). Thus, the presence of cognate sites in a 3′UTR and expres-sion of the corresponding miRNAs in the same cell are necessary but not sufficient conditions for effective repression of an mRNA by multiple distinct miRNAs, termed“cotargeting.”
Although the potential for genome-wide cotargeting has been explored only rarely, some miRNAs appear to function to-gether. Indeed, miRNAs that are expressed from the same polycis-tronic cluster, and thus are generally coexpressed, have predicted target sets that partially overlap and are enriched for components of the same pathways (Tsang et al. 2010). In addition, coexpression networks of miRNA targets have been used to find miRNAs that regulate similar pathways (Gennarino et al. 2012). In another study, enrichment for coconservation of target sites was observed between particular pairs of miRNAs (Obermayer and Levine 2014).
Corresponding author: [email protected]
Article published online before print. Article, supplemental material, and publi-cation date are at http://www.genome.org/cgi/doi/10.1101/gr.249201.119.
© 2019 Cherone et al. This article is distributed exclusively by Cold Spring Harbor Laboratory Press for the first six months after the full-issue publication date (see http://genome.cshlp.org/site/misc/terms.xhtml). After six months, it is available under a Creative Commons License (Attribution-NonCommercial 4.0 International), as described at http://creativecommons.org/licenses/by-nc/4.0/.
Together, these studies and others mentioned below suggest that different miRNAs may often function together. We hypothesized that pairs and groups of miRNAs that preferentially share many targets may function together in differentiation and development to strongly repress critical targets and reinforce each other’s activ-ity. We explored this hypothesis through genome-wide analyses, in-depth characterization of one of the identified miRNA pairs, and assessment of the ability of groups of miRNAs to strongly re-press shared targets.
Results
Cotargeting by distinct miRNA pairs is prevalent
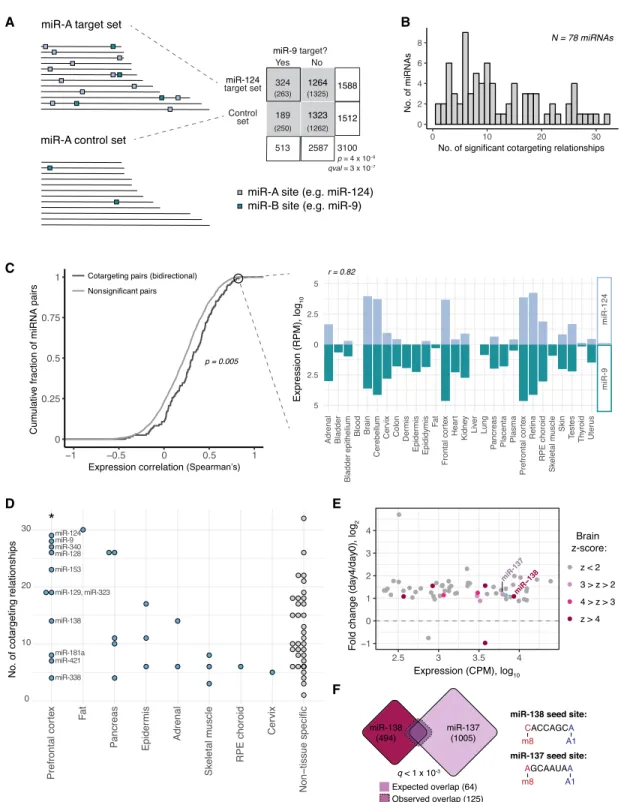
To explore the idea that pairs of miRNAs often function together, we compared the target sets of different miRNA pairs with unrelat-ed seunrelat-ed sequences to see if they sharunrelat-ed more targets than expectunrelat-ed by chance. We performed this analysis on a filtered set of 78 con-served miRNAs, with distinct, nonoverlapping seed sequences and at least 300 conserved targets (considering the canonical 8mer, 7-mer-m8, and 7-mer-A1 target classes) (Lewis et al. 2005; Agarwal et al. 2015), excluding cases in which 7-mer seed sequenc-es overlapped by six or more bassequenc-es. This filtering of the miRNA set is more stringent than that used by most previous approaches in order to ensure that all seed matches contributing to the signal arose independently. To control for biases that may exist within a given miRNA’s target set, custom control gene sets were designed for each miRNA, matching the distributions of 3′UTR length, G + C content, and mean sequence conservation of the miRNA’s con-served targets. Each of the 78 miRNA target sets was intersected with the target set of every other miRNA and its corresponding control set. Significance of the observed overlap was assessed by the chi-square test and corrected for multiple hypothesis testing by computing the false-discovery rate (FDR) using the q-value method (Storey and Tibshirani 2003). Because the control set for each miRNA is different, comparing miRNA-A to miRNA-B (A→ B) and comparing miRNA-B to miRNA-A (B→ A) may yield signifi-cance in one direction only or in both (Fig. 1A).
We observed 482 significant cotargeting relationships after applying an FDR-adjusted q-value cutoff of 0.05, with each miRNA having an average of 10 cotargeting relationships (Fig. 1B). Of these relationships, 270 (56%) were significant in both di-rections (Supplemental Table S1). Coordinated roles in specific bi-ological processes have been identified for certain cotargeting pairs in our analysis (Krichevsky et al. 2006; Yoo et al. 2011; Santos et al. 2016; Cursons et al. 2018). For example, the bidirectional cotarget-ing pair miR-9/miR-124 can together, but not alone, drive neuro-nal differentiation in vitro from embryonic stem cells (ESCs) and fibroblasts (Krichevsky et al. 2006; Yoo et al. 2011). The cotarget-ing trio of miR-124, miR-128, and miR-137 can synergistically reg-ulate Sp1 (Santos et al. 2016), and the bidirectional cotargeting pair miR-200b and miR-182 cooperate in driving epithelial–mes-enchymal transition (Cursons et al. 2018).
To assess the expression of cotargeting pairs of miRNAs gener-ally, we analyzed miRNA expression in a small RNA deep-sequenc-ing study across a set of 28 human tissues from McCall et al. (2017). We observed that bidirectional cotargeting pairs were significantly more correlated in their expression across this set of tissues than nonsignificant pairs (P = 5 × 10⁻³, Kolmogorov–Smirnov test) (Fig. 1C). For instance, the highly significant cotargeting miRNAs miR-124 and miR-9 had strongly correlated expression patterns (RSpearman= 0.82, P = 7 × 10⁻⁸). This observation suggests that
evolu-tion or maintenance of shared targeting occurs preferentially for miRNAs with similar expression patterns.
We wondered whether the extent of cotargeting might vary between different tissues. By considering miRNA expression across the same panel of human tissues (McCall et al. 2017), we calculat-ed a Z-score (standard deviation) of expression across tissues and considered miRNAs with Z≥ 4 in any one tissue as strongly en-riched in that tissue and others as non-tissue-specific. This analysis revealed that miRNAs enriched in prefrontal cortex had more cotargeting partners than those enriched in other tissues (Fig. 1D), suggesting that cotargeting might have a particularly promi-nent role in the brain.
The cotargeting miRNAs miR-138 and miR-137 coordinately
increase across neuronal differentiation
To explore the functional relevance of cotargeting miRNA pairs, we chose one pair to study in depth. By considering Figure 1D, we sought to identify a pair of brain-enriched cotargeting miRNAs in which both are induced in neuronal differentiation. We performed small RNA sequencing in a murine cell culture mod-el of neuronal differentiation, Cath.-a-differentiated (CAD) cmod-ells (Qi et al. 1997). We used serum withdrawal to induce neuronal dif-ferentiation and collected RNA at 0 and 4 d after serum withdrawal. In all, 57 mammalian-conserved miRNAs increased significantly across the differentiation, including nine that were at least moder-ately brain-enriched (Z-score > 2 in prefrontal cortex) (Fig. 1E;
Supplemental Table S2). miR-138/miR-137 was the only bidirec-tional cotargeting pair in which both members were brain-en-riched and increased over CAD differentiation, both increasing more than twofold. miR-137 was one of the most significant cotar-geting partners with miR-138, sharing 125 targets, about 1.9 times more than expected (qval < 1 × 10⁻³) (Fig. 1F), and had an expres-sion level close to (within 25%) that of miR-138. We validated our results in CAD cells by qPCR and confirmed that miR-137 and miR-138 are also induced in differentiation of glutamatergic neurons from mouse ESCs (Supplemental Fig. S1A–C). These ex-pression patterns and the extensive cotargeting potential (despite unrelated seed sequences) suggested that miR-138 and miR-137 may function together during CAD cell differentiation.
miR-138 is required for the differentiation of CAD cells
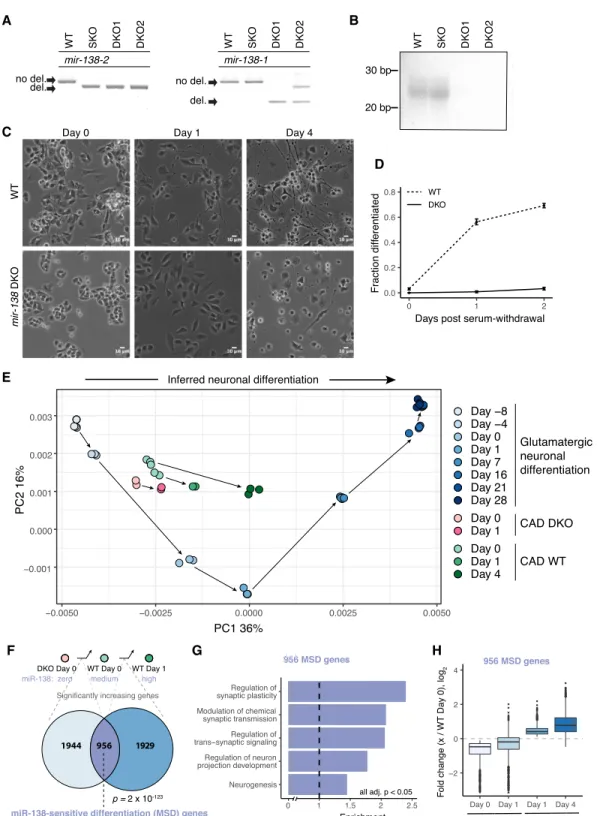
Murine miR-138 is encoded by two distinct genomic loci, Mir138-1 (also known as mir-138-1) and Mir138-2 (also known as mmu-mir-138-2), located on Chromosomes 8 and 9, whereas miR-137 is expressed from a single locus on Chromosome 3. Henceforth, miRNAs are referred to using miRBase nomenclature without the species-designating prefix. To explore the functions of miR-138 and miR-137 in neuronal differentiation, we generated mir-137 knockout (KO) and mir-138-1/mir-138-2 double-knockout (DKO) CAD cell lines by deleting the entire precursor miRNA sequence us-ing CRISPR/Cas9. These deletions were confirmed by genomic PCR (Fig. 2A), and absence of expression was confirmed by north-ern blot and TaqMan qRT-PCR (Fig. 2B;Supplemental Fig. S2A,B). Wild-type (WT) CAD cells enter a differentiation program within 24 h after serum withdrawal as indicated by extensive neu-rite growth (Fig. 2C,D) and expression of key neuronal markers like tubulin, beta 3 class III and SNAP25 (Qi et al. 1997). mir-138 DKO cells no longer projected neurites upon serum withdrawal, which we observed in two separately isolated mir-138 DKO cell lines (Fig. 2C,D), suggesting an important role for this miRNA in
Cherone et al.
A
C
D
E
F
B
Figure 1. Cotargeting by distinct miRNA pairs is prevalent, particularly among brain-specific miRNAs. (A) Our statistical test for cotargeting between a pair of miRNAs is illustrated. Control sets are made for the reference miRNA (miR-A) that match the distribution of 3′UTR length, C + G content, and se-quence conservation of miR-A’s TargetScan 7-mer and 8mer targets. The number of conserved 7-mer and 8mer sites for a second miRNA (miR-B; teal boxes) in miR-A targets (miR-A sites marked by light blue boxes) and in miR-A’s control set are counted, and significance is determined by chi-square test. Target set overlaps are shown in a contingency table (expected values in parentheses) for miR-9 compared with miR-124 and its control set. (B) The tally of miRNAs with given numbers of significant cotargeting relationships (with qval < 0.05). (C ) Cumulative distributions of Spearman’s correlation of miRNA expression across a set of 28 human tissues for bidirectional cotargeting pairs (dark gray) or nonsignificant pairs (light gray; P = 5 × 10⁻³, Kolmogorov-Smirnov test). Correlation of expression of miR-124 and miR-9 across human tissues (Spearman’s ρ = 0.82). (D) Number of cotargeting relationships for strongly tissue-specific miRNAs, grouped by tissue of strongest enrichment, for tissues with one or more assigned miRNA. (∗) P < 0.05 (Wilcoxon rank-sum test), compared with non-tissue-specific miRNAs or miRNAs specific to other tissues. (E) Fold change in expression (normalized counts per million [CPM]) of significantly changing miRNAs in CAD cell differentiation after serum withdrawal. Circles colored by prefrontal cortex Z-score. Blue line connects bidirectional cotarget-ing pairs among the brain-enriched miRNAs. (F) Overlap of miR-138 (red) and miR-137 (purple) predicted target sets. Dashed line shows the observed overlap relative to the expected overlap (solid line). The q-value shown is the geometric mean of the q-values from the miR-138→ 137 and miR-137→ miR-138 comparisons. Seed sequences for each miRNA are shown at right. See alsoSupplemental Figure S1andSupplemental Table S1.
A
C
E
F
G
H
D
B
Figure 2. miR-138 is required for differentiation of CAD cells. (A) PCR of genomic DNA around the CRISPR-targeted sites of the two murine mir-138 loci, confirming deletion of both loci. Wild-type parental line (WT), SKO, and two DKO lines (DKO1 and DKO2) are shown. (B) Northern blot for miR-138 in the WT, SKO, DKO1, and DKO2 cell lines. (C ) WT and DKO cells at 0, 1, and 4 d after serum withdrawal (10× magnification; scale bar indicates 10 µm); (D) quantitation of fraction of cells morphologically differentiated (Methods). The mean ± SD of three replicates with at least 100 cell counts each is shown. (E) PCA of RNA-seq data from eight time points of murine glutamatergic neuronal differentiation (shades of blue). RNA-seq data from CAD WT (0, 1, and 4 d after serum withdrawal; shades of green) and DKO cells (0 and 1 d after serum withdrawal; pink), projected onto PC1 and PC2 of the glutamatergic dif-ferentiation data. Arrows connect consecutive samples in each time series. The two sets of WT day 0 cells correspond to independent RNA-seq library preps and sequencing runs, as the day 0 and day 4 WT cells were sequenced in independent experiments. (F) Comparison of gene sets significantly increasing between DKO day 0 and WT day 0, and between WT day 0 and WT day 1. Significance of the 956 gene overlap (defined as MSD genes) was determined by chi-square test. (G) Gene Ontology enrichment of MSD genes against a background of genes significantly increasing in either DKO day 0 to WT day 0 or WT day 0 to WT day 1, with FDR-corrected P < 0.05 for all categories shown. (H) Fold change (log2) of the 956 MSD genes from WT day 0 to DKO day 0, DKO
day 1, WT day 1, and WT day 4. See alsoSupplemental Figure S2andSupplemental Tables S1 and S3.
Cherone et al.
differentiation. The mir-137 KO cell line displayed no severe mor-phological changes (Supplemental Fig. S2C).
To determine whether loss of neurite growth resulted from loss of miR-138, we asked whether reintroducing miR-138 could rescue the phenotype. Transfecting mir-138 DKO cells with miR-138 mimic RNA followed by serum withdrawal 2 d later (Fig. 3A) substantially rescued the phenotype, with 51% of cells differentiat-ed 2 d after serum withdrawal (Fig. 3B,C). This observation con-firms that the DKO phenotype results from loss of miR-138 activity. To further characterize the mir-138 DKO cell line, we per-formed standard RNA-seq on WT and DKO cells in serum and 24 h after serum withdrawal. Analysis of gene expression changes in-dicated that predicted miR-138 target genes were significantly de-repressed in the mir-138 DKO cell line, as expected (Supplemental Fig. S2D). To better understand the differentiation state of these cells, we analyzed gene expression data from an established in vitro system involving differentiation of mESCs to mature glutamater-gic neurons (Hubbard et al. 2013), using principal component analysis (PCA) to define a coordinate system (Fig. 2E). Cells at dif-ferent stages fell along PC1 in chronological order from mESCs (day–8) at far left to mature glutamatergic neurons (day 28) at far right, indicating that PC1 reflects neuronal differentiation sta-tus. When the CAD RNA-seq data were projected onto this coordi-nate system, WT CAD cells moved rightward along PC1 after serum withdrawal, consistent with CAD cells as a model for neuro-nal differentiation. However, the DKO samples projected slightly left of the WT samples and moved a shorter distance to the right following serum withdrawal, suggesting that loss of mir-138 causes partial dedifferentiation and impairs cells’ ability to differentiate upon stimulus (Fig. 2E).
Consistent with dedifferentiation, many genes that increase across normal differentiation, including several well-established neuronal markers, had reduced expression in DKO cells (Supplemental Fig. S2E). In fact, there was a highly significant overlap of 956 genes between genes that increased significantly across WT CAD differentiation (WT day 0→ WT day 1) and genes that increased between DKO and WT cells (DKO day 0→ WT day 0) (P = 2 × 10−123, hypergeometric test) (Fig. 2F). Gene Ontology anal-ysis of the overlapping genes compared with genes changing in ei-ther comparison revealed significant enrichment for categories related to synapse function and neuron projection (Fig. 2G), so we call this set “miR-138-sensitive differentiation-enriched” (MSD) genes. In DKO cell differentiation, 85% of MSD genes (815 genes) failed to increase significantly above expression levels observed in the WT cells in serum, and 52% of MSD genes (498 genes) remained significantly lower than levels observed in WT cells in serum (Fig. 2H). These observations support the idea that loss of miR-138 results in a state that is both dedifferentiated and less poised for neuronal differentiation.
In all, 177 predicted miR-138 target genes were derepressed in the DKO cells in either serum or serum-free conditions, of which 36% (64) significantly decreased across normal CAD differentia-tion, during which miR-138 is induced (Supplemental Table S3). This list contained several key neuronal differentiation-associated genes, including Ezh2, and REST-associated Ctdsp1 and Sin3a (Huang et al. 1999; Pereira et al. 2010; Nesti et al. 2014).
miR-137 can rescue a block in neuronal differentiation caused by
loss of
mir-138
The significant potential for cotargeting between miR-137 and miR-138 (Fig. 1F) motivated us to transfect mir-138 DKO cells
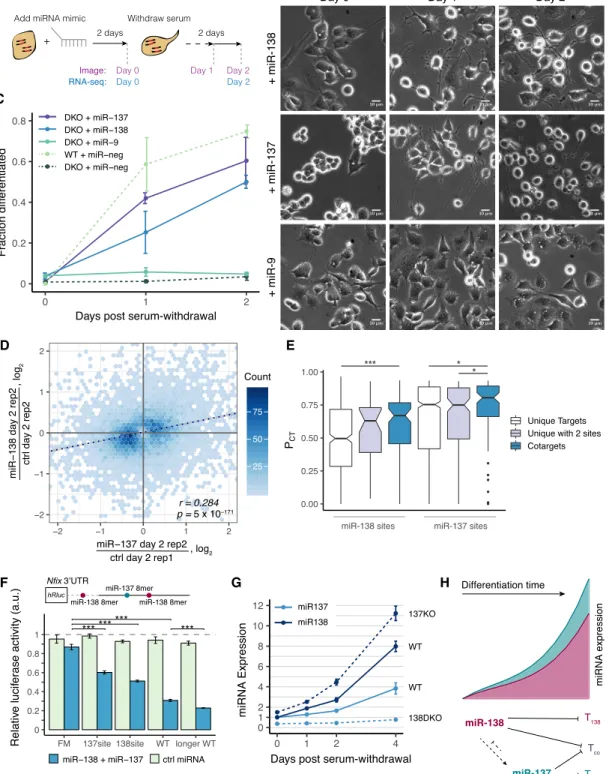
with miR-137 mimic. Within 1 d after serum withdrawal, 42% of mir-138 DKO cells transfected with miR-137 were morphologically differentiated, and by 2 d after serum withdrawal, 60% of cells had differentiated. In contrast, other miRNA mimics tested, including neuronal miRNAs miR-9, miR-128, and miR-7 and muscle miRNA miR-1, failed to detectably increase morphological differentiation (Fig. 3B,C;Supplemental Fig. S3A). Thus, these rescue experiments established a functional relationship in neuronal differentiation between the cotargeting pair miR-138/miR-137.
By assessing transcriptome changes following transfection of miR-138 and miR-137 (Fig. 3A), we observed clear repression of predicted targets of each miRNA (Supplemental Fig. S3B,C), show-ing effective delivery and activity of these mimics. We also ob-served a significant correlation in expression changes (RSpearman=
0.28, P = 5 × 10−171) between the miR-138 and miR-137 rescues 2 d after serum withdrawal when normalized to control cells at the same time point (Fig. 3D). Thus, rescue of the phenotype by these miRNAs may result from regulation of the same or related path-ways. Genes induced in both rescues were enriched for functional categories including cell projection assembly, positive regulation of neuron projection development, and microtubule-based move-ment, all terms associated with differentiation and the develop-ment of neurites, whereas genes repressed in both were enriched in categories related to proliferation (Supplemental Fig. S3D). These observations are consistent with a model in which both miR-138 and miR-137 can trigger a similar neuronal differentia-tion program that involves slowing of the cell cycle and inducdifferentia-tion of neuritogenesis.
Overall, 55% (58) of expressed predicted cotargets of miR-137 and miR-138 were significantly repressed in both the miR-137 and miR-138 transfections, supporting a substantial degree of cotarget-ing in this system (Supplemental Table S4). miR-138 and miR-137 sites in transcripts cotargeted by both miRNAs had higher “proba-bility of conserved targeting” (PCT) scores (Fig. 3E), indicating
stronger constraint on function (Friedman et al. 2008).
We sought to assess targeting of two predicted cotargets with important neuronal regulatory functions, Nfix (Mason et al. 2009) and Ezh2 (Pereira et al. 2010), using luciferase assays. The Nfix 3′ UTR contains one miR-137 and three miR-138 seed sites and was repressed in both rescues. By using a standard dual luciferase re-porter assay, the miR-137 and miR-138 sites conferred 33% and 40% repression, respectively, and 64% repression when together (Fig. 3F), confirming cotargeting of this mRNA. Ezh2 was detect-ably repressed in the miR-138 but not the miR-137 rescue but is a previously validated miR-137 target and impacts differentiation (Szulwach et al. 2010). By using the same assay, we observed 17% and 33% repression of an Ezh2 reporter by miR-137 and miR-138, respectively, with 42% combined repression, consistent with the expected log-additive relationship (Supplemental Fig. S3E). Thus, both Nfix and Ezh2 were validated as cotargets of miR-138 and miR-137.
Given their functional relationship, we asked whether miR-138 and miR-137 regulate each other’s expression. We observed that the expression of miR-137 is 2.7-fold lower in the mir-138 DKO cells and fails to increase in DKO cells following serum with-drawal (Fig. 3G), suggesting that reduction of miR-137 levels might contribute to the phenotype of these cells. The loss of miR-137 in-duction in mir-138 DKO cells could result either from failure to re-press a specific negative regulator of mir-137—for example, knockdown of Rest and Ezh2 resulted in elevated levels of miR-137 (Supplemental Fig. S3F,G)—or from the impaired
1.5-A
C
D
F
G
H
E
B
Figure 3. Both miR-138 and cotargeting partner miR-137 can rescue the neurite growth phenotype of mir-138 DKO cells. (A) DKO or WT cells were transfected with a miRNA mimic, and serum was withdrawn 2 d later. Images were taken 2 d after the transfection, before serum withdrawal (day 0), and 1 and 2 d after serum withdrawal (days 1, 2). RNA-seq libraries were prepared from samples 0 and 2 d after serum withdrawal. (B) DKO cells transfected with a miRNA mimic (miR-138, miR137, or miR-9) and imaged at 0, 1, and 2 d after serum withdrawal (20× magnification; scale bar, 10 µm). (C ) Quantitation of morphological differentiation at 0, 1, and 2 d after serum withdrawal of WT cells transfected with a negative control miRNA mimic (miR-neg) and of DKO cells transfected with miR-137, miR-138, miR-9, or miR-neg mimic. (D) Hexagonal heatmap of significantly changing genes in DKO cells transfected with miR-138 or miR-137 mimic, normalized to different control replicates transfected with pUC19 DNA (regression line in dotted dark blue; r = 0.28, P = 5 × 10−171). (E) Probability of conserved targeting (PCT) scores of miR-138 and miR-137 sites in targets containing only one target site
for that miRNA (white), targets containing two sites for the same miRNA (purple), or cotargets containing one target site for miR-138 and one target site for miR-137 (blue). Wilcoxon rank-sum test: (∗) P < 0.05, (∗∗∗∗) P < 0.001). (F) Relative luciferase signal (Renilla/firefly) for psiCHECK-2 reporter containing a 500-bp region of the Nfix 3′UTR with one miR-138 and one miR-137 site (WT) or with a combination of seed site mutations: both miRNA sites mutated in a full mutant (FM), only the miR-138 site mutated (137 site), only the miR-137 site mutated (138 site), or an 800-bp region of the 3′UTR containing an additional miR-138 site (longer WT). Cotransfection with miR-138 and miR-137, or a control miRNA (cel-miR-67), was normalized to a transfection with no miRNA mimic added. Select comparisons are shown (t-test): (∗) P < 0.05, (∗∗) P < 0.01, (∗∗∗) P < 0.001). (G) Relative expression of miR-137 (light blue) or miR-138 (dark blue) measured by TaqMan qPCR (miR/U6) in WT and 138 DKO or 137 KO cells at 0, 1, 2, and 4 d after serum withdrawal, normalized to WT day 0. (H) Summary of miR-138 and miR-137 regulation during neuronal differentiation, showing repression of individual and shared (Tco) targets, and
fold higher in mir-137 KO than in WT cells (Fig. 3G). Thus, these cotargeting miRNAs regulate each other’s expression in opposite directions. We also observed that miR-138 levels increase more rap-idly than miR-137 following serum withdrawal, suggesting that 138 may regulate earlier stages of differentiation than miR-137 (Fig. 3G).
The simplest model to explain the observed differences be-tween the phenotypes of mir-138 and mir-137 KOs is that strong repression of one or more miR-138/miR-137 cotargets is required for differentiation of CAD cells (Fig. 3H). In this model, repression by endogenous miR-137 is insufficient in mir-138 DKO cells (which have reduced levels of miR-137) but is sufficient when both miRNAs are present at WT levels, or in mir-137 KO cells (which have elevated levels of miR-138), or when high levels of ex-ogenous miR-137 are provided. The observations above suggest that mir-138 induction is an early event in CAD cell differentia-tion, which precedes and promotes induction of mir-137, with miR-138 and miR-137 collaborating to drive differentiation and re-pression of mir-138 by miR-137 serving to limit the magnitude and/or duration of the period of robust cotargeting.
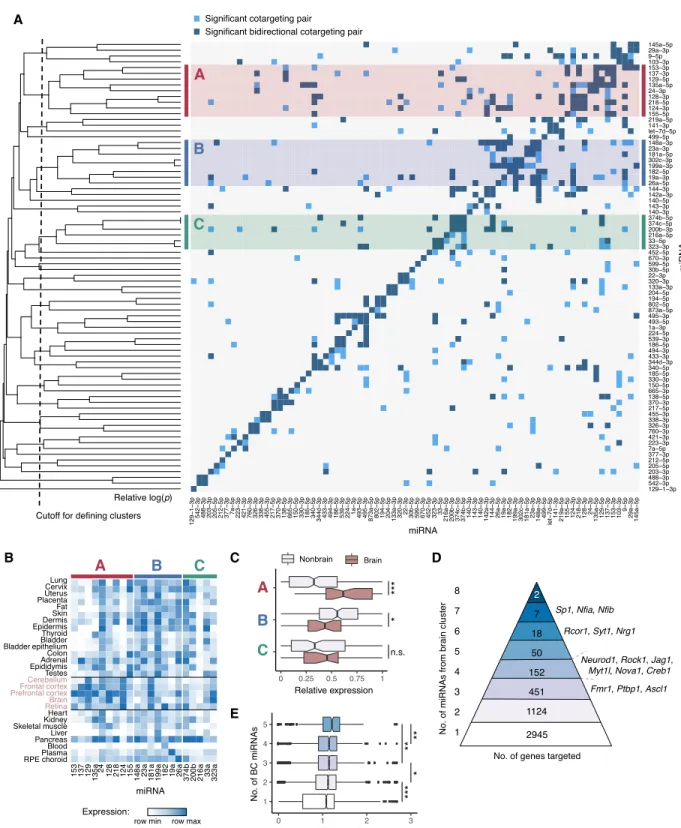
Groups of miRNAs preferentially share targets with one another
Given the large number of miRNA pairs with cotargeting potential, we asked whether these pairs are organized into larger groups of potentially collaborating miRNAs. To address this possibility, we performed hierarchical clustering of miRNAs based on the degree of similarity between their significant cotargeting relationships to other miRNAs (Methods). This analysis yielded three prominent clusters of six or more miRNAs (labeled A, B, and C in Fig. 4A). By examining the expression patterns of the clustered miRNAs across human tissues, we noted that most of the nine miRNAs in cluster A were highly enriched in brain tissues (Fig. 4B), including the well-known neuronal miRNAs miR-124, miR-128, and miR-137 (Land-graf et al. 2007). By categorizing tissues as brain or nonbrain, we found that the miRNAs of cluster A were indeed highly enriched in brain over nonbrain tissues (P = 6.4 × 10⁻⁶, Kolmogorov–Smir-nov test), whereas miRNAs of cluster B were enriched in nonbrain tissues, and those of cluster C showed no trend relative to brain (Fig. 4C). Therefore, we designated miRNA cluster A as the“brain cluster.” Several years ago, a study identified gene-set signatures enriched for miRNA targeting and found evidence for enrichment of cotargeting (Tsang et al. 2010) but did not detect the clusters of miRNAs detected here. Identification of this pattern may therefore depend on the availability of updated genome annotations, align-ments, or methodology.The existence of clusters of miRNAs that preferentially share cotargeting partners with one another suggests that“cliques” of three or more miRNAs may often team up in target regulation. To explore this idea, we focused on the brain cluster because of its large size and strong tissue-specific bias. Some transcripts were targeted by as many as eight of the nine miRNAs in the brain clus-ter, and some 1804 transcripts were brain cluster“multitargets,” in that they were targeted by three or more brain cluster miRNAs (Fig. 4D). A number of these mRNAs encode known regulators of neu-ronal differentiation, such as Jag1, Neurod1, Ptbp1, Rock1, and Rcor1 (Åkerblom and Jakobsson 2014), or have precise dosage re-quirements for proper synaptic function, such as Fmr1 (Oostra and Willemsen 2003). Genes with multiple target sites to brain cluster miRNAs also preferentially conserve these sites (Fig. 4E), as assessed by their relative PCTscores, a measure that controls
for miRNA-specific differences in seed match conservation (as
ob-served in Fig. 3E). This observation suggests the possibility that multitargeting may be functionally more important overall than single targeting, and is consistent with seed match conservation patterns observed previously (Friedman et al. 2008).
Because thousands of mRNAs increase in 3′UTR length across neuronal differentiation (Miura et al. 2013), we wondered if this may contribute to the high levels of cotargeting in the brain. For brain-enriched miRNAs (Z-score > 2), we assessed the number of miRNA sites contained in brain-enriched 3′UTR extension regions from Miura et al. (2013). The number of genes targeted in the 3′ UTR extension regions correlates strongly (rho = 0.85) ( Supple-mental Fig. S4A) with the number of significant cotargeting rela-tionships for brain-enriched miRNAs. However, the total number of genes targeted by a miRNA also correlates strongly with cotargeting relationships (rho = 0.88) (Supplemental Fig. S4B), sug-gesting a relationship between targeting of extension and nonex-tension 3′ UTR regions and the number of cotargeting relationships. Additionally, removing all genes targeted in the 3′ UTR extension regions from the cotargeting analysis had only a modest effect on the significance of relationships with other miRNAs (Supplemental Fig. S4C–E). Thus, targeting of 3′UTR ex-tensions occurs extensively for brain-specific miRNAs but seems to follow similar cotargeting patterns as for other 3′UTR regions.
Groups of brain cluster miRNAs can collaborate to exert strong
repression
We next sought to explore the potential for collaborative repres-sion of targets by miRNAs from the brain cluster. Not every seed match confers detectable repression, even when considering those that are conserved across mammals. In addition, although site type (e.g., 8mer, 7-mer-m8, 7-mer-A1) and context scores correlate with site efficacy, it remains difficult to accurately predict the magni-tude of repression (Grimson et al. 2007; Agarwal et al. 2015). Therefore, we designed sets of luciferase reporters to measure the level of repression associated with each miRNA seed match and cognate miRNA, singly and in combination, for several genes mul-tiply targeted by miRNAs from the brain cluster.
The assay was designed and controlled so as to determine the total amount of regulation resulting from the combination of miRNAs and the relative contribution of each miRNA to that total, thus also enabling us to assess cooperativity between sites. We se-lected four candidate genes (Neurod1, Fmr1, Rock1, and Rcor1) that have important functions in neurobiology and whose 3′UTRs con-tained conserved seed matches to three or more miRNAs from the brain cluster. Their full-length 3′UTRs were cloned downstream from the Renilla luciferase (hRluc) gene in the psiCHECK-2 expres-sion vector, which also expresses firefly luciferase (hluc+) as an in-ternal control. Reporter clones containing disrupted seed matches were generated by mutating two bases in the center of the seed match. For each gene, we also generated a full-mutant (FM) clone in which all seed matches to brain cluster miRNAs were mutated, as well as clones for combinations of individual seed match muta-tions (Fig. 5A).
For use with each reporter, a different miRNA expression plas-mid was constructed containing hairpins expressing each of the brain cluster miRNAs targeting that gene’s 3′UTR, inserted into
an intron of GFP under doxycycline control. miRNA expression following transfection into human HEK293T cells was confirmed using miRNA TaqMan assays (Supplemental Fig. S5). We also gen-erated two control miRNA expression plasmids: one expressing miR-103, a broadly expressed miRNA with no seed match in any
A
B
C
E
D
Figure 4. Patterns of cotargeting among pairs and groups of miRNAs. (A) Pairwise cotargeting relationships for 78 conserved miRNA families, showing unidirectional (light blue) and bidirectional (dark blue) significant cotargeting relationships with the reference miRNA on the y-axis (both with q-val < 0.05), and nonsignificant relationships (light gray). Rows were clustered using average linkage hierarchical clustering with distances defined as M− avg(−log
10-[pval]) from a binomial test of the extent of overlap of significant cotargeting relationships between rows, where M is the maximum−log(pval) observed. Vertical dotted line indicates cutoff distance (=2.8) at which clusters of five or more miRNAs were defined. Clusters are highlighted with red (cluster A), blue (cluster B), or green (cluster C). (B) Heatmap of miRNA expression clustering across human tissues (brain tissues labeled in pink). Samples are normalized to the maximum and minimum values in each row, and relative expression is expressed as (sample– min)/(max – min). (C) Box plots show relative expression of each miRNA in each cluster in brain tissues versus nonbrain tissues, grouped as in B; (∗) significance by Kolmogorov–Smirnov test. (D) The number of genes predicted as targets of different numbers of miRNAs from the brain cluster, with selected genes listed at right. (E) Relative PCTscores (normalized to
the transcriptome-wide mean PCTof sites for each miRNA) for miRNA sites in genes targeted by different numbers of brain cluster miRNAs. Wilcoxon
rank-sum test: (∗) P < 0.05, (∗∗) P < 0.01, (∗∗∗) P < 0.001. See alsoSupplemental Figure S4.
Cherone et al.
A
B
C
E
D
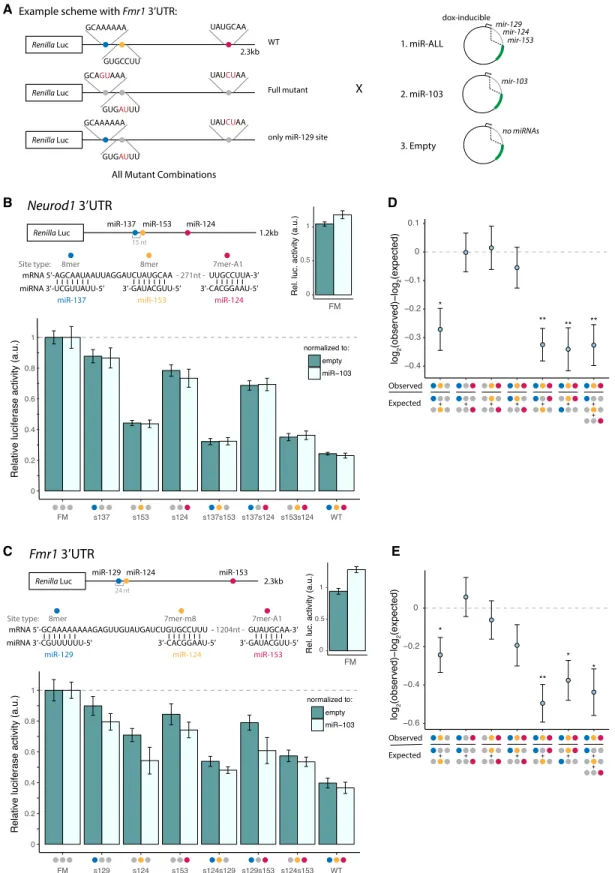
Figure 5. Brain cluster miRNAs collaborate to strongly repress Neurod1 and Fmr1. (A) Luciferase reporter designs (Fmr1 3′UTR shown). Locations of seed matches to three brain cluster miRNAs are shown by colored dots, with seed and seed match sequences shown at right. (B) Neurod1 and (C ) Fmr1 full-length 3′UTRs were cloned downstream from the Renilla luciferase gene. Relative luciferase = (RmiR-ALL/FmiR-ALL)/(Rnorm/Fnorm)/FM, where RXand FXare Renilla
lu-ciferase (hRluc) and firefly lulu-ciferase (hluc+) activities in condition X, respectively. Samples were normalized to the FM from the corresponding control re-porter and further normalized to either the empty plasmid (dark teal) or miR-103 control (light teal). Mean ± SD of biological triplicates is shown. (D,E) Neurod1 (D) and Fmr1 (E) observed versus expected repression from combinations of sites, as indicated under the x-axis. Error bars, SE propagated from biological triplicate measurements. Student’s t-test: (∗) P < 0.05, (∗∗) P < 0.01. See alsoSupplemental Figure S5.
of the selected 3′UTRs, and an empty vector with no miRNA in-serted. Luciferase reporter plasmids were cotransfected with either their cognate miRNA expression plasmid (+ALL) or the miR-103 control plasmid (+miR-miR-103) or the empty vector control (+empty), and Renilla and firefly luciferase levels were assayed 48 h later (Fig. 5A). Each Renilla/firefly (R/F) ratio from the ALL treatment was normalized to the R/F ratio from the +miR-103 control, or to that from the +empty control. Comparison of
these two controls can inform about the extent to which displace-ment of endogenous miRNAs from RISC by exogenous small RNAs may influence reporter expression.
Neurogenic differentiation 1 (Neurod1), a basic helix–loop– helix transcription factor, is a potent proneural factor that drives neurogenesis by directly binding to and activating transcription of key neuronal development genes (Pataskar et al. 2016). The Neurod1 3′UTR contains conserved seed matches to three brain
A
C
B
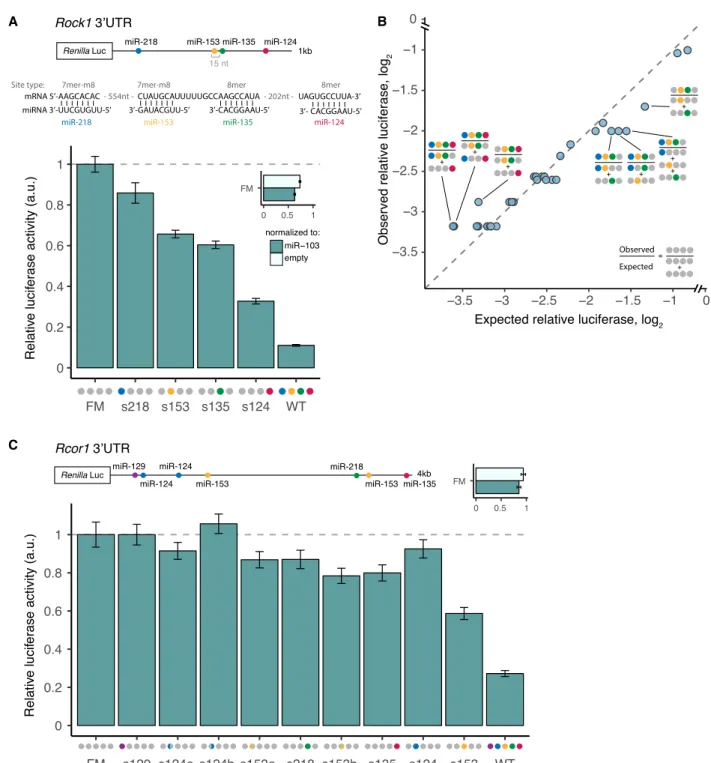
Figure 6. Strong and complex patterns of repression of Rock1 and Rcor1 3′UTRs by brain cluster miRNAs. (A) Rock1 3′UTR cloned downstream from Renilla luciferase, as in Figure 5. (B) Observed/expected relative luciferase (log2) for all combinations of sites that were significant relative to empty vector
or miR-103 controls is shown. (C ) Rcor1 3′UTR cloned downstream from Renilla luciferase, as in B. Colored semicircles indicate first (left semicircle) or second (right semicircle) miR-124 and miR-153 sites in UTR. See alsoSupplemental Figure S6.
cluster miRNAs: miR-137, miR-153, and miR-124. The WT reporter was repressed∼75% when transfected with the miR-ALL plasmid compared with either control plasmid, but the FM was not re-pressed at all, confirming that the observed repression results from miRNAs acting on the three miRNA sites (Fig. 5B). We mea-sured the amount of repression conferred by each individual site by comparing mutant versions in which the other two sites were mutated to the FM reporter. This approach revealed that the miR-137, miR-153, and miR-124 seed matches confer 12%, 56%, and 22% repression, respectively.
Fragile X mental retardation 1 (Fmr1) mRNA is also targeted by three miRNAs in the brain cluster: miR-129, miR-124, and miR-153 (Fig. 5C). The encoded RNA-binding protein FMRP acts as a translational regulator at synapses and affects dendritic spine morphology (Oostra and Willemsen 2003). Repression of Fmr1 in fragile X syndrome (FXS) results in a range of developmental dis-abilities, including cognitive impairment, and elevated levels of Fmr1 mRNA have been observed in premature ovarian failure (POF) and fragile X-associated tremor/ataxia syndrome (FXTAS), indicating that the gene is highly dosage sensitive (Oostra and Willemsen 2003). We found that the three targeting miRNAs to-gether repressed the Fmr1 reporter by ∼60%, with individual seed matches to miR-129, miR-124, and miR-153 conferring 10%, 30%, and 15% repression, respectively.
Together, these experiments confirm the ability of different sets of miRNAs from the brain cluster to act together to strongly re-press shared targets. To our knowledge, these magnitudes of repres-sion are the highest that have been observed for three different miRNAs targeting a natural, full-length 3′UTR (Krek et al. 2005; Grimson et al. 2007).
Cotargeting miRNA sites with close spacing act cooperatively
Previous studies have found that repression from multiple seed matches to the same miRNA in the same 3′UTR is typically multi-plicative (equivalently, log-additive), so that extent of repression can be multiplied between different seed matches to predict com-bined repression (Grimson et al. 2007; Nielsen et al. 2007). This rule is thought to hold unless the sites are located within a cooper-ative distance from one another, canonically 13–35 nt between seed starts (Doench and Sharp 2004; Grimson et al. 2007; Sætrom et al. 2007). Therefore, we used log-additivity to calculate expected reporter expression using measurements from single sites (or from two sites) and compared these values to those observed for reporters containing two or three sites to assess potential coopera-tivity (Fig. 5D,E).The Neurod1 and Fmr1 reporters each contained a pair of sites with cooperative spacing: The miR-137 and miR-153 seed starts are 15 nt apart, and miR-129 and miR-124 are 24 nt apart. In both re-porters, we found that pairs of sites with distant spacing generally yielded log-additive repression, as expected, whereas the closely spaced pair of sites in each reporter repressed more strongly, sug-gesting cooperative activity. Defining the cooperative effect (CE) as the difference between the base 2 logs of the observed and ex-pected repression levels for the pair of seed matches, we observed a CE of −0.27 (P < 0.025, Student’s t-test) for miR-137/miR-153 Neurod1 and−0.24 (P < 0.05, Student’s t-test) for miR-129/miR-124 in Fmr1, confirming cooperativity. We obtained similar CE values when computing repression from pairs of sites relative to single sites or from trios compared with either three single sites or a pair of sites and a single site. In both of these UTRs, the weakest site occurs at a cooperative distance from a much stronger site, thus
conferring greater repressive potential to the weak site than if it oc-curred in isolation.
Cotargeting miRNAs direct potent and complex patterns
of repression
To ask whether the patterns of repression observed above hold for larger numbers of sites in the same 3′UTR, we constructed similar mutant reporter series for two additional genes, with four and sev-en seed matches to brain cluster miRNAs in their 3′UTRs. Rho-as-sociated coiled-coil containing protein kinase 1 (ROCK1) is a downstream effector of RhoA GTPase, controlling actin filament bundling (Julian and Olson 2014) and axonal pathfinding, whose misexpression can inhibit neuritogenesis or cause neurite retrac-tion (Mueller et al. 2005; Gu et al. 2014). The 3′UTR of Rock1 con-tains conserved target sites to four miRNAs from the brain cluster: miR-218, miR-153, miR-135, and miR-124. When the WT reporter was transfected with the miR-ALL plasmid containing the four miRNAs, expression was repressed a remarkable 93% (Fig. 6A; Sup-plemental Fig. S6). The FM reporter was repressed 27%–37%
de-pending on the control used for normalization, suggesting the presence of some additional repressive element activated by these miRNAs, but the WT 3′UTR was still repressed 90% relative to the FM. This magnitude of repression is beyond the range typically at-tributed to miRNAs and may be the strongest yet observed for a natural noncleaved 3′ UTR target. Each miRNA site contributed to this repression: miR-218, miR-153, miR-135, and miR-124 repressed Rock1 by 14%, 34%, 40%, and a remarkable 68%, respec-tively (among the strongest known effects for a single noncleavage site in an endogenous 3′UTR).
The miR-153 and miR-135 sites occur within a cooperative spacing of 15 nt apart and showed cooperativity (CE =−0.36, P < 0.0025, Student’s t-test) (Fig. 6B). We also observed a significant CE of −0.17 (P < 0.05, Student’s t-test) between miR-218 and miR-153, spaced 561 nt apart, far beyond the canonical range for cooperativity, and the trio of miR-218, miR-153, and miR-135 sites were also cooperative (CE =−0.45, P < 0.0025, Student’s t-test). However, reporters that also contained the miR-124 site, including the WT reporter, failed to show significant cooperativity (Fig. 6B) (Methods).
We also tested the 3′ UTR of REST corepressor 1 (Rcor1), which contains seven sites to five distinct miRNAs from the brain cluster. RCOR1 helps recruit histone deacetylases to the REST complex but also functions independently in the differentiation of early neuronal progenitors and in neuronal migration (Qureshi et al. 2010). Rcor1 mRNA levels peak in early neuronal progeni-tors and decrease sharply across differentiation (Qureshi et al. 2010; data from Hubbard et al. 2013). Each tested site in the Rcor1 reporter exerted only a modest level of repression (no more than 30%), yet together they conferred 80% repression (Fig. 6C). A modest amount of cooperativity between all of the sites was observed, which may be related to the 48-nt spacing be-tween the miR-218 site and the second miR-153 site, miR-153.2 (Fig. 6B). The regulation of Rcor1 provides an example in which moderate repression by individual miRNAs can combine to achieve more pronounced levels when several miRNAs act in concert. Together, the data in Figures 5 and 6 validate four multi-targets of brain cluster miRNAs, establish patterns of log-additive and frequent cooperative activity, and show the potential for combinations of miRNAs to repress expression by 60%–90% or more.
Discussion
The regulatory logic underlying miRNA regulation remains incom-pletely understood. When twofold changes in the expression of most genes appear to be phenotypically neutral (Nanjundiah 1993), it is unclear why miRNAs and so many individual miRNA target sites, which typically exert only modest∼10%–30% repres-sion, should be so highly conserved through evolution (Spies et al. 2013). The magnitudes of target repression observed here for com-binations of miRNAs, between approximately 2.5- and 10-fold, are in a range in which phenotypic consequences are more common. Correlated expression of the involved miRNAs—as observed for the brain cluster—may enable groups of miRNAs to repress indi-vidual targets by several fold or more, representing a major contri-bution to the developmental or environmental regulation of multitargeted genes.
Multitargeted genes appear to be quite numerous in mamma-lian genomes (e.g., Fig. 4D), leading us to consider how this regu-latory pattern may evolve. In a cell type or condition in which repression of a specific gene would provide a fitness advantage, the emergence and maintenance of seed matches to expressed miRNAs should be favored. Given that all miRNAs enter similar or identical RISCs and repress similarly, selection is likely to favor gain of sites for any miRNA with appropriate expression, until the optimal level of repression is achieved. If two seed matches worth of repression are needed and 10 different miRNAs are expressed at appropriate levels in relevant cell type(s), then the second site to emerge has a nine in 10 chance of matching a different miRNA than the first, making two sites to different miRNAs nine times more likely to evolve than two sites to the same miRNA. If addi-tional repression is needed, then eight times out of 10 the third site will be to a third distinct miRNA, and so forth. Thus, multitar-geting is likely to evolve fairly readily in comparison to repeated targeting by the same miRNA, consistent with its much greater fre-quency in mammalian genomes (Friedman et al. 2008).
Cotargeting by distinct miRNAs might also offer regulatory advantages over acquisition of multiple sites to a single miRNA. Regulation by different miRNAs can produce more complex tem-poral patterns of repression during cellular differentiation, stress response, or other dynamic processes, and multitargeting may pro-vide robustness advantages even in nondynamic situations. Regulation by miRNAs can reduce noise from bursts of transcrip-tion by reducing the number of proteins produced per mRNA, and cotargeting should further reduce noise in target expression, as the uncorrelated fluctuations in each miRNA’s expression will tend to cancel out (Schmiedel et al. 2015).
Shared targets appear to be more evolutionarily conserved than other targets (e.g., Figs. 3E, 4E), suggesting functional impor-tance. Cotargeting relationships may often reflect overlapping or related functions of pairs of miRNAs, as illustrated above for the miR-138/miR-137 pair in CAD cell differentiation. Genetic pertur-bation of specific cotargeting pairs or groups of miRNAs may be a generally useful strategy to reveal phenotypes, to identify func-tional relationships and to help narrow the list of targets relevant to a given phenotype (Alvarez-Saavedra and Horvitz 2010).
Unlike some previous approaches (e.g., Gennarino et al. 2012) our approach to identifying functionally related miRNA pairs and groups does not involve mRNA (or miRNA) expression, and so is not inherently biased toward any particular tissue. However, our results reveal a particularly strong signature of co-and multitargeting among miRNAs with prominent expression in the brain. The brain may represent particularly fertile ground
for the evolution of these regulatory relationships because the 3′ UTRs of mRNAs expressed in the brain are much longer than in other tissues (Ramsköld et al. 2009), 3′UTR length increases across neuronal differentiation (Miura et al. 2013), and many miRNAs are brain-enriched (Bartel 2018). Neurons can require that levels of key proteins remain within a particular range for proper function, as in the case of FMR1 (Oostra and Willemsen 2003), so the noise reduc-tion benefits of cotargeting might be important there. The brain also has an extremely complex architecture of functionally distinct cell types, with more than 40 distinct neuronal types in the cortex alone (Tasic et al. 2016), so multitargeting by miRNAs with over-lapping but distinct expression patterns across neuronal subtypes might be used to tune cell-type–specific expression. Perturbation of the expression of multiple miRNAs belonging to the brain clus-ter occurs in several diseases of the brain, including glioblastoma, Huntington’s disease, and dementia with Lewy bodies (Skalsky and Cullen 2011; Soldati et al. 2013; Nelson et al. 2018). Changes in the levels of groups of miRNAs that cotarget together may yield large magnitude changes in the expression of multiply targeted mRNAs, potentially contributing to pathology.
Methods
miRNA target set enrichment test
We limited our analysis to broadly conserved miRNAs with at least 300 broadly conserved targets, as defined by TargetScan v7.0 (Agarwal et al. 2015). Additionally, to eliminate pairs that might share many targets owing to related seeds, we collapsed miRNAs with identical 7-mer seeds or 7-mer seeds shifted by 1 nt, keeping the miRNA with the larger number of conserved targets, or in cases in which both miRNAs had more than 1000 conserved targets, we kept the miRNA with broader evolutionary conservation. This yielded a set of 78 broadly conserved miRNAs with unrelated seed sequences.
Control gene sets were generated for each miRNA target set that matched the distribution of 3′ UTR length, C + G content, and sequence conservation (phyloP scores) of the targets of the given miRNA. For example, miR-A target genes were binned into x quantile bins of 3′UTR length, which were further binned into y quantile bins of GC content, which were further divided into z quantile bins of phyloP scores. All other genes (not targeted by miR-A) were divided into these miR-A–defined bins, and controls were sampled across these bins in the same proportions as miR-A target genes. The values of x, y, and z were chosen from the range of three to seven for each miRNA to balance the competing de-mands of matching the three properties as closely as possible while retaining sufficient control genes to ensure statistical power for the cotargeting analysis.
miRNA cotargeting relationship clustering
Each miRNA pair was coded as one if significant (q-value < 0.05) and zero if not significant. Because the zeroes represent an uninter-esting default state (i.e., absence of a significant relationship be-tween two miRNAs), standard clustering techniques were not well suited to these data. Instead, we performed a binomial test of overlap between the sets of significant cotargeting relationships for all miRNA pairs and used the−log of the P-values subtracted from the maximum value (excluding self-comparisons) as a dis-tance, with average linkage hierarchical clustering. Clusters were assigned by cutting the tree at a height of 2.8, as shown in Figure 4A.
miRNA mimic rescues and quantitation of neuronal
differentiation
mir-138 DKO cells were plated at 6 × 10⁴cells/well in a
poly-l-ly-sine–coated 12-well dish. mirVana miRNA mimics (miR-138, miR-137, miR-1, miR-9, miR-7, miR-128, or negative control) were transfected at 1 nM, 3 nM, and 9 nM with the Lipofectamine RNAiMAX reagent. Media was changed to serum-free after 48 h, and the fraction of differentiated cells was quantified 0, 1, and 2 d after media change by counting any cell with a neurite at least twice the length of the cell body as differentiated and by counting all others as undifferentiated, using a blinded protocol.
Luciferase reporter assays
3′UTRs were cloned into the psiCHECK-2 vector (Promega) down-stream from the Renilla luciferase gene using In-Fusion Cloning (Takara Bio). miRNA sites were mutated using QuikChange (Agi-lent Genomics). miRNA hairpins plus ∼100 bp upstream and downstream were cloned into the pRD-RIPE vector (Khandelia et al. 2011) adjacent to one another. For each well of a 24-well plate, 100 ng psiCHECK-2 reporter plasmid and 300 ng miRNA ex-pression plasmid were cotransfected into HEK293 cells using 1 µL Lipofectamine 2000 and incubated with 1.5 µg/mL doxycycline. Renilla and firefly luciferase levels were assayed after 48 h using the dual luciferase reporter assay system (Promega) and measured on a Varioskan flash (Thermo Fisher Scientific). SeeSupplemental Material (Extended Experimental Procedures) for additional details.
Supplemental Experimental Procedures describe details of cell culture, transcriptome sequencing and analysis, small RNA se-quencing, small RNA expression analysis, expression analysis of miRNA targets and cotargeting pairs, gene KO and genotyping methods, and luciferase reporter assays.
Data access
RNA-seq and small RNA sequencing data have been submitted to the NCBI Gene Expression Omnibus (GEO; https://www.ncbi .nlm.nih.gov/geo/) under superseries accession number GSE125853.
Acknowledgments
We thank Myriam Heiman, Phil Sharp, David Sabatini, Michael McManus, D’Juan Farmer, Malin Akerblom, and members of the Burge Laboratory for helpful discussions and comments. This work was supported by a grant from the National Institutes of Health (National Human Genome Research Institute) to C.B.B. (grant no. HG002439).
Author contributions: J.M.C. performed experiments and anal-yses and drafted the manuscript. V.J. performed experiments. C.B.B. supervised the project and revised the manuscript. All au-thors reviewed and approved the final manuscript.
References
Agarwal V, Bell GW, Nam J-W, Bartel DP. 2015. Predicting effective microRNA target sites in mammalian mRNAs. eLife4: e05005. doi:10 .7554/eLife.05005
Åkerblom M, Jakobsson J. 2014. MicroRNAs as neuronal fate determinants. Neuroscientist20: 235–242. doi:10.1177/1073858413497265 Alvarez-Saavedra E, Horvitz HR. 2010. Many families of C. elegans
microRNAs are not essential for development or viability. Curr Biol20: 367–373. doi:10.1016/j.cub.2009.12.051
Baek D, Villén J, Shin C, Camargo FD, Gygi SP, Bartel DP. 2008. The impact of microRNAs on protein output. Nature 455: 64–71. doi:10.1038/ nature07242
Bartel DP. 2018. Metazoan microRNAs. Cell173: 20–51. doi:10.1016/j.cell .2018.03.006
Cursons J, Pillman KA, Scheer KG, Gregory PA, Foroutan M, Hediyeh-Zadeh S, Toubia J, Crampin EJ, Goodall GJ, Bracken CP, et al. 2018. Combinatorial targeting by microRNAs co-ordinates post-transcription-al control of EMT. Cell Syst7: 77–91.e7. doi:10.1016/j.cels.2018.05.019 Doench JG, Sharp PA. 2004. Specificity of microRNA target selection in translational repression. Genes Dev 18: 504–511. doi:10.1101/gad .1184404
Friedman RC, Burge CB. 2014. MicroRNA target finding by comparative ge-nomics. In RNA sequence, structure, and function: computational and bioin-formatic methods (ed. Gorodkin J, Ruzzo W). Methods in molecular biology (methods and protocols), Vol. 1097. Humana Press, Totowa, NJ. Friedman RC, Farh KKH, Burge CB, Bartel DP. 2008. Most mammalian mRNAs are conserved targets of microRNAs. Genome Res19: 92–105. doi:10.1101/gr.082701.108
Gennarino VA, D’Angelo G, Dharmalingam G, Fernandez S, Russolillo G, Sanges R, Mutarelli M, Belcastro V, Ballabio A, Verde P, et al. 2012. Identification of microRNA-regulated gene networks by expression analysis of target genes. Genome Res22: 1163–1172. doi:10.1101/gr .130435.111
Grimson A, Farh KK-H, Johnston WK, Garrett-Engele P, Lim LP, Bartel DP. 2007. MicroRNA targeting specificity in mammals: determinants be-yond seed pairing. Mol Cell27: 91–105. doi:10.1016/j.molcel.2007.06 .017
Gu X, Meng S, Liu S, Jia C, Fang Y, Li S, Fu C, Song Q, Lin L, Wang X. 2014. miR-124 represses ROCK1 expression to promote neurite elongation through activation of the PI3K/Akt signal pathway. J Mol Neurosci52: 156–165. doi:10.1007/s12031-013-0190-6
Huang Y, Myers SJ, Dingledine R. 1999. Transcriptional repression by REST: recruitment of Sin3A and histone deacetylase to neuronal genes. Nat Neurosci2: 867–872. doi:10.1038/13165
Hubbard KS, Gut IM, Lyman ME, McNutt PM. 2013. Longitudinal RNA se-quencing of the deep transcriptome during neurogenesis of cortical glu-tamatergic neurons from murine ESCs. F1000Res2: 35. doi:10.12688/ f1000research.2-35.v1
Jiang Q, Feng M-G, Mo Y-Y. 2009. Systematic validation of predicted microRNAs for cyclin D1. BMC Cancer9: 194. doi:10.1186/1471-2407-9-194
Julian L, Olson MF. 2014. Rho-associated coiled-coil containing kinases (ROCK): structure, regulation, and functions. Small GTPases 5: e29846. doi:10.4161/sgtp.29846
Khandelia P, Yap K, Makeyev EV. 2011. Streamlined platform for short hair-pin RNA interference and transgenesis in cultured mammalian cells. Proc Natl Acad Sci108: 12799–12804. doi:10.1073/pnas.1103532108 Krek A, Grün D, Poy MN, Wolf R, Rosenberg L, Epstein EJ, MacMenamin P,
da Piedade I, Gunsalus KC, Stoffel M, et al. 2005. Combinatorial microRNA target predictions. Nat Genet 37: 495–500. doi:10.1038/ ng1536
Krichevsky AM, Sonntag K-C, Isacson O, Kosik KS. 2006. Specific microRNAs modulate embryonic stem cell–derived neurogenesis. Stem Cells24: 857–864. doi:10.1634/stemcells.2005-0441
Landgraf P, Rusu M, Sheridan R, Sewer A, Iovino N, Aravin A, Pfeffer S, Rice A, Kamphorst AO, Landthaler M, et al. 2007. A mammalian microRNA expression atlas based on small RNA library sequencing. Cell 129: 1401–1414. doi:10.1016/j.cell.2007.04.040
Lee RC, Feinbaum RL, Ambros V. 1993. The C. elegans heterochronic gene lin-4 encodes small RNAs with antisense complementarity to lin-14. Cell75: 843–854. doi:10.1016/0092-8674(93)90529-Y
Lewis BP, Shih I-H, Jones-Rhoades MW, Bartel DP, Burge CB. 2003. Prediction of mammalian microRNA targets. Cell 115: 787–798. doi:10.1016/S0092-8674(03)01018-3
Lewis BP, Burge CB, Bartel DP. 2005. Conserved seed pairing, often flanked by adenosines, indicates that thousands of human genes are microRNA targets. Cell120: 15–20. doi:10.1016/j.cell.2004.12.035
Mason S, Piper M, Gronostajski RM, Richards LJ. 2009. Nuclear factor one transcription factors in CNS development. Mol Neurobiol39: 10–23. doi:10.1007/s12035-008-8048-6
Mayr C, Hemann MT, Bartel DP. 2007. Disrupting the pairing between let-7 and Hmga2 enhances oncogenic transformation. Science315: 1576– 1579. doi:10.1126/science.1137999
McCall MN, Kim M-S, Adil M, Patil AH, Lu Y, Mitchell CJ, Leal-Rojas P, Xu J, Kumar M, Dawson VL, et al. 2017. Toward the human cellular microRNAome. Genome Res27: 1769–1781. doi:10.1101/gr.222067.117 Mendell JT, Olson EN. 2012. MicroRNAs in stress signaling and human
dis-ease. Cell148: 1172–1187. doi:10.1016/j.cell.2012.02.005
Miska EA, Alvarez-Saavedra E, Abbott AL, Lau NC, Hellman AB, McGonagle SM, Bartel DP, Ambros VR, Horvitz HR. 2007. Most Caenorhabditis
elegans microRNAs are individually not essential for development or vi-ability. PLoS Genet3: e215. doi:10.1371/journal.pgen.0030215 Miura P, Shenker S, Andreu-Agullo C, Westholm JO, Lai EC. 2013.
Widespread and extensive lengthening of 3′UTRs in the mammalian brain. Genome Res23: 812–825. doi:10.1101/gr.146886.112
Mueller BK, Mack H, Teusch N. 2005. Rho kinase, a promising drug target for neurological disorders. Nat Rev Drug Discov4: 387–398. doi:10 .1038/nrd1719
Nanjundiah V. 1993. Why are most mutations recessive? J Genet72: 85–97. doi:10.1007/BF02927924
Nelson PT, Wang W-X, Janse SA, Thompson KL. 2018. MicroRNA expres-sion patterns in human anterior cingulate and motor cortex: a study of dementia with Lewy bodies cases and controls. Brain Res1678: 374–383. doi:10.1016/j.brainres.2017.11.009
Nesti E, Corson GM, McCleskey M, Oyer JA, Mandel G. 2014. C-terminal domain small phosphatase 1 and MAP kinase reciprocally control REST stability and neuronal differentiation. Proc Natl Acad Sci111: E3929–E3936. doi:10.1073/pnas.1414770111
Nielsen CB, Shomron N, Sandberg R, Hornstein E, Kitzman J, Burge CB. 2007. Determinants of targeting by endogenous and exogenous microRNAs and siRNAs. RNA13: 1894–1910. doi:10.1261/rna.768207 Obermayer B, Levine E. 2014. Exploring the miRNA regulatory network us-ing evolutionary correlations. PLoS Comput Biol10: e1003860. doi:10 .1371/journal.pcbi.1003860
Oostra BA, Willemsen R. 2003. A fragile balance: FMR1 expression levels. Hum Mol Genet12(Spec No 2): R249–R257. doi:10.1093/hmg/ddg298 Pataskar A, Jung J, Smialowski P, Noack F, Calegari F, Straub T, Tiwari VK.
2016. NeuroD1 reprograms chromatin and transcription factor land-scapes to induce the neuronal program. EMBO J35: 24–45. doi:10 .15252/embj.201591206
Pereira JD, Sansom SN, Smith J, Dobenecker M-W, Tarakhovsky A, Livesey FJ. 2010. Ezh2, the histone methyltransferase of PRC2, regulates the bal-ance between self-renewal and differentiation in the cerebral cortex. Proc Natl Acad Sci107: 15957–15962. doi:10.1073/pnas.1002530107 Qi Y, Wang JK, McMillian M, Chikaraishi DM. 1997. Characterization of a
CNS cell line, CAD, in which morphological differentiation is initiated by serum deprivation. J Neurosci 17: 1217–1225. doi:10.1523/ JNEUROSCI.17-04-01217.1997
Qureshi IA, Gokhan S, Mehler MF. 2010. REST and CoREST are transcrip-tional and epigenetic regulators of seminal neural fate decisions. Cell Cycle9: 4477–4486. doi:10.4161/cc.9.22.13973
Ramsköld D, Wang ET, Burge CB, Sandberg R. 2009. An abundance of ubiq-uitously expressed genes revealed by tissue transcriptome sequence data. PLoS Comput Biol5: e1000598. doi:10.1371/journal.pcbi.1000598 Reinhart BJ, Slack FJ, Basson M, Pasquinelli AE, Bettinger JC, Rougvie AE, Horvitz HR, Ruvkun G. 2000. The 21-nucleotide let-7 RNA regulates developmental timing in Caenorhabditis elegans. Nature403: 901–906. doi:10.1038/35002607
Riley KJ, Rabinowitz GS, Yario TA, Luna JM, Darnell RB, Steitz JA. 2012. EBV and human microRNAs co-target oncogenic and apoptotic viral and hu-man genes during latency. EMBO J31: 2207–2221. doi:10.1038/emboj .2012.63
Sætrom P, Heale BSE, Snøve O, Aagaard L, Alluin J, Rossi JJ. 2007. Distance constraints between microRNA target sites dictate efficacy and coopera-tivity. Nucleic Acids Res35: 2333–2342. doi:10.1093/nar/gkm133 Santos MCT, Tegge AN, Correa BR, Mahesula S, Kohnke LQ, Qiao M, Ferreira
MAR, Kokovay E, Penalva LOF. 2016. miR-124, -128, and -137
orches-trate neural differentiation by acting on overlapping gene sets contain-ing a highly connected transcription factor network. Stem Cells34: 220– 232. doi:10.1002/stem.2204
Schmiedel JM, Klemm SL, Zheng Y, Sahay A, Blüthgen N, Marks DS, van Oudenaarden A. 2015. Gene expression: microRNA control of protein expression noise. Science348: 128–132. doi:10.1126/science.aaa1738 Selbach M, Schwanhäusser B, Thierfelder N, Fang Z, Khanin R, Rajewsky N.
2008. Widespread changes in protein synthesis induced by microRNAs. Nature455: 58–63. doi:10.1038/nature07228
Skalsky RL, Cullen BR. 2011. Reduced expression of brain-enriched microRNAs in glioblastomas permits targeted regulation of a cell death gene. PLoS One6: e24248. doi:10.1371/journal.pone.0024248 Soldati C, Bithell A, Johnston C, Wong K-Y, Stanton LW, Buckley NJ. 2013.
Dysregulation of REST-regulated coding and non-coding RNAs in a cel-lular model of Huntington’s disease. J Neurochem 124: 418–430. doi:10 .1111/jnc.12090
Spies N, Burge CB, Bartel DP. 2013. 3′UTR-isoform choice has limited influ-ence on the stability and translational efficiency of most mRNAs in mouse fibroblasts. Genome Res23: 2078–2090. doi:10.1101/gr.156919 .113
Storey JD, Tibshirani R. 2003. Statistical significance for genomewide stud-ies. Proc Natl Acad Sci100: 9440–9445. doi:10.1073/pnas.1530509100 Szulwach KE, Li X, Smrt RD, Li Y, Luo Y, Lin L, Santistevan NJ, Li W, Zhao X,
Jin P. 2010. Cross talk between microRNA and epigenetic regulation in adult neurogenesis. J Cell Biol 189: 127–141. doi:10.1083/jcb .200908151
Tasic B, Menon V, Nguyen TN, Kim T-K, Jarsky T, Yao Z, Levi B, Gray LT, Sorensen SA, Dolbeare T, et al. 2016. Adult mouse cortical cell taxonomy revealed by single cell transcriptomics. Nat Neurosci19: 335–346. doi:10 .1038/nn.4216
Tsang JS, Ebert MS, van Oudenaarden A. 2010. Genome-wide dissection of microRNA functions and cotargeting networks using gene set signa-tures. Mol Cell38: 140–153. doi:10.1016/j.molcel.2010.03.007 van Rooij E, Sutherland LB, Qi X, Richardson JA, Hill J, Olson EN. 2007.
Control of stress-dependent cardiac growth and gene expression by a microRNA. Science316: 575–579. doi:10.1126/science.1139089 Wightman B, Ha I, Ruvkun G. 1993. Posttranscriptional regulation of the
heterochronic gene lin-14 by lin-4 mediates temporal pattern formation in C. elegans. Cell75: 855–862. doi:10.1016/0092-8674(93)90530-4 Wu S, Huang S, Ding J, Zhao Y, Liang L, Liu T, Zhan R, He X. 2010. Multiple
microRNAs modulate p21Cip1/Waf1 expression by directly targeting its 3′untranslated region. Oncogene29: 2302–2308. doi:10.1038/onc.2010 .34
Yoo AS, Sun AX, Li L, Shcheglovitov A, Portmann T, Li Y, Lee-Messer C, Dolmetsch RE, Tsien RW, Crabtree GR. 2011. MicroRNA-mediated con-version of human fibroblasts to neurons. Nature476: 228–231. doi:10 .1038/nature10323
Zheng GXY, Ravi A, Calabrese JM, Medeiros LA, Kirak O, Dennis LM, Jaenisch R, Burge CB, Sharp PA. 2011. A latent pro-survival function for the mir-290-295 cluster in mouse embryonic stem cells. PLoS Genet 7: e1002054. doi:10.1371/journal.pgen.1002054
Received February 8, 2019; accepted in revised form September 20, 2019.