3rd International Conference on Bio-Based Building Materials
June 26th - 28th 2019 Belfast, UK
ID_ ZZ229
MOISTURE BUFFERING CAPACITY OF CLAY BASED PLASTERS
A. Phelipot-Mardelé 1*, F. Collet 1, Y. Jiang2, C. Lanos1, M. Lawrence2, M. Lemke3 1 Université de Rennes, Laboratoire de Génie Civil et Génie Mécanique, 35340, Rennes, France
2 University of Bath, UK 3 Claytec, Germany
*Corresponding author; e-mail: [email protected]
Abstract
The European ISOBIO project aims to develop new bio-based insulation panels and coatings showing low embodied energy and high hygrothermal efficiency. After optimization of composites, typical walls for new building and retrofitting will be designed, targeting energy saving and indoor comfort. These multi-layers walls will include indoor plaster that will highly contribute to indoor comfort. This paper investigates the moisture buffering capacity of clay-based plasters. Three formulations developed within the ISOBIO Project, are investigated. These formulations are clay-based and include hemp powder and pumice. After weight stability, drying shrinkage is measured and thermal properties are evaluated for densities ranging from about 1250 to 1425 kg/m3. Thermal conductivities are closed to values commonly
measured on earthen materials. The measurement of Moisture Buffer Value (MBV) is performed following two type of protocols. After stabilization, specimens are exposed to daily cyclic variation of ambient relative humidity. For each formulation, three thicknesses of specimens are considered. The lower thickness, about 1.3 centimeters, is representative of the plaster in-use. So, the MBV is representative of in-use behavior. The two higher thicknesses are used with the aim to study the effect of thickness on MBV and to identify MBV representative of the material’s one. Consequences of protocol modification in MBV measurement is evaluated and discussed. The three tested plasters are classified as good hygric regulators. A slight discrepancy appears between the three formulations (about 6.5 % for the in-use thickness) showing the limited incidence of formulation changes.
Keywords:
Coating; bio-based aggregate; Moisture Buffer Value; thermal conductivity, drying shrinkage
1 INTRODUCTION
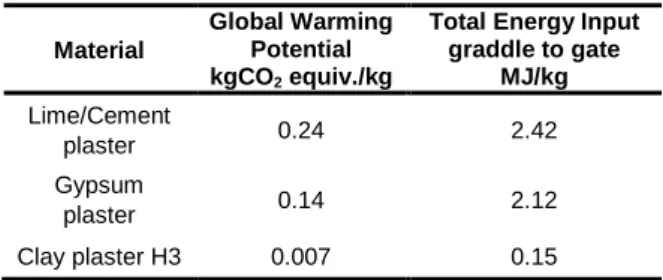
The European ISOBIO project aims to develop rigid insulation panels, plasters and renders using chopped vegetal resources from agricultural waste leading to low embodied energy and high hygrothermal efficiency. After optimization of composite formulations and productions [Viel 2017] [Colson 2017], typical multilayered wall solutions for new building and retrofitting will be designed, targeting energy saving and improved indoor comfort. Clay is an option for plaster formulation leading to low carbon building materials (Tab. 26). Clay based plaster are often quoted as a passive solution to improve indoor climate, reducing necessary energy input for active air conditioning. This paper deals with the moisture buffering capacity of clay-based plaster acting as protection layer for internal side of ISOBIO panel. The clay plaster reacts to daily moisture changes by adsorption and desorption of water vapor. Then the indoor moisture content is regulated depending on the total area and thickness of clay plaster. Three formulations, developed by Claytec within the ISOBIO Project, are investigated. These formulations are clay-based (without other binder, cement or lime) and include hemp powder and pumice. Two project partners (UR1 and UoB) evaluated the drying shrinkage, the thermal property and the Moisture Buffer Value (MBV) in different conditions.
Tab. 26: Comparisons of GWP and TEI between classical plasters
Material
Global Warming Potential kgCO2 equiv./kg
Total Energy Input graddle to gate MJ/kg Lime/Cement plaster 0.24 2.42 Gypsum plaster 0.14 2.12 Clay plaster H3 0.007 0.15
The MBV measurement is performed following two types of protocol (Nordtest project [Rode 2005] and ISO 24353 standard [ISO 24353 2008]). For the first protocol, three specimen’s thicknesses are considered. The lower thickness, about 13 mm, is representative of the plaster use; so, the MBV is representative of in-use behavior. The two higher thicknesses are in-used with the aim to study the effect of thickness on MBV and to identify MBV representative of the material’s one. Consequences of protocol modification in MBV measurement are evaluated and discussed and finally compared with Moisture buffering evaluation following DIN 18947 method [DIN 18947 2013]. Hygro-thermal properties are finally compared to performances obtained on other clay-based materials leading to the selection of the best plaster formulation.
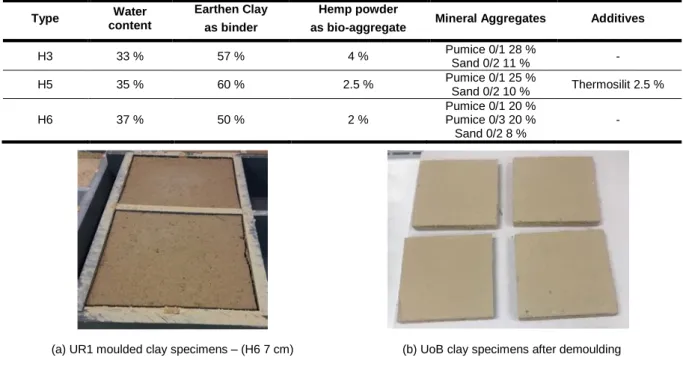
2 MATERIALS AND SAMPLES PRODUCTION The formulations of the tested clay-based plasters (H3, H5 and H6) can be found in Tab. 27. All the three types of clay-based plasters include earthen clay (quartz, feldspar, illite), hemp powder and mineral aggregates: sand 0/2 and pumice. Different Pumice grain sizes were tested (H3 and H6). Pumice is a natural volcanic mineral, available in volcanic region, e.g. in Germany at the Rhine river near Koblenz or around the Mediterranean Sea. It is industrial raw material available in dry or natural damped state with earthen moisture content. Claytec uses natural damped pumice. Pumice is non-inflammable and was used in former times for chimney building. Pumice has a relative low bulk density of 750 kg/m³.Formulation H5 contains a mineral silicate based fire retardant (Thermosilit™) similar to perlite but extruded in different ways and used as plaster. H5 was developed to test and compare the additional effect of this type of mineral fire retardant, which is compatible to DIN 18947.
The components of the formulation are premixed and delivered by Claytec with a water content close to 12 to 18 %. In order to reach the acceptable rheology of the paste, the user adjust the water content regarding the implementation method (splattering or spraying). For
UR1, the pasty product is obtained adding water to the wet premix to reach the same final paste rheology. The paste is then poured using molds with three different thicknesses: 13 mm, 40 mm and 70 mm with a mold area of 160 x 140 mm. Two specimens are produced for each formulation and each thickness (Fig. 75a). For UoB, all the premix are mixed with the same water content (less water than Tab. 27) leading to higher dry density of specimens. A unique thickness of 15 mm is used with a mold area of 150 x 150 mm. 4 specimens are produced for each formulation (Fig. 75b). Specimens remain in covered mold during 7 days for UR1 and 5 days for UoB. The specimens are then stored in climatic chamber for stabilization at 23 °C and 50 %RH for drying. SEM visualizations are performed on the specimens. The main conclusions are the same for all the formulations. Fig. 76 shows the microstructure of H3: (a) shows sand and pumice particles coated with the clay matrix and (b) shows cellular hemp shiv in the clay matrix. It is clearly shown that sand and pumice particles are well mixed in the clay matrix and the clay binder glue to the mineral aggregates. Same results are quoted for Thermosilit™ particles. Fig. 76b clearly shows that the cellular hemp shiv is well mixed with sand particles and the clay matrix well coat hemp shiv. The pores in the hemp shiv are not filled by clay matrix.
Tab. 27: Composition of the three tested specimens.
(a) UR1 moulded clay specimens – (H6 7 cm) (b) UoB clay specimens after demoulding
Fig. 75: Image of some of specimens after drying.
(a) (b)
Fig. 76: Microstructure of H3, (a) sand and pumice particles, (b) cellular hemp shiv
Cellular hemp shiv
Clay plaster well adhered to shiv
Type Water
content
Earthen Clay as binder
Hemp powder
as bio-aggregate Mineral Aggregates Additives
H3 33 % 57 % 4 % Pumice 0/1 28 % Sand 0/2 11 % - H5 35 % 60 % 2.5 % Pumice 0/1 25 % Sand 0/2 10 % Thermosilit 2.5 % H6 37 % 50 % 2 % Pumice 0/1 20 % Pumice 0/3 20 % Sand 0/2 8 % -
3 CHARACTERISATION METHODS
3.1 Density
The specimen weight stability is reached when the mass variation is lower than 0.01 % for two consecutive weighing with 48 h time step. For large specimen thicknesses, more than one month is needed to ensure a weight stabilization. During the stabilization step, the drying shrinkage is quoted and the final density is determined according to a weight measurement ( 0.01 g) and a measurement of the 3D dimensions ( 0.01 mm). Each dimension is the average of four values, with a variation coefficient lower than 1.2 %. 3.2 Thermal conductivity
At UR1, the thermal conductivity was measured using the commercial CT-meter device equipped with 50 mm-length hot wire (Fig. 77). The measurement is based on the analysis of the temperature rise versus heating time. The heat flow and heating time are chosen to reach high enough temperature rise (> 10 °C) and high correlation coefficient (R²) between experimental data and fitting curve. In this study, the power used ranges between 0.851 and 1.513 W and the heating time is 120 s. The thermal conductivity is the average of five values on 70 mm thick specimen, with a variation coefficient lower than 5 %.
Fig. 77: Photo of the CTmeter device
At UoB, the thermal conductivity was measured using the commercial ISOMET device equipped with a surface probe (Fig. 78). The measurement is based on the analysis of the time dependence of the thermal response on the impulses of heat flux. An electrical resistance heater in the probe induced a heat flux, in direct contact with the tested sample. The thermal conductivity measure has an accuracy of 5 % of reading and 0.001 W/(m.K) and a reproducibility of 3 % of reading and 0,001 W/(m.K)
Fig. 78: Photo of the ISOMETER device
In order to measure the thermal conductivity at dry state, the UR1 specimens are dried at 40°C until a constant mass is reached. Then, the specimens are conditioned at 23 °C using dry chamber.
In all case, the thermal conductivity measurements are performed on the flat specimen surface corresponding to the bottom of the mould.
3.3 Moisture buffer value
The moisture buffer value MBV quantifies the moisture buffering ability of a material. This property corresponds to the amount of moisture uptake (and release), per open surface area, under daily cyclic variation of relative humidity (Eq. 1):
𝑀𝐵𝑉 = ∆𝑚
𝐴.(𝑅𝐻ℎ𝑖𝑔ℎ−𝑅𝐻𝑙𝑜𝑤)
(1)
MBV: moisture buffer value, g/(m².%RH), ∆m: moisture uptake/release during the period, g, A: open surface area, m2,
RHhigh/low: high/low relative humidity, %.
At UR1, MBV is measured according to the method given in the NORDTEST project [Rode 2005]. After stabilization at (23 °C, 50 %RH), specimens are exposed to daily cyclic variation: 8 h at high relative humidity (75 %) followed by 16 h at low relative humidity (33 %). The test goes on until the change in mass ∆m is the same between the last three cycles with less than 5 % of discrepancies (Fig. 79a). Thus for each specimen, the MBV is the average value calculated from the last 3 cycles.
(a)
(b) (c)
Fig. 79: (a) the daily cyclic variation, (b) the VÖtsch climatic chamber, (c) sealed sample
The used device consists in a climatic chamber (VÖtsch VC4060) (Fig. 79b) that can be controlled in the range + 10 to + 95 °C and 10 % to 98 %RH. The switch in the chamber relative humidity (75 %RH; 33 %RH) is done manually according to the 8/16 h scheme. Temperature and relative humidity are measured continuously with sensor SHT75 and with sensor of the climatic chamber; the air velocity is measured in the surroundings of the specimens: about 0.1 m/s. The specimens are weighed out of the climatic chamber five times during absorption period and two times during desorption one. The readability of the balance is at most 0.01 g, and its linearity is 0.01 g. The accuracy of the moisture buffer value is thus about at most 5 %. Aluminum tape was used to seal the back and sides of each specimen to ensure the vapor exchange only occur through a single
w e ig h t Time Weight kinetic
face of the materials (Fig. 79c). The exchange area is higher than 100 cm² for each specimen, and the total exchange area is higher than 300 cm² by material. The NORDTEST project leads to a classification of moisture buffer values from negligible to excellent (Fig. 80).
Fig. 80: Nordtest project classification [Rode 2005].
At UoB, MBV is measured according to Nordtest protocol (only 4 cycles) and to the method given in the section 8.3 of ISO 24353 standard (2008). In this case, after a weight stabilization at 23 °C and 63 %RH, specimens are exposed to 4 cyclic variations: 12 h at high relative humidity (75 3 %) followed by 12 h at low relative humidity (50 3 %) whilst the temperature was constant at 23 0.5 °C. In all cases, the MBV is evaluate using the last cycle. The mass of the specimen was logged at 1 minute intervals. A screen was placed around the mass balance to minimize the influence of air movement over the surface of the specimen during testing without air velocity measurement. All plaster formulations are tested in the climatic chamber with the Nordtest protocol and only H3 is tested with the two protocols. Alternative method is tested using a DVS (Dynamic Vapor Sorption) chamber to ensure the MBV test according to ISO 24353 standard. Test on the 3 plaster formulations are realized on smaller samples (less than 1 cm3, 10 mm high) The exchange area is less than 0.5 cm². The sample weight stabilization at 23 °C and 63 %RH is reduced to 48h. During the test, specimens are weighed continuously. The readability of the balance is at most 0.01 g, and its linearity is 0.01 g.
4 EXPERIMENTAL RESULTS
4.1 Density and Drying shrinkage
Density of all the specimens was measured (Tab. 28). Densities of clay-based plasters range between 1400 kg/m³ and 1500 kg/m³. The apparent densities of the specimens produced by UR1 are lower than those produced by UoB (about 10%), due to the water content used during specimen’s production.
Pumice in combination with hemp powder lead to reduce the density of the plasters below the level of standard undercoat plaster. Typical undercoat clay plasters have a density class of 1.8 and 1.9 according to DIN 18947.
Tab. 28: Apparent density of clay plasters (mean of two specimens for UR1 and four for UoB) at 23 °C and
50 %HR Samples kg/m3 Apparent density UR1 Apparent density UoB H3 1399.86 6.01 1503.38 7.40 H5 1280.56 8.74 1377.56 3.76 H6 1287.98 14.79 1303.10 4.48
Large drying shrinkage appears during weight stabilization. Few cracks appears on the thinnest specimens surfaces but the shrinkage remains quite homogeneous and the integrity of the specimen is not reconsidered. All the UR1 specimens are dimensioned before drying and after drying to estimate accurately the final apparent density, ρ, the axial and volumetric shrinkages (Tab. 29). The right thickness of the thinnest specimens is measured drilling a hole from the specimen surfaces, after hygrothermal tests.
Axial shrinkage is major for the thickness for all formulations. The high reduction is nearly 2 mm for the 13 mm thickness specimens. Volumetric drying shrinkage versus specimen thickness is presented on Fig. 81. The volumetric variation due to drying cannot be neglected for all the formulations. The shrinkage decreases with the increase of the thickness of the specimen; but, while H3 and H5 present a similar evolution, it is less marked for H6 formulation. It appears to be attributed to the lowest percentage of hemp powder and highest pumice content.
4.2 Thermal properties
For UR1 specimens, the thermal conductivity is measured on 70 mm thick specimens with CTmeter, after stabilization at 23°C and 50%RH, and also at dry state. For UoB specimens, the thermal conductivity is measured on 15 mm thick specimens with ISOMET, after stabilization (28 days) at room temperature and 50%RH.
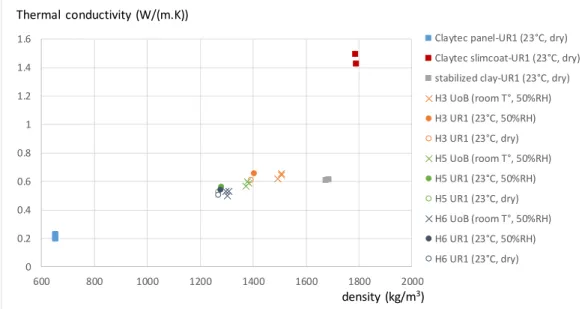
The data are presented in Tab. 4 and Tab. 5; the following figure shows the results (Fig. 82). The thermal conductivity of Claytec plaster ranges from 0.48 to 0.66 W/(m.K). It is clearly shown that H3 samples have the highest thermal conductivity of about 0.66 W/(m.K). H6 samples have the lowest thermal conductivity of around 0.52 W/(m.K). This may be due to the H6 samples having the lowest content of Earthen Clay binder (50%), while H3 and H5 have 57 % and 60 % of the Earthen Clay binder, respectively. The results of thermal conductivity measurement are in good agreement with that of density measurement: the thermal conductivity increases with density and water content. To decrease the thermal conductivity and optimize the insulation property of the clay plaster, another solution would be to add more vegetable aggregates in order to decrease the density. [Mazhoud 2017] [Busbridge 2009] with clay and hemp [Labat 2016] with clay and straw, [Al Rim 1999] with clay and wood, reached a thermal conductivity less than 0.08 W/(m.K) with a density less than 370 kg/m3, only by adding five times more vegetable particles.
Obtained data are compared with values obtained on other clay-based materials (data from Claytec, UR1 and [Mazhoud 2017]). Knowing that Claytec panel, Claytec slimcoat and tested clay-based plasters are realised with the same clay, a tendency for the evolution of thermal conductivity with density is clearly quoted. The measurement realised on stabilized clay UR1 (silt, kaolinite and illite) does not fit with the tendency, showing the interaction between the clay type and the thermal properties.
Analysing the results obtained for H3, H5 and H6, the effect of water content appears limited. The thermal conductivity increases by 7.3 to 8.7 % between dry state and humid state (23 °C, 50 %RH) (ie empty and full circles in Fig. 82), as the water content remains low.
The values of thermal conductivity performed on clay-based plaster by UR1 and by UoB, with different measurement methods, are in good agreement. 4.3 Hygric properties
UR1 and UoB tested MBV of the clay-based plasters H3, H5 and H6 according different protocols. Data are presented in Tab. 4 and Tab. 5. All the specimens showed similar moisture buffer values ranging between 1.25 and 1.62 g/(m².%RH). The MBV values obtained
by UR1 following Nordtest protocol on the three sample thicknesses are given Fig. 83. It appears that the MBV evolves quite linearly with the sample thickness, clearly showing that the depth of vapor penetration into the sample reaches the sealed bottom surface of the samples. This phenomenon is observed up to 70 mm of thickness. Higher thickness is then needed to avoid this phenomenon and to identify MBV representative of the material.
Tab. 29: Drying shrinkage measurements of clay plaster (mean of the two samples), UR1
Samples – thickness (cm) L/L mm/m L=Length W/W mm/m W=Width T/T mm/m T=Thickness V/V dm3/m3 V=Volume H3-1.3 8.6 0.4 202.6 211.7 H3-4 16.4 18.7 45.2 80.2 H3-7 3.36 21.5 43.9 68.8 H5-1.3 8.9 3.6 189.6 202.1 H5-4 23.6 19.6 50.4 93.6 H5-7 3.0 17.6 47.5 68.1 H6-1.3 6.9 0.8 123.8 131.5 H6-4 20.9 13.6 39.4 73.8 H6-7 -1.6 9.9 25.5 33.8
Fig. 81: Evolution of the relative volume vs initial thickness for the three Claytec Plasters, UR1.
Fig. 82: Evolution of the thermal conductivity vs density for Claytec Plasters. 0 50 100 150 200 250 0 1 2 3 4 5 6 7 8 H3 H5 H6 Relative volume (dm3/m3) Initial Thickness (cm) 0 0.2 0.4 0.6 0.8 1 1.2 1.4 1.6 600 800 1000 1200 1400 1600 1800 2000
Claytec panel-UR1 (23°C, dry) Claytec slimcoat-UR1 (23°C, dry) stabilized clay-UR1 (23°C, dry) H3 UoB (room T°, 50%RH) H3 UR1 (23°C, 50%RH) H3 UR1 (23°C, dry) H5 UoB (room T°, 50%RH) H5 UR1 (23°C, 50%RH) H5 UR1 (23°C, dry) H6 UoB (room T°, 50%RH) H6 UR1 (23°C, 50%RH) H6 UR1 (23°C, dry) Thermal conductivity (W/(m.K)) density (kg/m3)
Tab. 30: Thermal and hygric properties of tested specimens by UR1 Samples Thickness mm Apparent density kg/m3 Thermal Conductivity W/(m.K) CT Meter MBV g/(m².%RH)Nordtest Project Climatic chamber 0.021 m² H3 10.37 1422.50 0.658 1.29 38.20 1393.00 1.42 66.92 1398.43 1.47 H5 10.54 1336.59 0.561 1.33 39.40 1279.24 1.43 66.68 1274.25 1.48 H6 11.39 1249.35 0.540 1.25 38.43 1294.94 1.31 68.22 1273.30 1.37
Tab. 31: Properties of clay-based plaster studied by UoB
Samples Thickness mm Apparent density kg/m3 Thermal Conductivity W/(m.K) Isometer MBV - g/(m².%RH)
ISO standard Nordtest Project Climatic chamber 0.022 m² Climatic chamber 0.022m² DVS chamber 55 mm² H3 16.70 1506.64 0.6509 1.868 1.244 1.31 17.21 1505.48 0.6450 1.49 16.33 1492.50 0.6172 1.62 16.60 1508.92 1.58 H5 17.84 1382.09 0.5839 1.08 1.33 17.15 1378.35 0.5975 1.62 17.24 1373.01 0.5618 1.38 17.04 1376.81 H6 18.73 1297.08 0.5265 0.928 1.52 18.19 1306.80 0.5289 1.31 18.64 1302.31 0.4974 1.52 18.71 1306.21 1.50
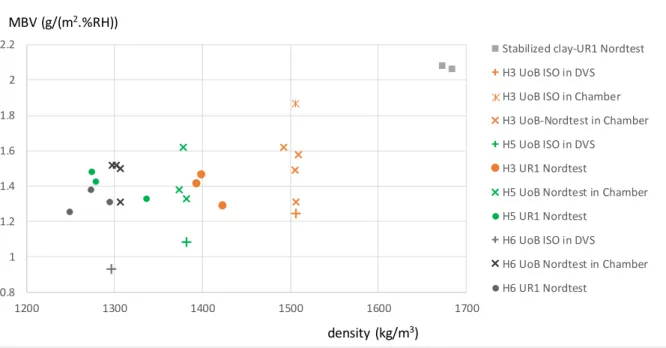
For all the thicknesses, the best MBV value is obtained with H5. MBV values of H6 are lower than those of H3 and H5 plasters. It appears to be attributed to the lowest percentage of hemp powder and highest pumice content in H6. The sample thickness clearly more influences the evolution of MBV than density (Fig.10). According to Nordtest protocol, all tested plasters are classified as good hygric regulators (MBV ranging between 1 and 2 g/(m2.%RH)) and few millimeters of plaster are sufficient to bring the main part of the performances.
Specimens tested by UoB with Nordtest protocol present larger density But it appears that the MBV obtained values are in the same range (Fig. 10).
In the case of UoB test performed on H3 with climatic chamber and ISO 24353 protocol, a noticeable increase of MBV (from 1.5 to 1.89 g/(m.%RH)) is quoted. Clearly, this result can be due to the difference in protocol (with longer exposure time at high RH) and to the change of initial water content distribution in the reused specimen. Specimens tested by UoB with ISO 24353 protocol with DVS are lower (Fig. 10) than values obtained with Nordtest protocol and lower than value obtained on H3 with climatic chamber. In the case of plaster formulated with small particles, the sample size usable with DVS device is sufficient to be higher than the elementary representative volume. The specimen is then representative of the tested material although the height
remain low regarding vapor penetration depth. More, MBV value obtained with the two protocols are not rigorously in concordances regarding the thickness influence. The vapor penetration depth regarding specimen high is not sufficient to explain the values evolution. Differences in air velocity in DVS device and climatic chambers around the specimen exchange surface contribute to drastically change the MBV. Comparison of MBV values obtained using DVS device and Nordtest or ISO protocols remains to be investigated.
As a comparison, MBV measurement performed on Claytec panel using Nordtest protocol leads to a MBV value of 2.31 g/(m2.%RH) for a panel density of 650 kg/m3. Tested clay-based plaster appears denser and less efficient than this Claytec panel ranging in excellent hygric regulator.
Fig. 83: Evolution of the MBV vs real sample thickness for Claytec Plasters, UR1.
Fig. 84: MBV measurements versus density realised by UR1 and UoB on Claytec plasters.
Fig. 85: Moisture buffering ability according to DIN 18947
The scientific community uses commonly Nordtest protocol to compare the moisture buffering of bio-based materials but the only validated standard for clay-based plaster in Europe is the DIN 18947. The DIN label is currently required for European markets entry. The DIN 18947 defines a procedure to evaluate the moisture buffering of a material based on the sorption type
measurement. The recording of mass change of a 1 m2 specimen surface exposed to a relative humidity change is realized during 12 h. Only one-step of RH is considered (without cycles). Sample of 15 mm thickness should be sealed and dried. Stabilization at 23 ± 2 °C and 5 ± 5% RH is reached when the mass variation is lower than 2 % for two consecutive weighing
1.20 1.25 1.30 1.35 1.40 1.45 1.50 0 1 2 3 4 5 6 7 8 H5 H3 H6 MBV (g/(m2.%RH) @ 8/16h) Thickness (cm) 0.8 1 1.2 1.4 1.6 1.8 2 2.2 1200 1300 1400 1500 1600 1700
Stabilized clay-UR1 Nordtest H3 UoB ISO in DVS H3 UoB ISO in Chamber H3 UoB-Nordtest in Chamber H5 UoB ISO in DVS
H3 UR1 Nordtest
H5 UoB Nordtest in Chamber H5 UR1 Nordtest
H6 UoB ISO in DVS
H6 UoB Nordtest in Chamber H6 UR1 Nordtest
MBV (g/(m2.%RH))
with 24 h time step. The sample is exposed to 80 ± 5% RH and the sample mass is measured after 0.5, 1, 3, 6 and 12 h with less than 0.01 g of accuracy. The evolution of sample mass increase in g/m2 versus time is compared to referent curves to evaluate the moisture buffering ability. The dotted lines in Fig. 11 characterize the classification of moisture buffering ability from the lowest class WS I to the highest class WS III. As examples, the blue colored curve describes the performance of uppercoat clay-based plaster with flax fiber, the red curve a mineral plaster composed from clay and sand, the others near WS III line represent different undercoat plasters with (grey curve) and without plant (lowest curve).
The first sorption step of MBV tests performed with Nordtest protocol can be used to evaluate the moisture buffering ability after 8 h using Fig. 11. For H3, H5 and H6, the increase of specimen mass ranges between 50 and 60 g/m2. Knowing that the DIN protocol imposed dryer initial state than Nordtest protocol, such performances give good reasons to expect a WS III classification according to DIN 18947 for all the tested clay-based plasters.
5 CONCLUSIONS
According to Nordtest protocol and classification, the three tested clay-based plasters are classified as good hygric regulators. A slight discrepancy appears between the three formulations (about 6.5 % for the in-use thickness).
The formula with the best thermal and shrinkage properties seems to be H6, probably due to the lower density. But this formula leads to the lower value of MBV. The shrinkage and MBV properties of H3 and H5 are close. The higher density of H3 leads to higher thermal conductivity.
Favoring the formula with higher MBV (H3 or H5) for plaster, the selected formula for Isobio demonstrators is H3 due to the higher content of bio-based aggregate and avoiding the addition of thermosilit (expansive load). More, this formula leads to a GWP and TEI optimization (Tab. 26).
Shrinkage of such plaster must be controlled. The use of a reinforcing mesh is then required.
The final plaster thickness (conventionally ranging between 10 and 20 mm) must be chosen in accordance with the plaster implementation methods. The slopes of the curves of the Fig. 9 are low and, consequently, MBV little evolves with thickness and reduced thickness of plaster can be considered.
Comparison of MBV results obtained by changing the protocol is full of interest. Discrepancy appears between Nordtest and ISO 24353 results. More systematic confrontations must be investigated.
Finally, using the first sorption step of MBV test realized with Nordtest protocol, it is possible to pre-estimate the expected WS classification according to DIN 18947. Modern building, residential, public and office buildings are characterized by low heat loss and air tightness with almost zero natural air exchange. Using clay plaster to improve the indoor climate optimizes the passive moisture regulation. The air exchange rates of modern building ventilation can be reduced and adjusted for optimal combination with the passive reaction of the clay plaster areas.
6 ACKNOWLEDGMENTS
This project has received funding from the European Union’s Horizon 2020 research and innovation program under grant agreement No. 636835 – The authors would like to thank them.
7 REFERENCES
[Al Rim 1999] Al Rim, K.; Ledhem, A.; Douzane, O.; Dheilly, R.M.; Queneudec, M.; Influence of the proportion of wood on the thermal and mechanical performances of clay-cement-wood composites. Cement and Concrete Composites 21, 269–276. [Busbridge 2009] Busbridge, R.; Hemp-Clay: an initial investigation into the thermal, structural and environmental credentials of monolithic clay and hemp walls. (Centre for Alternative Technology, UK and School of Computing and Technology University of East London, UK,).
[Colson 2017] Colson V.; Le Cunff T.; Jadeau O.; Lanos C.; Industrial scale-up of bio-based insulating panel production. 2nd International Conference on Bio-based Building Materials, Clermont-Ferrand, France, 2017; ISBN: 978-2-35158-192-6.
[DIN 18947 2013] DIN 18947; Earthplasters - Terms and definitions, requirements, test methods. 2013-08. [ISO 24353 2008] ISO 24353: Hygrothermal performance of building materials and products - Determination of moisture adsorption/desorption properties in response to humidity variation. 2008-09. [Labat 2016] Labat, M.; Magniont, C.; Oudhof, N.; Aubert, J.-E.; The experimental characterization of the hygrothermal properties of straw-clay mixtures to the numerical assessment of their buffering potential. Building and Environment 97, 69–81.
[Mazhoud 2017] Mazhoud B.; Collet F.; Prétot S.; Lanos
C.; Development and hygric and thermal
characterization of hemp-clay composite. European Journal of Environmental and Civil Engineering; DOI: 10.1080/19648189.2017.1327894
[Rode 2005] Rode, C.; Moisture buffering of Building Materials. Report BYG•DTU R-126, ISSN 1601 – 2917, ISBN 87-7877-195.
[Viel 2017] Viel M.; Collet F.; Lanos C.; Thermal insulation materials from renewable resources: Thermal and hygric performances. 2nd International Conference on Bio-based Building Materials, Clermont-Ferrand, France, 2017; ISBN: 978-2-35158-192-6.

![Fig. 80: Nordtest project classification [Rode 2005].](https://thumb-eu.123doks.com/thumbv2/123doknet/14750791.580056/4.892.116.427.147.326/fig-nordtest-project-classification-rode.webp)