MIT
ICAT
MIT
ICAT
APPROACHES TO ENHANCE DRIVER
SITUATIONAL ASSESSMENT AIDS
Eric M. Jones and R. John Hansman
Report No. ICAT-2007-3
September 2007
MIT International Center for Air Transportation
Department of Aeronautics & Astronautics
Massachusetts Institute of Technology
Approaches to Enhance Driver Situational Assessment Aids
by
Eric M. Jones and R. John Hansman, Jr.
Abstract
Collision warning systems encounter a fundamental trade-off between providing the driver more time in which to respond and alerting the driver unnecessarily. The probability that a driver successfully avoids a hazard increases as the driver is provided more time and distance in which to identify the hazard and execute the most effective response. However, alerting the driver at earlier, more conservative thresholds
increases the probability that the alerts are unnecessary, either because sensor error has falsely identified a hazard or because the environment has changed such that a hazard is no longer a threat. Frequent unnecessary alerts degrade alert effectiveness by
reducing trust in the system. The human-factors issues pertaining to a forward collision warning system (FCWS) were analyzed using an Integrated Human-Centered Systems approach, from which two design features were proposed: multi-stage alerting, which alerts the driver at a conservative early threshold, in addition to a more serious late threshold; and directional alerting, which provides the driver information regarding the location of the hazard that prompted the alert activation. Alerting the driver earlier increases the probability of a successful response by conditioning the driver to respond more effectively if and when evasive action is necessary. Directional alerting decreases the amount of time required to identify the hazard, while promoting trust in the system by informing the driver of the cause of the alert activation. The proposed design
features were incorporated into three FCWS configurations, and an experiment was conducted in which drivers were equipped with the systems and placed in situations in which a collision would occur if they did not respond. Drivers who were equipped with multi-stage and directional alerting were more effective at avoiding hazardous situations than drivers who were not provided early alerting. Drivers with early alerting tended to respond earlier and more consistently, which promoted more
successful responses. Subjective feedback indicates that drivers experienced high levels of acceptance, confidence, and trust in multi-stage and directional alerting.
This document is based on the thesis of Eric M. Jones, which was submitted to the Department of Aeronautics and Astronautics at the Massachusetts Institute of Technology in partial fulfillment of the requirements for the degree of Master of Science in Aeronautics and Astronautics.
Acknowledgements
This work was funded by a grant provided through the Ford-MIT Alliance. Louis Tijerina, Dev Kochhar, and Jeffrey Rupp acted as technical sponsors and provided generous amounts of support, feedback, and assistance.
A portion of this research was performed at the Research and Innovation center at Ford Motor Company, Dearborn. The authors would like to thank everyone within the Active Safety Department and Advanced Vehicle Technology building 5 for their kind hospitality and valuable insight.
Table of Contents
Abstract...3 Acknowledgements...5 Table of Contents...7 List of Figures...9 List of Tables... 13 1. Introduction... 15 2. Methodology... 182.1. Integrated Human-Centered Systems Approach...18
2.2. System Model...19
2.3. Information Requirements...23
2.4. Kinematic Assessment...25
2.4.1. Example: Stopped Object on a Highway...28
2.4.2. Time-to-Collision Alerting Thresholds...31
2.4.3. The System Operating Characteristic Curve...33
2.5. Proposed Design Features...35
2.5.1. Multiple-Stage Alerting...35 2.5.2. Directional Alerting...37 3. Experimentation... 39 3.1. Hypotheses...40 3.2. Experimental Design...41 3.3. FCWS Configurations...42 3.3.1. Alerting Displays...42 3.3.2. Alerting Thresholds...44 3.4. Simulated Environment...44
3.4.1. Simulated Vehicle and Driving Environment...44
3.4.2. Controlled FCWS Activations...45 3.5. Participants...48 3.6. Experimental Procedure...48 3.6.1. Training Session...48 3.6.2. Testing Sessions...49 3.6.3. Secondary Tasks...50 3.6.4. Follow-up Briefing...52 3.7. Apparatus...52
4. Results and Discussion... 54
4.1. Effectiveness...54
4.2. Response Times and Behavior...64
4.2.1. Velocity Profiles...67
4.2.2. Relative Velocity vs. Range Profiles...69
4.3. The Naïve Response...71
4.4. Secondary Task Performance...73
4.4.1. Map-Reading...73
4.4.2. Police Officer Identification...74
4.4.3. Maintaining Speed...75
5. Conclusions... 85
6. References... 88
Appendix A: Treatment Summary... 91
Testing Scenario Treatments...91
Training Scenario Treatments...92
Appendix B: Threat Event Illustrations... 93
Training Scenario Threat Event...93
Testing Scenario Threat Events...93
List of Figures
Figure 2-1: General FCWS closed loop feedback process...20
Figure 2-2: Detailed FCWS closed loop feedback process...21
Figure 2-3: Examples of intent states; all describe ways in which the system dynamics can change...24
Figure 2-4: An example state-space representation of collision avoidance (braking to stop)...26
Figure 2-5: An example state-space representation of collision avoidance (steering to avoid)...26
Figure 2-6: An example state-space representation, including a notional alerting threshold...27
Figure 2-7: A simplified representation of an example steering response...29
Figure 2-8: Example: braking maneuvering limits for response times of 1.5, 3.0, and 6.0 seconds...30
Figure 2-9: Example: steering maneuver limits for response times of 1.5, 3.0, and 6.0 seconds...30
Figure 2-10: Example braking maneuver limits and corresponding notional alerting thresholds...32
Figure 2-11: Example steering maneuver limits and corresponding notional alerting thresholds...32
Figure 2-12: An example SOC curve...33
Figure 2-13: Various degrees of system benefit as expressed by the SOC curve...34
Figure 2-14: An SOC curve representation of the benefits of multi-stage alerting...36
Figure 2-15: An example implementation of a multi-stage alerting configuration...36
Figure 2-16: An example implementation of multi-stage directional alerting (1 of 3); locational stimulus highlights objects in the environment (diamond and octagon on windshield)...38
Figure 2-17: An example implementation of multi-stage directional alerting (2 of 3)...38
Figure 2-18: An example implementation of multi-stage directional alerting (3 of 3)...39
Figure 3-1: The experimental design: 1 fixed factor across 4 levels, representing 4 treatments...41
Figure 3-2: The late alert display (without the audio)...43
Figure 3-3: The Early Non-Directional system configuration with (right) and without the late alert...43
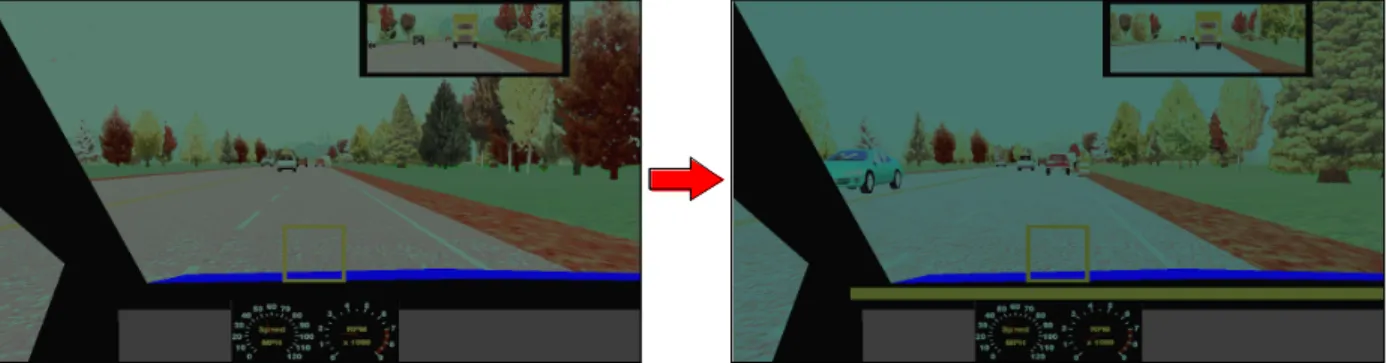
Figure 3-4: The Early Directional system configuration with (right) and without the late alert...43
Figure 3-5: TE2 example illustration: Oncoming vehicle turns left in front of the driver...47
Figure 3-6: TE6 example illustration: With an accident in the left-hand lane, an ambulance crosses the road from the right...47
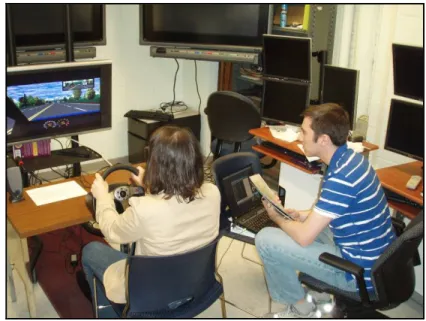
Figure 3-9: The positions of the subject and investigator...53
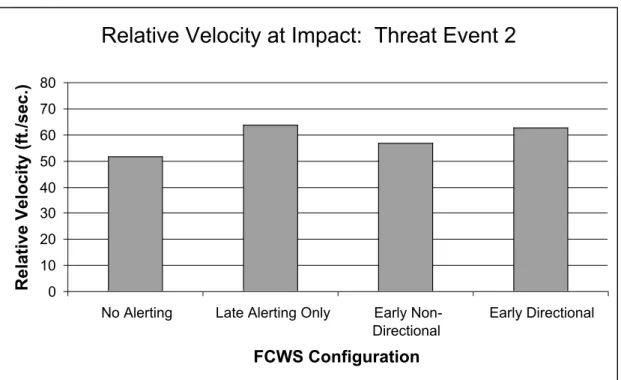
Figure 4-1: Relative velocity at impact for collisions that occurred during TE2...58
Figure 4-2: Relative velocity at impact for collisions that occurred during TE4...58
Figure 4-3: Minimum range with respect to the target vehicle...63
Figure 4-4: Response times with respect to the target vehicle...66
Figure 4-5: Velocity profile for TE2 (key to the right)...68
Figure 4-6: Velocity profile for TE4...68
Figure 4-7: Relative velocity vs. range plot for TE2...70
Figure 4-8: Relative velocity vs. range plot for TE4...70
Figure 4-9: Relative velocity vs. range plot for TE8...71
Figure 4-10: Relative velocity vs. range plot for the training scenario threat event (naïve response)...73
Figure 4-11: Map-reading task completion times...74
Figure 4-12: Example: accelerator input during unnecessary alert activations; first exposure to the Early Directional FCWS (1 of 2)...76
Figure 4-13: Example: accelerator input during unnecessary alert activations; first exposure to the Early Directional FCWS (2 of 2)...76
Figure 4-14: Example: accelerator input during unnecessary alert activations; first exposure to the Early Non-Directional FCWS (1 of 2)...77
Figure 4-15: Example: accelerator input during unnecessary alert activations; first exposure to the Early Non-Directional FCWS (2 of 2)...77
Figure 4-16: Subjective rating of the usefulness of early alerting...78
Figure 4-17: Percentages of subjects who thought early alerting was useful, not useful, or were unsure...79
Figure 4-18: Subjective confidence ratings for each of the alerting systems...80
Figure 4-19: Percentage of subjects who were confident in the Early Directional system configuration, not confident, or were unsure...80
Figure 4-20: Percentage of subjects who were confident in the Early Non-Directional system configuration, not confident, or were unsure...81
Figure 4-21: Percentage of subjects who were confident in the Late Alerting Only system configuration, not confident, or were unsure...82
Figure 4-22: Percentage of subjects' system configuration preferences...82
Figure 4-23: Percentage of subjects who would prefer to own a FCWS, would not prefer to own one, or were unsure...83
Figure 4-24: Percentage of subjects' system configuration preferences of those who would prefer to own a FCWS...84
Figure B-1: Training Threat Event: a lead vehicle pulls off the road to uncover a stopped vehicle in the driver's lane...93
Figure B-2: Threat Event 1: Construction blocking the driver's lane...93
Figure B-3: Threat Event 2: Oncoming vehicle turning left in front of the driver...94
Figure B-4: Threat Event 3: Initially stopped vehicle pulls into the driver's lane...94
Figure B-6: Threat Event 5: A cyclist enters the driver's lane...95
Figure B-7: Threat Event 6: With an accident in the left-hand lane, an ambulance crosses the road from the right...96
Figure B-8: Threat Event 7: An initially stopped vehicle makes a right-hand turn into the driver's lane...96
Figure B-9: Threat Event 8: A lead vehicle decelerates because of slow-moving traffic up ahead...97
Figure C-1: Subject gender distribution...98
Figure C-2: Subject age distribution...98
List of Tables
Table 2-1: Alerting threshold TTC values for 1.5, 3.0, and 6.0 second response times for evasive braking and steering maneuvers for an assumed maximum initial
speed of 60 mph...31
Table 4-1: Threat event outcome summary (key below)...56
Table 4-2: Target vehicle collisions for each system configuration...57
Table 4-3: Late alert threshold crossings, with respect to the target vehicle...59
Table 4-4: Collision avoidance effectiveness, with respect to the target vehicle...60
Table 4-5: Target and non-target collisions, as a percentage of the total number of hazards...60
Table 4-6: Late alert threshold crossings for each system configuration, as a percentage of the total number of target and non-target hazards...61
Table 4-7: Collision avoidance effectiveness, with respect to target and non-target hazards...61
Table 4-8: Late alert threshold crossings (given early alert threshold crossings), necessary early alerts, and system effectiveness...62
Table 4-9: Early responses, with respect to the target vehicle...64
Table 4-10: Undefined response times...65
Table 4-11: Type of first response during the threat events, expressed as percentage of the total number of responses...66
Table 4-12: Training scenario threat event outcomes (naïve response) (key to the right). ...72
Table 4-13: Number of correct police officer identifications...75
Table 4-14: Unnecessary early alert activations...77
Table A-1: Testing scenario treatment order (key below)...91
1. Introduction
Each year, approximately 40 thousand people in the United States lose their lives because of automobile accidents, an average that has remained steady for decades despite technological advances in motor vehicle safety [1, 2]. Passive safety systems such as seat belts and air bags effectively reduce the severity of injuries that result from collisions, but they are limited to mitigating the aftermath of dangerous situations that may have already injured the driver. To reduce the number of motor vehicle collisions, injuries, and fatalities, research efforts have been developing active safety systems that aim to prevent accidents from occurring altogether.
Current active safety systems focus predominantly on driver warnings and vehicle control; for example, electronic stability systems and anti-lock brakes that prevent the driver from losing control of the vehicle during a turning or braking
maneuver. Warning lights mounted on mirrors can indicate the presence of a vehicle in a blind spot, and lane departure warnings can alert the driver if an unintentional lane change is detected. There are also systems that control the vehicle automatically, such as adaptive cruise control which monitors and adjusts speed to match the traffic in the driver’s lane and collision mitigation by braking which reduces vehicle speed when a collision appears imminent. Unlike automated systems and simple warnings, collision warning systems operate concurrently with the driver to provide alerts that support awareness and assessment of potential hazards in order to avoid undesirable incidents [3].
Over 1.8 million rear-end collisions were reported in 2005, comprising the largest segment of crashes (29.6%) as well as the most common crash that exclusively damages property (30.4%) [1]. In addition to being the most frequent and most costly type of accident, rear-end collisions are also the most preventable, assuming that the driver ultimately has control of the vehicle’s speed and trajectory. The frequency and
preventability of these collisions suggests that a collision warning system that alerts the driver to hazards in front of the vehicle will provide the greatest opportunity for
reducing the number of accidents. Estimates claim such a system could eliminate 37% to 74% of rear-end collisions [4], but there is an even greater opportunity for reducing the accident rate when considering other situations in which a driver may inadvertently
A forward collision warning system (FCWS) is a collision warning system that focuses solely on the environment in front of the driver’s vehicle. An alerting threshold is a set of criteria that defines when the FCWS will issue an alert, which is typically based on the system state, or the “complete set of parameters that define the dynamics of a hazard situation” [5]. For the purposes of this thesis, a hazard is defined as anything in the environment with which the driver’s vehicle will collide if the velocities of the vehicle and of the hazard were to remain constant at any point in time. A hazard in the forward environment includes anything that can intersect the vehicle’s forward
trajectory, such as static objects into which the vehicle can be driven, as well as moving hazards that may enter the vehicle’s path.
Conservative alerting thresholds alert the driver well in advance of a collision, which increases the likelihood of a successful outcome. However, increasing the amount of time or distance between the driver’s vehicle and the hazard increases the probability that the alert is unnecessary. An unnecessary, or nuisance, alert does not change the driver’s awareness; i.e., the probability that the driver successfully avoids the hazard is independent from having received the alert [5]. Sensor performance degrades at increased range, which decreases the accuracy with which hazards are detected. For example, an inaccurate detection of a roadside hazard could incorrectly indicate that it is in the driver’s lane. The surrounding environment also changes rapidly, and predictions of state at conservative thresholds are frequently incorrect because the environment evolves such that the relative dynamic states between the vehicle and the hazard do not warrant an alert activation. For example, the driver may pass a stationary object along the side of the road while turning, which will not present a hazard if the vehicle continues to turn; but during the fraction of a second in which the vehicle is pointed towards the object, a simple collision warning algorithm would determine the vehicle’s instantaneous forward trajectory, calculate a potential collision, and activate unnecessarily. The object would have been avoided if the alert had not been issued; however, a collision would have occurred if the vehicle had maintained that trajectory. On the other hand, if the object was a moving vehicle in the opposite lane, the system would have to infer what the other vehicle was going to do in the future. Even if the states of the environment are measured perfectly, there will be situations in which the FCWS will unnecessarily alert the driver because of the uncertainty that permeates the external environment and the activity other vehicles.
Frequent unnecessary alerts will degrade the driver’s trust in the system (this is sometimes referred to as the cry-wolf effect), but setting the threshold too close to an impending collision will reduce alert effectiveness by decreasing the available time and distance in which to respond. The frequency of nuisance alerts may annoy the driver to the point of distraction, particularly if the FCWS interface is invasive. Driving
incorporates many cognitively intensive tasks, and a mistimed alarm (especially an unnecessary one) may exacerbate a dangerous situation by increasing the driver’s cognitive workload. Similarly, alerting at an inopportune time may incite evasive behavior that could cascade into a more serious situation. Consideration of these human factors issues indicates a delicate, temporal balance of information that
contributes to the overall success of a collision warning system. The goal of this thesis is to examine the system from a human-centered perspective in order to design and evaluate situational assessment aids that enhance the effectiveness of a FCWS.
The success of an alert is largely dependent on the driver’s response time, i.e., the amount of time needed to assess the situation and, if necessary, perform an evasive maneuver. Supporting the driver’s awareness of the environment and providing more time to make an assessment will increase the probability that the driver will respond quickly and effectively. However, there is a fundamental tradeoff between providing the driver more time in which to react, and alerting the driver unnecessarily.
Conservative alerting thresholds provide the driver more time and distance in which to make an assessment, but alerting farther in advance increases the probability that the alert will not be necessary. Unnecessary alerts decrease the driver’s trust in the system, which increases reaction time by provoking skeptical behavior that compels the driver to verify that the cause of the alert is reason for concern. Response time increases if the driver must identify a hazard that lacks salience, especially if the driver is initially distracted and has not been monitoring changes in the environment.
Two situational assessment aids are proposed to enhance the effectiveness of a collision warning system: multi-stage alerting, which alerts the driver at an earlier, conservative threshold in addition to a more serious late alert; and directional alerting, which provides the driver information regarding the location of the hazard that prompted the alert activation. The probability that a hazard is successfully avoided increases as the driver’s response time decreases. Providing the driver more time in
which to choose the most appropriate response. Multi-stage alerting alerts the driver at earlier, more conservative thresholds, thereby informing a potentially distracted or unaware driver that there is hazard that may require further attention if the situation becomes progressively more dangerous. This advanced notice conditions the driver to respond more effectively if the hazard becomes more serious, because more time is provided to formulate a response. Even if the conservative alert is unnecessary, the driver will be more tolerant of the increased frequency of nuisance alerts if he or she understands why they were provided. Directional alerting maintains trust in the system by directing the driver’s attention to the hazard that caused the alert to activate. Directional alerting also decreases response time by increasing hazard salience, which decreases the amount of time needed to identify the hazard.
An experiment was conducted to examine the potential benefits of multi-stage and directional alerting. Basic multiple threshold and directional alerting displays were emulated within a driving simulator, and assembled to form collision warning system configurations with multi-stage and directional alerting. Test subjects were equipped with various system configurations, and asked to drive through scenarios in which they were presented with hazardous events that would result in a collision if no response was made. The events were engineered to incorporate similar dynamics, but appeared to the driver in various forms to allay suspicion and preserve his or her candid
response. Driver performance within the testing scenarios was then analyzed to examine differences amongst the collision warning system configurations.
2. Methodology
2.1. Integrated Human-Centered Systems Approach
The Integrated Human-Centered Systems (IHCS) approach is a tool that combines human factors and systems engineering concepts in order to “evaluate
allocation of capability and responsibility between the human and other components of the information systems…” while simultaneously considering the environment in which the system operates [6]. The basic steps of the IHCS approach are as follows:
1. Model the system and operator(s) as a closed-loop feedback process. 2. Determine the information that the operator requires to perform the task.
3. Use the information requirements to determine the display/automation requirements.
4. Develop prototype systems. 5. Perform simulation evaluations. 6. Integrated simulation testing. 7. System evaluation.
8. Field development phase.
The thesis will focus on steps 1 through 5 as applied to the design of a FCWS.
Simulated testing was performed, but the design concepts have not been introduced into a field setting.
Previously, the IHCS approach has been used to evaluate aeronautical
applications that involve complex flows of information amidst human operators, such as air traffic management and aircraft collision avoidance systems [6]. The automotive domain is similar in that the driver must navigate the vehicle safely through a
hazardous, rapidly changing environment. There are differences, however, which put the driving environment at a disadvantage. The density of motor vehicles on a
roadway is higher than that of aircraft within airspace. This proximity increases the speed with which a seemingly harmless situation can propagate into a hazardous one. The design of a FCWS must account for the dynamic constraints imposed by this proximity. For example, a situation will degrade more rapidly when a hazard is closer to the driver, which increases the risk of response time exceeding the amount of time that is available before a collision occurs. This supports the need to decrease the driver’s response time, or alert the driver earlier, in order to ensure a successful avoidance.
2.2. System Model
The FCWS generalized system model is comprised of blocks that correspond to system elements and arrows that represent directional flows of either sensory or control
Vehicle
Environment
Driver
HMI Sensors Sensors FCWS Controls Perception Displays Perception Potential Hazards TrajectoryFigure 2-1: General FCWS closed loop feedback process.
The three main components are defined as the driver, the driver’s vehicle, and the
surrounding environment (a similar model is seen in [7]). The FCWS is contained within the vehicle, and is equipped with sensors that measure the state of the environment, as well as a human-machine interface (HMI) that displays information to the driver. The driver perceives information from the environment, the FCWS interface, and the vehicle. The vehicle is controlled by the driver and information from the environment is processed through the FCWS sensors. In Figure 2-2, the general model is expanded to include a finer resolution of internal processes.
Vehicle
Driver
Decisions Automaticity Crash Mitigation Algorithms Situation Assessment Hazard Prioritization Hazard Identification Escape Identification Active Goals Situation Awareness Comprehension FCWS Alert State Sensor Data Pre-Processing Alerting AlgorithmsMeasure System State
Prediction Alert State Selection Road/Visibility Conditions Moving Objects Stationary Objects Intent States
Environment
Driver’s Mental Model Perception Execution Driver Controls Hazard Assessment Projection Vehicle Displays FCWS Sensors Powered/AutomatedSystems SystemsManual
FCWS
Trajectory Potential Hazards
Perception
Perception
Displays
Controls
Figure 2-2: Detailed FCWS closed loop feedback process.
The driver’s internal model is constructed with emphasis on the processes that reflect the integrated FCWS: the driver’s awareness of the states of other system
elements (situation awareness), and the assessment of potential hazards identified by the collision warning system (situation assessment). Situation awareness (SA), according to [8], is the “the perception of the elements in the environment …, the comprehension of their meaning and the projection of their status in the near future” [9, 10]. SA is a diffuse information seeking process that influences decisions and active goals with knowledge of the current system states and how those states are changing. For
example, as highlighted in the model, the driver must be aware of the state of the FCWS alerts. On the other hand, situation assessment is a directed information seeking
process—upon receiving an alert, the driver verifies that a hazard exists, assesses the seriousness of the hazard, and, if necessary, identifies a potential escape maneuver. If
the FCWS issues more than one alert, the driver will have to prioritize his or her attention assuming that multiple hazards cannot be neutralized simultaneously.
The driver perceives information from a variety of sources, including sensory information from the environment and the in-vehicle displays, as well as feedback from control actions and the movement the vehicle. The driver’s assessments can influence how information is perceived from the environment, such as where the driver is
choosing to focus his or her attention. This assessment can also impact the awareness of perceived stimuli. Awareness and assessment both feed into the driver’s active goals (which describe what the driving is currently planning to do), subsequently influencing his or her mental model. The mental model underlies all the cognitive processes, and encompasses the expectancies and schemata with which perceived information is interpreted and decisions are assessed. Active goals and SA influence decisions, which lead to the execution of those decisions. Automaticity refers to immediate, instinctual responses to stimuli that bypass the driver’s cognitive processes [9].
The state of the environment is expressed within general categories that emphasize the position of the road and the states of objects both on and off the roadway. Road and visibility conditions may affect the vehicle’s ability to stop (icy roads) or see vehicles up ahead (blind turns and hills). Hazards could be moving, such as other vehicles or pedestrians, or they could be stopped. Stopped hazards can have the potential to move (parked cars, standing pedestrians), or they could remain stationary (signs, road structures such as highway overpasses). The states of these environmental elements are perceived by the driver and the FCWS sensors, and continually change in relation to the vehicle’s trajectory.
The information received by vehicle’s FCWS sensors must first be pre-processed before it can be used by the alerting algorithms. The algorithms must determine the current state of the system, and then predict how those states will change. If the current state and/or prediction have crossed an alerting threshold, the alert state is then
selected. In future implementations, the vehicle may be equipped with automated crash mitigation systems. Information from the alerting algorithms is displayed
through the FCWS interface such as the alert state, current system state, and algorithm predictions. The vehicle displays provide the driver with feedback regarding control actions as well.
2.3. Information Requirements
With the system model specified, further examination reveals information that is required by the driver in order to use the FCWS effectively. Likewise, the collision warning system requires certain knowledge of the system state in order to alert the driver. By understanding the informational needs of both the driver and the FCWS, new opportunities for enhancing driver support are identified.
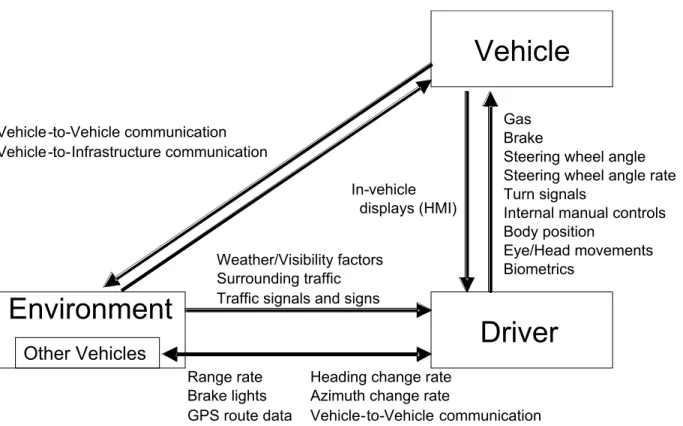
As the respective states of the driver, vehicle, and environment change, there are signals and processes that communicate the future state of each element. These intent states (Figure 2-3) do not necessarily communicate the dynamic states (position, velocity, and acceleration), but rather target states, intended trajectories, and
destinations. For example, brake lights may indicate that a lead vehicle is intending to decrease its current speed, but they do not communicate the magnitude of deceleration. Additional intent states that the driver may associate with other vehicles include
changes in relative position (range rate, azimuth change rate) and actions that convey an intended path (heading change rate, turn signals). Likewise, the driver’s vehicle conveys this information to other vehicles as well. There are also situations in which the environment can indicate intended changes in the dynamic states of other vehicles, such as road signs and signals, the speed and position of surrounding vehicles, and other elements which influence the flow of traffic.
Intended trajectories can be inferred from the driver’s control actions (activating turn signals before changing lanes), while biometric data can indicate physiological states (such as fatigue or stress) and driver awareness (head position and movement). The intent states of the vehicle are communicated to the driver through the vehicle displays. In a future FCWS implementation, advanced communication systems may make this information available to other vehicles, as well as intelligent highway systems.
Gas Brake
Steering wheel angle Steering wheel angle rate Turn signals
Internal manual controls Body position
Eye/Head movements Biometrics
Range rate Heading change rate Brake lights Azimuth change rate
GPS route data Vehicle-to-Vehicle communication In-vehicle
displays (HMI)
Other Vehicles
Weather/Visibility factors Surrounding traffic Traffic signals and signs Vehicle-to-Vehicle communication
Vehicle-to-Infrastructure communication
Driver
Vehicle
Environment
Figure 2-3: Examples of intent states; all describe ways in which the system dynamics can change.
For a system to warn the driver of potential hazards, it must be able to accurately detect those hazards within the environment. Sophisticated sensing technologies have existed for decades, but it was not until recently that these sensors have been made accessible to automobiles. Researchers have been exploring the potential applications of radar ([11-16]) and image-based systems ([17-19]) for object detection and identification. There are also technologies that rely on thermal imaging, particularly for detecting pedestrians or wild animals [20-22]. Vehicle and pedestrian detection is also being attempted through laserscanning [23-25]. Some of the more robust systems, however, are combined sensor suites [26, 27]. Selecting sensors and evaluating their effectiveness within an operating environment is beyond the scope of this thesis; however, given these observed technological trends, and for the purposes of this study, certain information is assumed to be available.
In order to help the driver avoid objects that could potentially intersect his or her path, these sensors must be able to detect the dynamic states of objects in the
environment. Current position relative to the driver’s vehicle is defined by range and azimuthal angle, while speed and acceleration vectors are derived from these values as they change over time. In a real-world implementation, the accuracy of these values
decreases as the distance to the hazard increases. Attempting to detect hazards at farther ranges will increase the number of false-positive identifications. False-positive alerts are unnecessary because no hazard is present in the environment. Regardless of what the driver chooses to do, no collision will occur with the cause of the alert
activation.
When the FCWS issues an alert, the driver needs to understand what the alert is suggesting and the reason this suggestion was made. The alert stimulus must first be perceived through the interface, as well as information regarding the corresponding state. For example, the state of the alert could be binary (on or off), or it could consist of multiple thresholds which correspond to a range of system states. In either case, the driver needs to understand the circumstances that caused the alerting system to activate. The driver is typically monitoring the environment for hazards, and must therefore integrate this new information into the ongoing driving process. The driver may have already been aware of the hazard, in which case the alert is redundant, or the hazard was not detected by the driver, in which case the driver must decide whether or not the source of the alert must be verified. If the driver trusts the system, then it may not be necessary to understand why the alert was issued; otherwise, the driver must then identify the location of the hazard by visually scanning the environment or by using information provided through the FCWS display. If necessary, an evasive course of action is chosen and executed, after which the driver recovers from the incident.
2.4. Kinematic Assessment
The display/automation requirements must account for the dynamic constraints of the system elements. Time is a limiting factor when alerting the driver: if collisions are to be avoided, alerts must be provided early enough for the driver to respond appropriately. The state-space representation proposed by [5] more clearly illustrates this concept (Figures 2-4, 2-5).
Relative Velocity
Range
A
B
C
Ex. Braking
Maneuvering Limit
Collision
Figure 2-4: An example state-space representation of collision avoidance (braking to stop).
Relative Velocity
Range
A
B
C
Collision
Ex. Steering
Maneuvering Limit
Figure 2-5: An example state-space representation of collision avoidance (steering to avoid).
Each axis corresponds to a variable that describes a relative dynamic state of the system, such as range (distance from the hazard) or relative velocity (range rate of change). The vehicle state is represented as a location within the state-space defined by these two variables, and state trajectories describe the vehicle’s change in location over time. The hazard space is a region in which, if entered, a collision will occur—in this case, when range equals 0. The maneuvering limit is a region in which, if entered, the vehicle will
unavoidably cross into the hazard space (trajectories A and B). For example, a vehicle that does not begin braking or turning at a sufficient range will ultimately collide with the hazard depending on their respective inertial constraints. Relative velocity at impact and the severity of the collision may be reduced, but an accident will still occur (trajectory B). The inertial constraints and the chosen evasive maneuver will dictate the shape of the boundary: in Figure 2-4, stopping distance is proportional to the square of the relative velocity, thus forming the parabolic curve; in Figure 2-5, assuming that the amount of time to make an evasive steering maneuver is constant, the distance over which the maneuver is performed increases linearly with speed. A driver whose evasive maneuver does not surpass the maneuver limit will successfully avoid the hazard (trajectory C). Successful avoidance is defined as the moment when relative velocity reaches zero before a collision has occurred. At this point, range is no longer decreasing and an infinite amount of time remains before a collision.
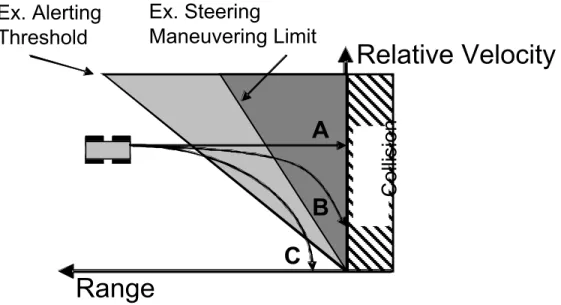
Alerting thresholds and the maneuvering limit are defined similarly, in that both specify a boundary that describes a particular set of dynamic states (Figure 2-6).
Because the alert is designed to help the driver avoid collisions, the threshold is set so that the driver will be alerted prior to reaching the maneuver limit—how much prior is a design issue. For the FCWS, timely alerts must be available for all manner of potential forward collisions, from the most typical, to the most (reasonably) extreme.
Relative Velocity
Range
A
B
Ex. Alerting
Threshold
C
Ex. Steering
Maneuvering Limit
Collision
2.4.1. Example: Stopped Object on a Highway
Consider a stopped object on a highway, such as another vehicle or piece of debris. Assume that the driver’s vehicle is traveling at 60 mph (88 ft./sec.) and can decelerate at 0.8 g’s (25.8 ft./sec.2
). Assume that there is no opportunity to steer around the hazard, and the driver is forced to come to a complete stop. Equations 1 through 3 are derived from simple kinematics:
a
v
t
initial stop=
d
v
2
a
2 initial stop⋅
=
stop reaction initial maneuverv
t
d
d
=
⋅
+
According to Equation 1, the driver will decelerate to a stop in 3.4 seconds (tstop). This is the maneuvering limit—if the driver begins braking when a collision will occur in less than 3.4 seconds, there will not be enough time to stop and avoid the accident. The alerting threshold must also provide the driver enough time to assess and respond to the alert prior to performing the stop. The time required to make an assessment is not known, but as mentioned in Chapter 1, the reaction time is influenced by trust in the FCWS, driver distractions, and the salience of the hazard. Assuming the driver makes a rapid assessment, response time is assumed to be 1.5 seconds (treaction) [28]. If lack of trust prompts the driver to verify the hazard, response time will increase with this assessment. Likewise, if the hazard is not salient, the driver will require more time to identify the hazard. The best-case scenario already shows that the evasive maneuver will take 4.9 seconds and a distance of 284 feet (with an additional 88 feet added for every second needed to assess the alert, according to Equation 3).
Now, instead of decelerating to a stop, suppose the driver imparts a lateral acceleration of 0.5 g’s (16.1 ft./sec.2
) and steers around the hazard. If the hazard is approximately the size of another vehicle, assume that the driver must move laterally 10 feet to avoid an accident. Figure 2-7 shows a simplified representation of the steering response.
(1)
)
(2)
(3)
)
2 steer lateral
t
a
2
1
y ?
10 ft.
?
steer reaction?
initialt
t
v
x
?
?
?
Figure 2-7: A simplified representation of an example steering response.
The y-axis corresponds to the vehicle’s lateral position and the x-axis corresponds to the range, both with respect to the hazard. The lateral maneuver will require 1.1 seconds, and in that time, the driver will have traveled 97 feet closer to the hazard (assuming forward velocity is constant). Assuming a response time of 1.5 seconds, the lateral maneuver will take 2.6 seconds and 229 feet, saving both time and distance when compared to the stopping maneuver. Steering around the hazard is a better option because it can be completed faster, but it is only effective if necessary space is available. Alerting earlier provides more time in which to assess a situation, which supports the awareness of the surrounding environment and assists the driver in choosing the best evasive maneuver.
This example scenario is not comprehensive but illustrative of the limits to which the FCWS must be designed. Drivers may, in fact, respond more mildly than the
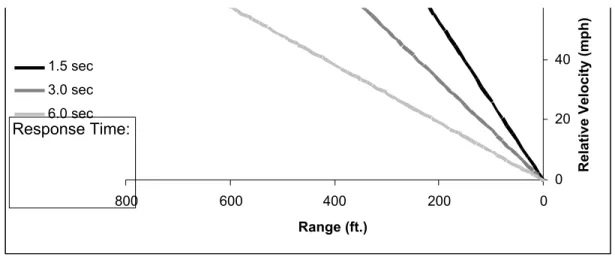
assumed acceleration and deceleration values of these examples. Reaction time will also vary, and instead of 1.5 seconds, a distracted, unaware, or skeptical driver could take as long as 3 or 6 seconds to respond. Figures 2-8 and 2-9 illustrate the maneuver limits for avoiding a stopped object by braking and by steering, assuming a deceleration of 0.8 g’s and a lateral acceleration of 0.5 g’s.
Example: Braking Maneuver Limits 0 20 40 60 0 200 400 600 800 Range (ft.) Relative Velocity (mph) 1.5 sec 3.0 sec 6.0 sec Response Time:
Figure 2-8: Example: braking maneuvering limits for response times of 1.5, 3.0, and 6.0 seconds.
Example: Steering Maneuver Limits
0 20 40 60 0 200 400 600 800 Range (ft.) Relative Velocity (mph) 1.5 sec 3.0 sec 6.0 sec Response Time:
Figure 2-9: Example: steering maneuver limits for response times of 1.5, 3.0, and 6.0 seconds.
To avoid an accident, a driver who responds in 3 seconds, as opposed to 1.5 seconds, would need to be alerted 420 feet from the hazard to avoid a collision (an increase of 130 feet). The steering response limit increases similarly with a 3 second reaction (365 feet as opposed to 230 feet). A reaction time of 6 seconds or more further increases the required alert distance, which will increase the number of unnecessary alerts. Decreasing the driver’s response time allows the thresholds to be set closer to the hazard.
2.4.2. Time-to-Collision Alerting Thresholds
If the vehicle’s current trajectory will intercept a hazard, the time-to-collision (TTC) value represents the amount of time before a collision will occur, given the current dynamic states of both the vehicle and the hazard (Equation 4).
Velocity
lative
Re
Range
V
V
D
D
Velocity
Distance
TTC
Hazard Driver Hazard Driver=
−
−
=
Δ
Δ
=
This relationship between range and relative velocity is also equivalent to the slope between any point on the state trajectory and the origin as represented in the state-space diagram. Referring to the example of a stopped object on a highway, Table 2-1
describes the TTC values at which the driver would need to be alerted, assuming
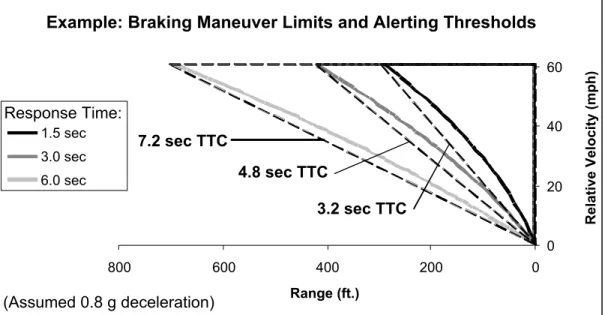
response times of 1.5, 3.0, and 6.0 seconds. Figures 2-10 and 2-11 display these notional thresholds in reference to the maneuvering limits on the state-space representation.
Table 2-1: Alerting threshold TTC values for 1.5, 3.0, and 6.0 second response times for evasive braking and steering maneuvers for an assumed maximum initial speed of 60 mph.
Response Time:
Maneuver:
1.5 sec 3.0 sec 6.0 secBraking to stop
(0.8 g deceleration) 3.2 4.8 7.2
Steering to avoid
(0.5 g lateral acceleration) 2.6 4.1 7.1
Response Time:
Example: Braking Maneuver Limits and Alerting Thresholds
0 20 40 60 0 200 400 600 800 Range (ft.) Relative Velocity (mph) 1.5 sec 3.0 sec 6.0 sec 7.2 sec TTC 4.8 sec TTC 3.2 sec TTC (Assumed 0.8 g deceleration)
Figure 2-10: Example braking maneuver limits and corresponding notional alerting thresholds.
Response Time:
Example: Steering Maneuver Limits and Alerting Thresholds
0 20 40 60 0 200 400 600 800 Range (ft.) Relative Velocity (mph) 1.5 sec 3.0 sec 6.0 sec
(Assumed 0.5 g lateral acceleration) 7.2 sec TTC
4.8 sec TTC
3.2 sec TTC
Figure 2-11: Example steering maneuver limits and corresponding notional alerting thresholds.
The uncertainty in the future system state causes false hazard identifications at impractically distant TTC values. Considering the proximity of motor vehicles on a roadway, as well as the speed with which speed and trajectory can change, alerting at high TTC thresholds will cause frequent unnecessary alert activations. If the driver’s response time is decreased, a successful maneuver will not depend on an alerting threshold that causes an unacceptable frequency of unnecessary alerts.
2.4.3. The System Operating Characteristic Curve
This fundamental tradeoff between providing the driver more time in which to respond and alerting the driver unnecessarily is formalized in an analytical model called the System Operating Characteristic (SOC) curve [5, 29]. The SOC curve is constructed much like a Receiver Operator Characteristic (ROC) curve in signal detection theory in that for any time at which an alert is issued, the curve
simultaneously represents the probabilities that the alert is both successful (signal) and unnecessary (noise). The curve is constructed by plotting the probabilities of multiple alert thresholds at various times or distances from the hazard (Figure 2-12). SOC curves are more comprehensive than ROC curves, however, because they encapsulate all
components of the system that influence performance, such as the sensors, prediction algorithms, and operator reaction. For a FCWS, the system would also include the driver’s perception of the alert, the assessment of the potential hazard, and the subsequent evasive maneuver.
P(Unnecessary Alert) P(Successful Alert) 1.0 0.2 0.4 0.6 0.8 0.0 0.2 0.4 0.6 0.8 1.0 Far range Close range Collision System Curve
Figure 2-12: An example SOC curve.
As the alerting threshold is set farther away from the driver, the probability that an alert is unnecessary increases because the hazard will likely be avoided had the alert not been provided. On the other hand, an unnecessary alert is also considered
successful because, by definition, no collision occurs. However, as the threshold is placed closer to the driver, the probability of a successful outcome decreases because
At close thresholds, the alerting system is confident that the driver is about to unwittingly collide with another vehicle or object, but the driver has not been given adequate time to respond appropriately.
P(Unnecessary Alert) P(Successful Alert) 1.0 0.2 0.4 0.6 0.8 0.0 0.2 0.4 0.6 0.8 1.0 P(Unnecessary Alert) P(Successful Alert) 1.0 0.2 0.4 0.6 0.8 0.0 0.2 0.4 0.6 0.8 1.0 P(Unnecessary Alert) P(Successful Alert) 1.0 0.2 0.4 0.6 0.8 0.0 0.2 0.4 0.6 0.8 1.0
(A)
(B)
(C)
P(Unnecessary Alert) P(Successful Alert) 1.0 0.2 0.4 0.6 0.8 0.0 0.2 0.4 0.6 0.8 1.0 P(Unnecessary Alert) P(Successful Alert) 1.0 0.2 0.4 0.6 0.8 0.0 0.2 0.4 0.6 0.8 1.0 P(Unnecessary Alert) P(Successful Alert) 1.0 0.2 0.4 0.6 0.8 0.0 0.2 0.4 0.6 0.8 1.0(A)
(B)
(C)
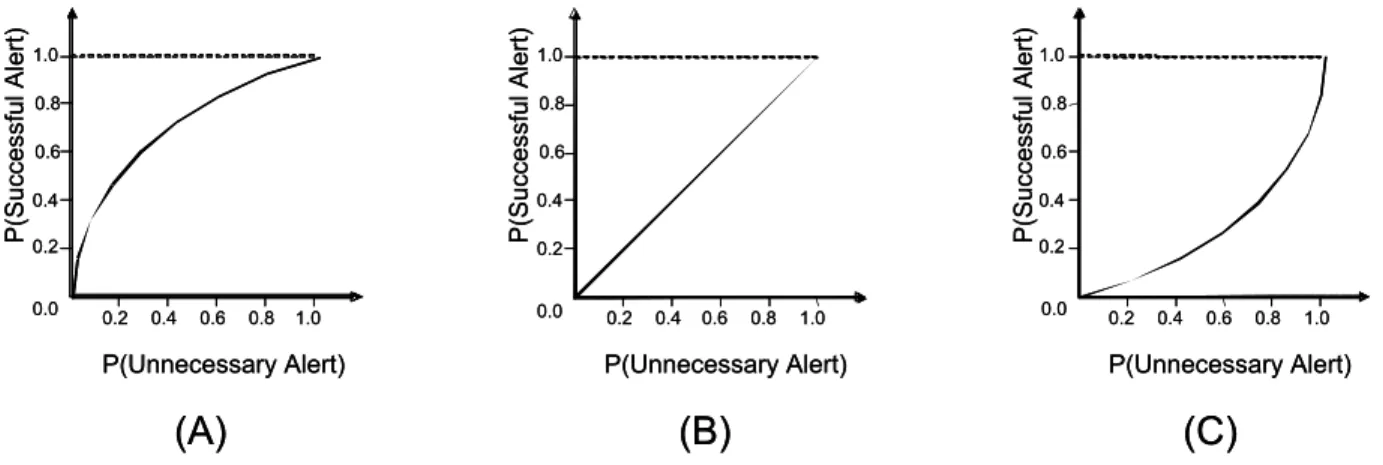
Figure 2-13: Various degrees of system benefit as expressed by the SOC curve.
An ideal system will operate in the upper left-hand corner, where all alerts are 100% necessary and successful. Curves that are closer to this point represent systems that are more effective than those with curves that are farther away. For example, consider Figure 2-13: (A) shows a positive system benefit (the probability of influencing a successful response is greater than probability that the alert is not useful); (B) shows a neutral performance (an alert is just as likely to be successful as it is unnecessary); and (C) shows a negative system benefit (the driver is more likely to avoid an accident without the system). The SOC curves are not static, and can change based on
environmental conditions, the driver’s acceptance of the system, and other factors that influence the effectiveness of the FCWS. A system that quickly annoys the driver with an excess number of false alerts will lose the driver’s trust, and may shift to reflect a more neutral curve as the driver chooses to ignore the warnings. Likewise, a system may represent a negative system benefit if it distracts the driver during a critical maneuver and, in fact, causes an accident.
From these representations of system behavior, the placement of the alerting thresholds is chosen based on the costs both of a missed detection and of an
unnecessary alert. For example, the cost of a missed detection could be considered the increased probability that a collision will occur, whereas the cost of an unnecessary alert could be the reduced system effectiveness resulting from the driver’s loss of trust. The
slope of the SOC curve is equivalent to the ratio of these costs, with the optimal point of notification where the two costs are equal. If the costs are quantifiable, this point occurs when the slope of the curve is equal to 1 (Equation 5) [5]. This is consistent with the SOC representation: if the cost of a collision is infinity (missed detections are to be avoided at all costs and the cost of an unnecessary alert is negligible), an alerting threshold for a beneficial system (Figure 2-13.A) will be placed as far to the right as possible, where the slope of the curve is horizontally asymptotic. More time in which to react is, in most cases, beneficial, but the high frequency of unnecessary alerts will begin shifting the curve to resemble Figure 2-13.B. The constant slope indicates that at this level of performance, it does not matter when the driver is alerted since collisions are just as likely to be avoided with or without the system. If the FCWS then begins to exhibit a negative benefit (Figure 2-13.C), the driver should not be alerted because this would risk causing an accident.
(
)
(
missed
detection
)
1
C
alert
y
unnecessar
C
=
2.5. Proposed Design Features
2.5.1. Multi-Stage Alerting
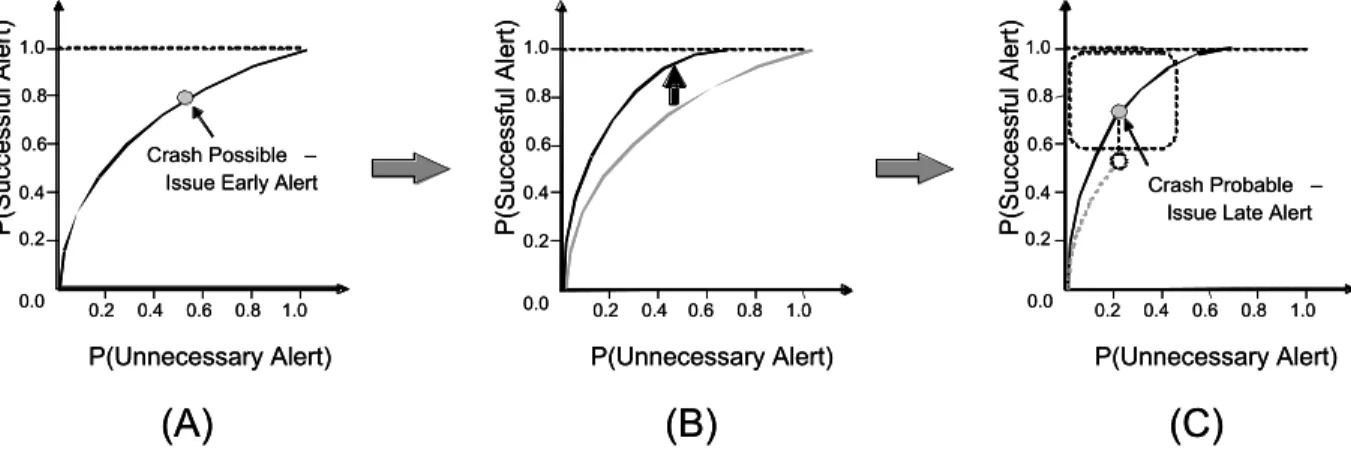
A multi-stage alerting configuration that alerts the driver at earlier, more conservative thresholds will provide more time in which to respond and increase the probability of a successful maneuver. Given the SOC curve in Figure 2-14.A, it is not probable that a system will successfully alert the driver when sufficient evidence indicates that a collision is about to occur. If the system were to, instead, issue an earlier, minimally obtrusive alert when the likelihood of a collision is still low, but possible, the driver will be conditioned to respond more quickly (for example, within 1.5 seconds) and appropriately if and when evasive action is necessary. An earlier threshold does not alert the driver when the situation requires a last-second response; instead, knowing that a crash is possible, the driver may reduce speed, turn slightly, or perform a similar low-level maneuver. Evasive maneuvers of greater magnitude decrease the probability of a successful response because the driver is more likely to lose control of the vehicle or lose awareness of obstacles in the surrounding
controlled, appropriate response that increases the probability that the alert is
successful, and shifts the SOC curve closer to the ideal operating point (Figure 2-14.B).
P(Unnecessary Alert) P(Successful Alert) 1.0 0.2 0.4 0.6 0.8 0.0 0.2 0.4 0.6 0.8 1.0 Crash Possible – Issue Early Alert
P(Unnecessary Alert) P(Successful Alert) 1.0 0.2 0.4 0.6 0.8 0.0 0.2 0.4 0.6 0.8 1.0 P(Unnecessary Alert) P(Successful Alert) 1.0 0.2 0.4 0.6 0.8 0.0 0.2 0.4 0.6 0.8 1.0 Crash Probable – Issue Late Alert
(A)
(B)
(C)
P(Unnecessary Alert) P(Successful Alert) 1.0 0.2 0.4 0.6 0.8 0.0 0.2 0.4 0.6 0.8 1.0 Crash Possible – Issue Early AlertP(Unnecessary Alert) P(Successful Alert) 1.0 0.2 0.4 0.6 0.8 0.0 0.2 0.4 0.6 0.8 1.0 P(Unnecessary Alert) P(Successful Alert) 1.0 0.2 0.4 0.6 0.8 0.0 0.2 0.4 0.6 0.8 1.0 Crash Probable – Issue Late Alert
(A)
(B)
(C)
Figure 2-14: An SOC curve representation of the benefits of multi-stage alerting.
If the situation continues to pose an imminent threat, the system can issue a more serious alert in a region that maintains a desired probability of success as well as the desired confidence that the alert is necessary (indicated by the box in Figure 2-14.C). Had no conditioning occurred, and the system remained on the original curve, the probability that the driver would have successfully avoided the hazard would be significantly decreased. If only the late alert is issued, it is not certain the driver will be able to respond quickly enough to avoid a collision, especially if he or she is distracted or momentarily skeptical that a response is necessary.
(A)
(B)
(C)
Figure 2-15: An example implementation of a multi-stage alerting configuration.
A multi-stage FCWS configuration will not be consistently beneficial if the driver cannot tolerate the increased frequency of unnecessary alerts. The early alert is not intended to prompt an immediate evasive maneuver, therefore the alerting interface
should not imply as such. An obnoxious stimulus will annoy and distract the driver if frequent alerts are not necessary. A less obtrusive, advisory alert will mitigate this problem. Figure 2-15 demonstrates an example implementation of a multi-stage alerting system with an in-dash display. In (A), the TTC value with respect to the lead vehicle has not crossed the early threshold, and no alert is currently displayed. As the lead vehicle slows down, an advisory alert activates, informing the driver that a crash is possible (B). As the lead vehicle stops, and the TTC value decreases, the late alert
activates, indicating that an immediate response is necessary to avoid a collision (C). The late alert is designed to be much more visually conspicuous, and for example, could be accompanied by an audio alert.
2.5.2. Directional Alerting
A system that alerts earlier and more often is also more likely to be accepted if the driver understands why the alert is issued, even if it is unnecessary. Directional alerting directs the driver’s attention to the location of the hazard that caused the alert activation, which promotes trust in the FCWS by showing the driver the motivation for the system’s judgments (Figures 2-16 – 2-18). Explicitly pointing to the hazard’s
locations also decreases the amount of time that is required to scan and verify the cause of the alert. For example, with earlier alerting thresholds, there may be situations in which the hazard is not obvious to the driver, either because it is too far away or the changes in the environment are too subtle to notice. This ambiguity can be exaggerated by lack of awareness [30], which would result in longer assessment times. By indicating the location of the hazard via the alerting display, ambiguity is more quickly resolved.
Figure 2-16: An example implementation of multi-stage directional alerting (1 of 3); locational stimulus highlights objects in the environment (diamond and octagon on windshield).
Figure 2-18: An example implementation of multi-stage directional alerting (3 of 3).
Earlier alerting also provides an ancillary benefit: it confirms the system is working. The probability that any particular driver will have an accident is fairly low for any given trip. Although it is fortunate that collisions and the events leading up to collisions are infrequent from an individual driver’s point of view, this does not provide many opportunities to truly benefit from the FCWS or develop an understanding of how it works. Anti-lock brakes encounter similar problems: they lie dormant until absolutely needed, denying drivers the frequent exposure that would otherwise build this understanding. Directional alerting mitigates the undesired driver reactions that would otherwise make frequent exposure detrimental and transforms an ambiguous notification into an advantageous situation assessment aid. For instance, assume an oncoming vehicle steers into the driver’s lane while passing another vehicle. The FCWS identifies the oncoming vehicle as a hazard for the few seconds it remains in front of the driver. The subsequent alert is technically unnecessary, because no collision occurs after the vehicle completes the pass; however, the alert is useful in maintaining the driver’s awareness of the environment, and if the situation had become more dangerous, an aware driver would be conditioned to respond more effectively.
3. Experimentation
alerting. Subjects were then equipped with the various systems, and asked to complete test scenarios which placed them in multiple hazardous situations that would result in a collision if no response was made. All hazardous events were designed to present the driver with similar event dynamics to allow comparison across different events during which different system configurations were in effect. Subjects were asked to follow several objectives in priority order that the emphasized the primary goal of collision avoidance. Controlled driver distractions were introduced through secondary tasks, as well as with the design of visual elements within the driving environment. Subjective data was collected after the testing was completed.
A pilot study was conducted prior to this experiment, through which the alerting displays, alerting thresholds, driving environment, hazardous situations, and
experimental protocol were improved and refined. The pilot study results indicated several promising trends in support of multi-stage and directional alerting. These results motivated the main experiment, and were ultimately reproduced with more statistical power. Although integral to the design of the main experiment, the pilot study will not be discussed in this thesis.
3.1. Hypotheses
Three hypotheses were tested:
H1: When drivers are alerted to potential collisions, they will respond more effectively than when they are not alerted.
H2: When drivers are provided earlier alerts, in addition to late alerts, they will respond more effectively than when they receive only late alerts.
H3: When drivers are provided directional early alerts, they will respond more effectively than when they receive non-directional early alerts.
The first hypothesis pertains to the absolute benefit of alerting vs. no-alerting, and the second two hypotheses address the proposed designed features of multi-stage and directional alerting.
3.2. Experimental Design
The study is designed to examine a single fixed factor (the FCWS configuration) across four levels (Figure 3-1). Each subject was exposed to all of the FCWS
configurations, and each configuration was active for two consecutive threat events. The experiment was designed as a repeated measures study, and therefore the order of treatments was randomized, as was their assignment to the subjects (see Appendix A for a summary of the treatments).
T1
Alerting System Configuration:T2
T3
T4
No Alerting Late Alerting Only Early Non-Directional + Late Alerting Early Directional + Late AlertingT1
Alerting System Configuration:T2
T3
T4
No Alerting Late Alerting Only Early Non-Directional + Late Alerting Early Directional + Late AlertingFigure 3-1: The experimental design: 1 fixed factor across 4 levels, representing 4 treatments.
There are numerous variables whose values were recorded at each time step within the simulator. Variables that pertained to the driver’s vehicle include distance driven, velocity, brake input, accelerator input, yaw rate, steering wheel angle, steering wheel angle rate, and number of collisions. There were variables that indicated the current threat event in which the data was being recorded as well as the alerting system configuration that was currently in effect. The on/off states of the early and late alerts were also tracked, regardless of the alerting system configuration. Even though not all the systems displayed late and/or early alerts to the driver, the simulator still recorded the times at which the alerting thresholds were crossed. When the thresholds were crossed, additional data was saved that identified the unique vehicle ID number, the range between the hazard and the driver’s vehicle, relative velocity, and the TTC value. From this information, the dependent variables that were analyzed include:
Percentage of collisions given hazards.
Percentage of successful outcomes given late alerts. Response times.
Response behavior.
Secondary task performance.
Responses to unnecessary alert activations.
Subjective responses targeting trust, acceptability, and confidence in the FCWS.
3.3. FCWS Configurations
3.3.1. Alerting Displays
Three FCWS alerting displays were emulated within the driving simulator: a late alert, a non-directional early alert, and a directional early alert. Directional alerting is only implemented for the early alerting threshold because it is assumed that by the time the late alert activates, the hazard will be immediately apparent and the driver will not need assistance in identifying its location. The late alert display consists of a yellow bar that appears across the length of the dashboard as well as an audio file that has been previously designed for an automotive collision warning application (Figure 3-2). The non-directional early alert is represented as a fixed yellow frame above the dashboard (Figure 3-3). This icon does not move, and functions similarly to a light turning on or off when the early alert threshold is crossed. The directional early alert is similar to the non-directional display, except that the frame overlays the hazard that caused the alert and continuously changes position to remain fixed on the hazard (Figure 3-4). The alerting displays were combined to form three alerting system configurations: Late Alerting Only (the least amount of support), Early Non-Directional plus the late alert, and Early Directional plus the late alert (the highest amount of support). There was a null configuration as well, in which no alerting was provided (No Alerting). The hazardous situations were exclusively designed to involve vehicles (including cyclists); therefore, the FCWS was not set to monitor pedestrians and miscellaneous objects. The system configurations were also not intended to issue multiple, simultaneous alerts, but the testing did not require this capability.
Figure 3-2: The late alert display (without the audio).
Figure 3-3: The Early Non-Directional system configuration with (right) and without the late alert.
3.3.2. Alerting Thresholds
The alerting thresholds are defined by TTC values (see Section 2.4.2). Although simplified, studies have demonstrated the effectiveness of this threshold criterion [31]. TTC successfully captures the ways in which the situation dynamics change as both the speed of the driver’s vehicle and the hazard vary, as opposed to alerting at an absolute distance from the hazard. There are more sophisticated alerting algorithms, but many are based on variant forms of TTC [32-36] . Previous studies have implemented a semi-continuous alerting scheme [37, 38], but the study is specifically designed to examine a change in performance that may result from conditioning the driver with a single conservative, early alert. Therefore, the FCWS configurations employ two thresholds: an early alert set farther from an impending collision and a late alert which is set closer. The late alert threshold is defined as the moment at which action is necessary, after which a collision will occur if the driver does not respond shortly thereafter.
The alerting threshold TTC values were set according to the example in the kinematic analysis (Section 2.4). The late alert threshold was set to 2.4 seconds TTC, which is consistent with the amount of time required to perform an evasive maneuver that includes both braking and steering, assuming an immediate response at 60 mph. The early alert threshold was set to 5.4 seconds TTC, midway between the necessary TTC thresholds assuming a response time between 1.5 and 6.0 seconds.
The algorithms that were constructed from these thresholds continuously examined the positions of the driver’s vehicle and of various hazards in the
environment and calculated the amount of time that remained until the two positions intersected, i.e., the TTC value. If this value fell below 5.4 seconds TTC, the early alert display would activate (if the assigned system configuration incorporated an early alert). Likewise, if the value fell below 2.4 seconds TTC, the late alert display would turn on (if applicable).
3.4. Simulated Environment
3.4.1. Simulated Vehicle and Driving Environment
The subjects were provided a simulated blue compact passenger vehicle with which to complete the testing. The vehicle could decelerate at a maximum of 0.8 g’s, and accelerate at a maximum of 0.35 g’s. The maximum speed was 65 mph, and the
transmission was automatic. Subjects were provided a rear-view mirror, an analog tachometer, and an analog speedometer, but no secondary driving controls such as turn-signals.
All driving occurred on a simulated four-lane, high-speed rural road with 12 foot lane widths and no median. The driver was asked to maintain a speed between 55 and 60 mph throughout the testing and training. For simplicity, the scenarios assumed ideal visibility and road conditions; no artificial fog was added and vehicle dynamics were not adjusted to simulate wet or icy roads. Scenery elements included trees and speed limit signs, but no buildings or pedestrians. A continuous stream of oncoming traffic was placed on the opposite side of the road, and surrounding traffic was positioned around the driver. There were cross-roads with two-way stop signs, at which stopped vehicles were randomly placed. Stationary vehicles and moving cyclists were
positioned randomly along the shoulders of both sides of the road. The driver always had the right-of-way and was never required to stop. There were no traffic lights or other road elements that required the driver to slow down. The driver was occasionally required to change lanes at certain locations within the scenario, and was informed when to do so.
3.4.2. Controlled FCWS Activations
Each testing scenario was designed to place the driver in hazardous situations that would result in a collision if the driver did not respond. These threat events
concluded with an accident only if the driver was not aware of the potential collision, or if the driver’s response was not sufficient in avoiding the hazard. The timing of these events is not trivial. Comparisons amongst the collision warning systems would be difficult if not all subjects were exposed to the systems they were provided. If the driver never crosses the early alerting threshold, the early alert will never activate. The situation cannot be so mild and transparent that the resultant conservative behavior never produces the desired system activations; on the other hand, the situation cannot be designed so that it induces an artificial, unavoidable collision. Also, the dynamics of the event must allow the driver to cross the early alert threshold with enough time to perform an evasive response before crossing the late threshold.
![Figure 3-7: An example of a map used for the map-reading task [44].](https://thumb-eu.123doks.com/thumbv2/123doknet/14063395.461657/51.918.311.662.559.916/figure-example-map-used-map-reading-task.webp)